



1 INTRODUCTION
Measuring signals from the early Universe is a major goal of many current and future low-frequency radio telescopes (MWA, PAPER, LOFAR, SKA, LEDA, HERAFootnote 1 , Tingay et al. Reference Tingay, Goeke, Bowman and Emrich2013; Parsons et al. Reference Parsons2010; Stappers et al. Reference Stappers, Hessels, Alexov and Anderson2011; Greenhill & Bernardi Reference Greenhill, Bernardi, Komonjinda, Kovalev and Ruffolo2012; van Haarlem et al. Reference van Haarlem, Wise, Gunst and Heald2013). The Epoch of Reionisation is the period in the early Universe marking the end of the Dark Ages, when the first sources of radiation ionised the neutral intergalactic medium. The evolution of structure before and during this period can be probed by observing the neutral hydrogen emission line at rest frequency of 1420 MHz, because it traces the distribution and state of hydrogen as a function of redshift. At the redshifts where the EoR signal is expected to be detected (z ~ 6 − 10), this transition is observable with low-frequency instruments (ν ~ 130 − 200 MHz).
The signal is predicted to be weak compared with other radio sources at low frequencies; temperature fluctuations against the Cosmic Microwave Background are expected to be ~ 10s mK, while emission from foreground continuum sources (e.g., Galactic synchrotron, diffuse free-free emission, supernova remnants, radio galaxies) can exceed 100s K (Pritchard & Loeb Reference Pritchard and Loeb2008; Jelić et al. Reference Jelić, Zaroubi, Labropoulos, Bernardi, de Bruyn and Koopmans2010; Mesinger, Furlanetto, & Cen Reference Mesinger, Furlanetto and Cen2011). Careful discrimination of spectral line signal from the early Universe from contaminating sources relies on the distinct spatial and spectral structure for these sources; radio galaxies and other point source-like foregrounds contribute power on small angular scales, while the EoR signal is expected to peak on larger scales (a few degrees). Diffuse emission from the Galaxy, in particular in the Galactic plane, are spatially similar to this signal (Jelić et al. Reference Jelić, Zaroubi, Labropoulos, Bernardi, de Bruyn and Koopmans2010). Conversely, the spectral structure of foreground continuum sources versus spatially-variable spectral line emission from the EoR provides a strong discriminator for the signals. Coupled with the weakness of the expected EoR signal, and the need to combine information from across the sky (stack the signal to increase detectability), statistical estimates are a useful tool for EoR detection and estimation. In particular, the two-dimensional power spectrum (signal variance as a function of angular and line-of-sight mode) is a useful metric for discriminating EoR signal from foregrounds on the basis of spatial and spectral differences, and for increasing detectability by combining signal statistically (Morales & Hewitt Reference Morales and Hewitt2004; McQuinn et al. Reference McQuinn, Zahn, Zaldarriaga, Hernquist and Furlanetto2006). Measuring the statistical EoR signal relies on (1) a stable and calibratable instrument, and (2) sufficient data to reduce thermal noise, measure and remove foregrounds, and reduce cosmic variance (Mellema et al. Reference Mellema2013).
Statistical measurement of the EoR signal has many challenges, including reduction of noise to yield a detection. The two primary sources of noise for a stable and well-calibrated instrument (i.e., one where radiometric noise exceeds calibration uncertainties and calibration errors are minimal) are radiometric (stochastic measurement noise because we are sampling the signal) and cosmic variance (uncertainty in measurement of a stochastic global signal because it is estimated by finite data). The most effective methods for reducing these noise contributions are not the same.
The expected EoR signal power is low at very large angular scales, with the peak power occurring on scales of ~ 2 degrees (see Mellema et al. Reference Mellema2013, and references therein). Large scales are sampled by the shortest baselines of an interferometer, and most arrays have few. Therefore, at low k, we expect thermal noise to dominate. At larger k, where the EoR signal is expected to be strongest, and baselines are numerous (by design for an EoR experiment), cosmic variance becomes relatively more important. The balance between these coherent and incoherent modes is the subject of this note.
Noise analysis has been performed before to predict the performance of telescopes (Morales & Hewitt Reference Morales and Hewitt2004; McQuinn et al. Reference McQuinn, Zahn, Zaldarriaga, Hernquist and Furlanetto2006; Parsons et al. Reference Parsons, Pober, McQuinn, Jacobs and Aguirre2012; Beardsley et al. Reference Beardsley, Hazelton, Morales and Arcus2013; Mellema et al. Reference Mellema2013), but these have typically used an approximate form for the noise estimate. In this work we build on the existing literature by: (1) deriving a framework that correctly accounts for the telescope’s beam pattern (and therefore the level of coherence/incoherence in a measurement set. See Thyagarajan et al. Reference Thyagarajan2013, who also considered this aspect); (2) including covariances between angular modes in the calculation, and (3) applying it to the specific case of comparing different observing modes. In their work, Thyagarajan et al. (Reference Thyagarajan2013) considered both tracked scans and zenith scans with independent pointing centres. Parsons et al. (Reference Parsons, Pober, McQuinn, Jacobs and Aguirre2012) also considered drift scans for exploring observing options for PAPER. We consider a scan with a constant evolution of the pointing centre, as the Earth rotates, requiring a robust framework to capture the time-dependent coherence of two baselines relative to each other.
Traditional tracked observing modes, where the pointing and phase centres align and track a single sky position, are undesirable for aperture arrays with analogue beamformers, where such modes produce a time-variable sky beam because the individual antenna elements have discrete timing offset settings (‘delays’). Instead, two modes can be employed, which have different calibration and EoR measurement properties: (1) a “zenith drift”, where the pointing centre remains fixed at the zenith, and the phase centre tracks a single position on the sky, and (2) “drift + shift”, a hybrid mode where the beam has fixed, discrete pointing centres, with the sky drifting during each fixed pointing. While providing a stable, constant beam, the former sees a time-variable sky, thereby reducing the coherence of measurements across a long observation. I.e., fewer individual visibility measurements sample the same sky, at the same baseline vector. For EoR statistical estimation, sample coherence is used to combine visibilities directly. Coherent addition is desirable because thermal noise is reduced the most effectively. On the other hand, cosmic variance does not benefit from redundant samples of the same sky; coherent sampling maintains cosmic variance. Measurements that sample the same modes on the sky, but at different orientations or pointing in different directions, can be added incoherently (powers added). This has less benefit for reducing thermal noise, but does reduce cosmic variance (independent samples of the sky).
The Murchison Widefield Array (MWA) is a low-frequency (80–300 MHz) radio telescope composed of 128 tiles operating in the Western Australian desert (Tingay et al. Reference Tingay, Goeke, Bowman and Emrich2013). It has a concentrated core of 50 tiles within ~ 300 m, and the remainder of the tiles spread over an area of diameter ~ 3 km. Each tile consists of 16 phased dual-polarisation dipoles in a 4-by-4 grid. One of the MWA’s primary science goals is statistical detection of the EoR in the redshift range z ~ 6 − 10 (Bowman et al. Reference Bowman, Cairns, Kaplan, Murphy and Oberoi2013). In the current semester it is observing two EoR fields away from the Galactic plane, and in relatively cold patches of the sky, over two frequency ranges (139–169 MHz, 167–197 MHz) with 40 kHz spectral resolution. The initial experiment will be based on two fields with a combined observing time of ~ 1000 hours. Beardsley et al. (Reference Beardsley, Hazelton, Morales and Arcus2013) estimate that a 14σ detection is possible in the spherically-averaged power spectrum for this experiment.
In Section 2 we describe the power spectrum, and its derivation from an interferometric dataset. We then connect the measured data to the information it provides about the temperature fluctuations in a given sky mode, and use this model to propagate the noise terms to the final power spectrum. In Section 3 we describe the differences in the noise estimates for each observing mode, based on the way in which the telescope’s beam pattern samples the sky. We then apply the model to a simulation of the EoR experiment for MWA in Section 4. Throughout we use comoving co-ordinates in a ΛCDM cosmology, with Ω
m
= 0.27, $\Omega _\Lambda = 0.73$
, Ω
k
= 0.0, and H
0 = 100h (Bennett et al. Reference Bennett2012). Matrices are denoted in bold font, and vectors are denoted by an overline.
$\Omega _\Lambda = 0.73$
, Ω
k
= 0.0, and H
0 = 100h (Bennett et al. Reference Bennett2012). Matrices are denoted in bold font, and vectors are denoted by an overline.
2 METHODS
The power at a given scale (a “mode”) is given by:
 \begin{eqnarray}
P(\overline{u})\delta _{uu^\prime } = \langle S^\dagger (\overline{u}) S(\overline{u}^\prime) \rangle = \langle \Delta \tilde{T}^\dagger (\overline{u}) \Delta \tilde{T}(\overline{u}^\prime)\rangle ,
\end{eqnarray}
\begin{eqnarray}
P(\overline{u})\delta _{uu^\prime } = \langle S^\dagger (\overline{u}) S(\overline{u}^\prime) \rangle = \langle \Delta \tilde{T}^\dagger (\overline{u}) \Delta \tilde{T}(\overline{u}^\prime)\rangle ,
\end{eqnarray}
where ${S}({\overline{u}})$
is the complex-valued Fourier transform of the sky signal and traces temperature fluctuations,
${S}({\overline{u}})$
is the complex-valued Fourier transform of the sky signal and traces temperature fluctuations, $\Delta {\tilde{T}}(\overline{u})$
, the ensemble average is taken over different samples from the sky, and the delta function has units of volume and connects the integrated sky power (K2.sr.Hz) with the integrated sky signal (K.sr.Hz).
$\Delta {\tilde{T}}(\overline{u})$
, the ensemble average is taken over different samples from the sky, and the delta function has units of volume and connects the integrated sky power (K2.sr.Hz) with the integrated sky signal (K.sr.Hz).
The aim of this paper is to quantify the information our data contain about the power in mode u, P(u). Typically, one would write a description of the forward model connecting the sky with the measurements, and compare the noise properties of the measurement set. However, because the number of measurments (visibilities) is very large compared with the number of sky modes in which we are interested (millions per day compared with hundreds for the whole observation), it is prohibitive to describe the full covariance in the measurement basis. Instead, we explore the inverse problem, where we describe the information available in a particular sky mode due to the underlying measurement set. Working in this basis provides a simpler framework with which to tackle the problem.
2.1 Coherent average visibility in cell $\overline{u}$

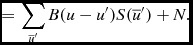
The true sky signal is shaped by the antenna primary beam, and the measured visibilities sample a range of modes within this beam-attenuated sky. Using the convolution theorem and considering the measured signal to be a two-dimensional Fourier transform, the measured visibility is the convolution of the sky signal, $S(\overline{u})$
, with the Fourier representation of the primary beam and the line-of-sight (w) term,
$S(\overline{u})$
, with the Fourier representation of the primary beam and the line-of-sight (w) term, $B(\overline{u})$
. Here we approximate the continuous transform by a discrete transform:
$B(\overline{u})$
. Here we approximate the continuous transform by a discrete transform:
 \begin{eqnarray}
V(\overline{u}) &=& {B}(\overline{u}) \ast S(\overline{u}) + N
\end{eqnarray}
\begin{eqnarray}
V(\overline{u}) &=& {B}(\overline{u}) \ast S(\overline{u}) + N
\end{eqnarray}
 \begin{eqnarray}
&=& \displaystyle \sum _{{\overline{u}}^\prime } B(u-u^\prime)S(\overline{u}^\prime) + N.
\end{eqnarray}
\begin{eqnarray}
&=& \displaystyle \sum _{{\overline{u}}^\prime } B(u-u^\prime)S(\overline{u}^\prime) + N.
\end{eqnarray}
N is the radiometric noise, which is white Gaussian distributed in the measurement basis. B encodes the Fourier-space primary beam shape and the discrete telescope sampling of modes (the uv coverage), and the smearing of sky signal by non-zero w terms,
 \begin{equation}
B(\overline{u}) \equiv \displaystyle \int \frac{B(l,m)}{n}\exp {-2\pi {i}(ul+vm+w(n-1))}dldm, \end{equation}
\begin{equation}
B(\overline{u}) \equiv \displaystyle \int \frac{B(l,m)}{n}\exp {-2\pi {i}(ul+vm+w(n-1))}dldm, \end{equation}
where $n=\sqrt{1-l^2-m^2}$
. We are interested in determining the underlying sky distribution, S, at a given angular scale, u, given the measured visibilities,
$n=\sqrt{1-l^2-m^2}$
. We are interested in determining the underlying sky distribution, S, at a given angular scale, u, given the measured visibilities, $V(\overline{u})$
. A vector of (N × 1) measured visibilities,
$V(\overline{u})$
. A vector of (N × 1) measured visibilities, $\overline{V}$
, is generated from an underlying (M × 1) sky distribution,
$\overline{V}$
, is generated from an underlying (M × 1) sky distribution, $\overline{S}$
, via a (N × M) matrix transform,
$\overline{S}$
, via a (N × M) matrix transform, ${\b B}$
, such that:
${\b B}$
, such that:
 \begin{equation}
\overline{V} = {\bm B}\overline{S}, \end{equation}
\begin{equation}
\overline{V} = {\bm B}\overline{S}, \end{equation}
where M ≪ N, in general. The beam matrix, ${\bm B}$
, is complex-valued, in general.
${\bm B}$
, is complex-valued, in general.
To form the coherent average of measured visibilities into modes $\overline{u}$
, we solve for
$\overline{u}$
, we solve for $\overline{S}(\overline{u})$
,
$\overline{S}(\overline{u})$
,
 \begin{equation}
\overline{S}(\overline{u}) = ({\bm B}^\dagger {\bm B})^{-1}{{\bm B}}^\dagger \overline{V},
\end{equation}
\begin{equation}
\overline{S}(\overline{u}) = ({\bm B}^\dagger {\bm B})^{-1}{{\bm B}}^\dagger \overline{V},
\end{equation}
where the square matrix inversion involves inverting an (M × M) Hermitian complex-valued matrix, which will be (almost) diagonal for independent modes, $\overline{u}$
. Note that this procedure does not recover full sky information; the sampling function of the interferometer does not provide complete uv-coverage, and the problem is under-constrained. Instead, this procedure distributes the measured visibility data across contributing sky modes, to represent the smearing of Fourier space by the primary beam (grids and weights). It also represents a continuous transform with a discrete approximation, which destroys some information.
$\overline{u}$
. Note that this procedure does not recover full sky information; the sampling function of the interferometer does not provide complete uv-coverage, and the problem is under-constrained. Instead, this procedure distributes the measured visibility data across contributing sky modes, to represent the smearing of Fourier space by the primary beam (grids and weights). It also represents a continuous transform with a discrete approximation, which destroys some information.
We do not measure $S(\overline{u})$
, but
$S(\overline{u})$
, but $V(\overline{u})$
, visibilities that include beam contributions and noise. The visibility is given by:
$V(\overline{u})$
, visibilities that include beam contributions and noise. The visibility is given by:
 \begin{eqnarray}
V(\overline{u}) = V^{21}(\overline{u}) + V^{F}(\overline{u}) + N,
\end{eqnarray}
\begin{eqnarray}
V(\overline{u}) = V^{21}(\overline{u}) + V^{F}(\overline{u}) + N,
\end{eqnarray}
where the terms are the 21 cm signal, foreground signal and noise, respectively, and
 \begin{equation}
N \sim \mathcal {CN}(0,\sigma ^2),
\end{equation}
\begin{equation}
N \sim \mathcal {CN}(0,\sigma ^2),
\end{equation}
describes the radiometric noise with variance, σ2. If we consider the covariance matrix of the data, we find;
 \begin{eqnarray}
{\bm C}_{\rm d} &=& {\bm C}^{21} + {\bm C}^{F} + {\bm C}^{N}\\
\end{eqnarray}
\begin{eqnarray}
{\bm C}_{\rm d} &=& {\bm C}^{21} + {\bm C}^{F} + {\bm C}^{N}\\
\end{eqnarray}
 \begin{eqnarray}
&\equiv & \left\langle V^{21}(\overline{u}) V^{21\dagger }(\overline{u}^\prime) \right\rangle + \left\langle V^{F}(\overline{u}) V^{F\dagger }(\overline{u}^\prime) \right\rangle + \sigma ^2{\bm I},
\end{eqnarray}
\begin{eqnarray}
&\equiv & \left\langle V^{21}(\overline{u}) V^{21\dagger }(\overline{u}^\prime) \right\rangle + \left\langle V^{F}(\overline{u}) V^{F\dagger }(\overline{u}^\prime) \right\rangle + \sigma ^2{\bm I},
\end{eqnarray}
where the first two terms correspond to the cosmic variance of the 21 cm signal and foregrounds, and the final term is the thermal noise contribution. In the analysis that follows we will retain the contribution from foreground signal as a separate term, and focus on the thermal noise and cosmological signal terms. As a signal, foreground contributions exhibit the same behaviour as cosmological signal (cosmic variance noise considerations). We will assume herein that the foregrounds have been removed to a certain level, but their residuals (which may be significant compared with the signal of interest) remain in the data. In the final analysis of the estimation performance of each method, we will consider uncontaminated regions of parameter space. For this work, where we focus on small k modes (short baselines), this will correspond to omitting the k ∥=0 mode in the power spectrum. We revisit the impact of foregrounds in Sections 4.1 and 6. An excellent recent discussion of the impact of foregrounds can be found in Thyagarajan et al. (Reference Thyagarajan2013).
2.2 Coherent combination of information: sky covariance
For each visibility, we compute the contribution to the sky at mode u:
 \begin{equation}
S(\overline{u}) = \left( {\bm B}^\dagger {\bm B} \right)^{-1} {\bm B}^\dagger V(\overline{u}^\prime).
\end{equation}
\begin{equation}
S(\overline{u}) = \left( {\bm B}^\dagger {\bm B} \right)^{-1} {\bm B}^\dagger V(\overline{u}^\prime).
\end{equation}
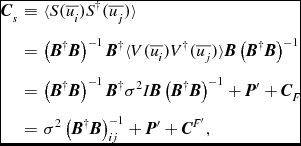
We form a grid of sky modes so as to properly sample the beam shape for imaging a large sky angle (necessary for the drift scan). This choice ensures coherence between adjacent modes for all observing strategies (the same visibilities contribute significantly to both modes). To determine the effective number of visibilities contributing coherently to a mode, and the covariance between modes, we compute the outer product of the sky signal in each mode (sky covariance matrix), given the information about that mode provided by the instrument:
 \begin{eqnarray}
{\bm C}_s &\equiv & \langle S(\overline{u_i}) S^{\dagger }(\overline{u_j}) \rangle \nonumber\\
&=& \left( {\bm B}^\dagger {\bm B} \right)^{-1} {\bm B}^\dagger \langle V(\overline{u_i}) V^{\dagger }(\overline{u_j}) \rangle {\bm B} \left( {\bm B}^{\dagger }{\bm B} \right)^{-1} \nonumber\\
&=& \left( {\bm B}^\dagger {\bm B} \right)^{-1} {\bm B}^\dagger \sigma ^2 I {\bm B} \left( {\bm B}^{\dagger }{\bm B} \right)^{-1} + {\bm P}^\prime + {\bm C}_F \nonumber\\
&=& \sigma ^2 \left( {\bm B}^{\dagger }{\bm B} \right)^{-1}_{ij} + {\bm P}^\prime + {\bm C}^{F^\prime },
\end{eqnarray}
\begin{eqnarray}
{\bm C}_s &\equiv & \langle S(\overline{u_i}) S^{\dagger }(\overline{u_j}) \rangle \nonumber\\
&=& \left( {\bm B}^\dagger {\bm B} \right)^{-1} {\bm B}^\dagger \langle V(\overline{u_i}) V^{\dagger }(\overline{u_j}) \rangle {\bm B} \left( {\bm B}^{\dagger }{\bm B} \right)^{-1} \nonumber\\
&=& \left( {\bm B}^\dagger {\bm B} \right)^{-1} {\bm B}^\dagger \sigma ^2 I {\bm B} \left( {\bm B}^{\dagger }{\bm B} \right)^{-1} + {\bm P}^\prime + {\bm C}_F \nonumber\\
&=& \sigma ^2 \left( {\bm B}^{\dagger }{\bm B} \right)^{-1}_{ij} + {\bm P}^\prime + {\bm C}^{F^\prime },
\end{eqnarray}
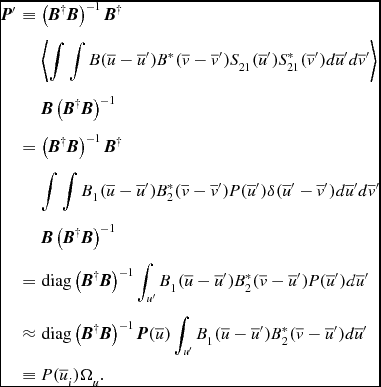
where
 \begin{eqnarray}
{\bm P}^\prime &\equiv & \left( {\bm B}^\dagger {\bm B} \right)^{-1} {\bm B}^\dagger \nonumber\\
&& \left\langle {\int\int B(\overline{u}-\overline{u}^\prime) B^\ast (\overline{v}-\overline{v}^\prime) S_{21}(\overline{u}^\prime) S_{21}^\ast (\overline{v}^\prime) d\overline{u}^\prime d\overline{v}^\prime } \right\rangle \nonumber\\
&& {\bm B} \left( {\bm B}^{\dagger }{\bm B} \right)^{-1} \nonumber\\
&=& \left( {\bm B}^\dagger {\bm B} \right)^{-1} {\bm B}^\dagger \nonumber\\
&& {\int\int B_1(\overline{u}-\overline{u}^\prime) B_2^\ast (\overline{v}-\overline{v}^\prime) P(\overline{u}^\prime) \delta (\overline{u}^\prime -\overline{v}^\prime) d\overline{u}^\prime d\overline{v}^\prime } \nonumber\\
&& {\bm B} \left( {\bm B}^{\dagger }{\bm B} \right)^{-1} \nonumber\\
&=& {\rm diag}\left( {\bm B}^\dagger {\bm B} \right)^{-1} \displaystyle \int _{u^\prime } B_1(\overline{u}-\overline{u}^\prime) B_2^\ast (\overline{v}-\overline{u}^\prime) P(\overline{u}^\prime) d\overline{u}^\prime \nonumber\\
&\approx & {\rm diag}\left( {\bm B}^\dagger {\bm B} \right)^{-1} {{\bm P}(\overline{u})} \displaystyle \int _{u^\prime } B_1(\overline{u}-\overline{u}^\prime) B_2^\ast (\overline{v}-\overline{u}^\prime) d\overline{u}^\prime \nonumber\\
&\equiv & {P(\overline{u}_i)}{\Omega _u}.
\end{eqnarray}
\begin{eqnarray}
{\bm P}^\prime &\equiv & \left( {\bm B}^\dagger {\bm B} \right)^{-1} {\bm B}^\dagger \nonumber\\
&& \left\langle {\int\int B(\overline{u}-\overline{u}^\prime) B^\ast (\overline{v}-\overline{v}^\prime) S_{21}(\overline{u}^\prime) S_{21}^\ast (\overline{v}^\prime) d\overline{u}^\prime d\overline{v}^\prime } \right\rangle \nonumber\\
&& {\bm B} \left( {\bm B}^{\dagger }{\bm B} \right)^{-1} \nonumber\\
&=& \left( {\bm B}^\dagger {\bm B} \right)^{-1} {\bm B}^\dagger \nonumber\\
&& {\int\int B_1(\overline{u}-\overline{u}^\prime) B_2^\ast (\overline{v}-\overline{v}^\prime) P(\overline{u}^\prime) \delta (\overline{u}^\prime -\overline{v}^\prime) d\overline{u}^\prime d\overline{v}^\prime } \nonumber\\
&& {\bm B} \left( {\bm B}^{\dagger }{\bm B} \right)^{-1} \nonumber\\
&=& {\rm diag}\left( {\bm B}^\dagger {\bm B} \right)^{-1} \displaystyle \int _{u^\prime } B_1(\overline{u}-\overline{u}^\prime) B_2^\ast (\overline{v}-\overline{u}^\prime) P(\overline{u}^\prime) d\overline{u}^\prime \nonumber\\
&\approx & {\rm diag}\left( {\bm B}^\dagger {\bm B} \right)^{-1} {{\bm P}(\overline{u})} \displaystyle \int _{u^\prime } B_1(\overline{u}-\overline{u}^\prime) B_2^\ast (\overline{v}-\overline{u}^\prime) d\overline{u}^\prime \nonumber\\
&\equiv & {P(\overline{u}_i)}{\Omega _u}.
\end{eqnarray}
Here, Ω
u
is an effective volume in Fourier space, which is equal to the beam area for a tracked scan (B
1 = B
2 for the whole observation). Consider what has occurred here: the instrument convolves the primary beam shape with the intrinsic sky signal (in the continuum limit) and samples this convolution at discrete points in the uv-plane. If the beam pointing changes during the observation (B
1 ≠ B
2), the two samples of the sky are more independent and the measurement-space covariance matrix is reduced in amplitude, thereby reducing the contribution to the total noise budget of cosmic variance. The normalisation by the diagonal components of the $( {\bm B}^\dagger {\bm B})^{-1}$
matrix removes (normalises) the improvement one would otherwise compute by sampling the sky coherently (i.e., sampling the same sky signal does not improve cosmic variance).
$( {\bm B}^\dagger {\bm B})^{-1}$
matrix removes (normalises) the improvement one would otherwise compute by sampling the sky coherently (i.e., sampling the same sky signal does not improve cosmic variance).
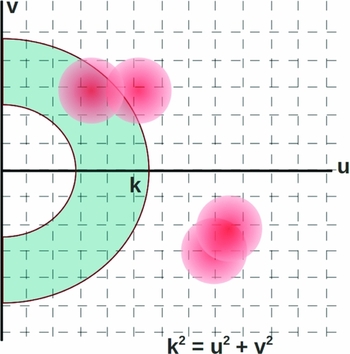
For an ideal instrument, a visibility measures a single sky mode, with a delta-function footprint in the Fourier plane. For a real instrument with a finite primary beam and bandpass, modes are mixed into an individual visibility measurement due to leakage. For a small FOV, the corresponding beam in Fourier space is broad, because the beam convolution distributes the power from adjacent modes. This beam footprint determines the coherence length of Fourier modes, as demonstrated schematically in Figure 1. Here, the beam footprint from individual visibility measurements determines the joint sky information available on a given angular scale.
Schematic representation of the uv-plane (Fourier plane), and the footprint of the primary beam (station beam) from individual visibility measurements (red circles). Also shown in the blue annular region is an example area over which the cosmological signal is not expected to evolve substantially, and the powers are averaged incoherently. The finite size of the beam in Fourier space mixes information from different sky modes into an individual visibility measurement.
The thermal noise is correlated only for visibilities (i.e., the measurement basis), while the sky power is correlated in the sky basis. The effective number of visibilities contributing to a given mode, $N_{{\rm eff}, i} = 1/[( {\bm B}^{\dagger }{\bm B})^{-1}]_{ii}$
, provides the coherence of the data with the sky. The same is not true for the cosmic variance, where the power is the same for identical sky modes, and uncorrelated otherwise (under the assumption of a Gaussian random field). The diagonal components of
$N_{{\rm eff}, i} = 1/[( {\bm B}^{\dagger }{\bm B})^{-1}]_{ii}$
, provides the coherence of the data with the sky. The same is not true for the cosmic variance, where the power is the same for identical sky modes, and uncorrelated otherwise (under the assumption of a Gaussian random field). The diagonal components of $({\bm B}^\dagger {\bm B})$
integrate visibilities that contribute coherently, while the off-diagonal components encode the correlations between sky modes introduced by the finite Fourier beam.
$({\bm B}^\dagger {\bm B})$
integrate visibilities that contribute coherently, while the off-diagonal components encode the correlations between sky modes introduced by the finite Fourier beam.
2.3 Incoherent combination of information: power covariance
To reduce cosmic variance, and further reduce the thermal noise, we incoherently combine information from modes within some annulus of constant $k = \sqrt{u^2+v^2}$
. The beam footprint,
$k = \sqrt{u^2+v^2}$
. The beam footprint, $({\bm B}^\dagger {\bm B})$
, encodes the correlation between modes within this annulus, as shown schematically in Figure 1 by the blue annular region. We form the power sample in mode
$({\bm B}^\dagger {\bm B})$
, encodes the correlation between modes within this annulus, as shown schematically in Figure 1 by the blue annular region. We form the power sample in mode $\overline{u_i}$
by squaring the sky signal and normalising by the instantaneous observation volume,
$\overline{u_i}$
by squaring the sky signal and normalising by the instantaneous observation volume,
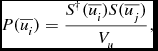 \begin{equation}
P(\overline{u_i}) = \frac{S^{\dagger }(\overline{u_i}) S(\overline{u_j})}{ V_u},
\end{equation}
\begin{equation}
P(\overline{u_i}) = \frac{S^{\dagger }(\overline{u_i}) S(\overline{u_j})}{ V_u},
\end{equation}
and then form the maximum likelihood (ML) incoherent power average over uv-modes contributing to an annulus at ( $\overline{k}$
,
$\overline{k}$
, $\overline{k}+\Delta {\overline{k}}$
). For independent modes, this reduces to (McQuinn et al. Reference McQuinn, Zahn, Zaldarriaga, Hernquist and Furlanetto2006):
$\overline{k}+\Delta {\overline{k}}$
). For independent modes, this reduces to (McQuinn et al. Reference McQuinn, Zahn, Zaldarriaga, Hernquist and Furlanetto2006):
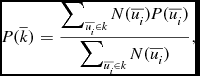 \begin{equation}
P(\overline{k}) = \frac{ \displaystyle \sum\nolimits _{\overline{u_i} \in k} N(\overline{u_i}) P(\overline{u_i})}{ \displaystyle \sum\nolimits _{\overline{u_i} \in k} N(\overline{u_i}) },
\end{equation}
\begin{equation}
P(\overline{k}) = \frac{ \displaystyle \sum\nolimits _{\overline{u_i} \in k} N(\overline{u_i}) P(\overline{u_i})}{ \displaystyle \sum\nolimits _{\overline{u_i} \in k} N(\overline{u_i}) },
\end{equation}
where $N(\overline{u_i})$
is the number of measurements contributing to mode
$N(\overline{u_i})$
is the number of measurements contributing to mode $\overline{u_i}$
.
$\overline{u_i}$
.
For a general covariance, we can derive the correct ML estimate. The covariance matrix of the power is found by considering the covariance matrix of the sky signal, ${\bm C}_s$
, and the propagation of errors for a quadratic formFootnote
2
:
${\bm C}_s$
, and the propagation of errors for a quadratic formFootnote
2
:
 \begin{eqnarray}
{\bm C}_p &=& \frac{{\bm C}_s^\dagger {\bm C}_s}{ V_u^2}
\end{eqnarray}
\begin{eqnarray}
{\bm C}_p &=& \frac{{\bm C}_s^\dagger {\bm C}_s}{ V_u^2}
\end{eqnarray}
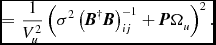 \begin{eqnarray}
&=& \frac{1}{V_u^2}\left(\sigma ^2 \left( {\bm B}^{\dagger }{\bm B} \right)^{-1}_{ij} + {\bm P}\Omega _u \right)^2.
\end{eqnarray}
\begin{eqnarray}
&=& \frac{1}{V_u^2}\left(\sigma ^2 \left( {\bm B}^{\dagger }{\bm B} \right)^{-1}_{ij} + {\bm P}\Omega _u \right)^2.
\end{eqnarray}
The ML solution for the power in mode k is found by considering the likelihood function for the power data. For simplicity we assume that the thermal noise dominates the sky power in each coherent mode (a reasonable assumption for the current generation of experiments, which are predicted to detect the EoR signal only after incoherent averaging), and approximate the ML estimate for the power in mode k as:
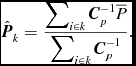 \begin{equation}
\hat{{\bm P}}_k = \frac{\displaystyle \sum\nolimits _{i\in k} {\bm C}_p^{-1} \overline{P}}{\displaystyle \sum\nolimits _{i\in k} {\bm C}_p^{-1} }.
\end{equation}
\begin{equation}
\hat{{\bm P}}_k = \frac{\displaystyle \sum\nolimits _{i\in k} {\bm C}_p^{-1} \overline{P}}{\displaystyle \sum\nolimits _{i\in k} {\bm C}_p^{-1} }.
\end{equation}
Finally, to obtain the uncertainty in the k-mode power estimate, $\hat{P}_k$
, we compute the variance of Equation 21:
$\hat{P}_k$
, we compute the variance of Equation 21:
 \begin{equation}
\Delta {P}_k^2 = \frac{1}{\displaystyle \sum\nolimits _{i\in k} {\bm C}_p^{-1}} = \frac{1}{V_u^2 \displaystyle \sum\nolimits _{i\in k} {\bm C}_s^{-1}{\bm C}_s^{-1}},
\end{equation}
\begin{equation}
\Delta {P}_k^2 = \frac{1}{\displaystyle \sum\nolimits _{i\in k} {\bm C}_p^{-1}} = \frac{1}{V_u^2 \displaystyle \sum\nolimits _{i\in k} {\bm C}_s^{-1}{\bm C}_s^{-1}},
\end{equation}
where the sum combines all of the elements of the inverted covariance matrix that contribute to that mode, ui ∈ k. To invert the power covariance matrix, we note that it is composed of a matrix inverse [(B†B)− 1] and diagonal signal matrix (P′). In order to avoid inverting the beam weights matrix, we use a Taylor expansion:
 \begin{equation}
(A + B)^{-1} \approx A^{-1} - A^{-1}BA^{-1} + A^{-1}BA^{-1}BA^{-1} - \cdots ,
\end{equation}
\begin{equation}
(A + B)^{-1} \approx A^{-1} - A^{-1}BA^{-1} + A^{-1}BA^{-1}BA^{-1} - \cdots ,
\end{equation}
giving;
 \begin{equation}
{\bm C}_p^{-1} \approx V_u^2 \left( \displaystyle \sum _{i=1}^{4} \frac{1}{\sigma ^{2i}} (-1)^{i+1} \Omega _u^{2(i-1)} {\bm P}_k^{i-1} \left( {\bm B}^{\dagger }{\bm B} \right)^i \right)^2,
\end{equation}
\begin{equation}
{\bm C}_p^{-1} \approx V_u^2 \left( \displaystyle \sum _{i=1}^{4} \frac{1}{\sigma ^{2i}} (-1)^{i+1} \Omega _u^{2(i-1)} {\bm P}_k^{i-1} \left( {\bm B}^{\dagger }{\bm B} \right)^i \right)^2,
\end{equation}
where we have approximated the coherent power in each mode P(ui ) ≈ Pk for i ∈ k. Note that this expression makes the computation of the final power variance straightforward, because it does not require inversion of a large matrix.
Together, equations 22 and 24 provide the quantity in which we are interested; the uncertainty in the measured power in mode k. These expressions describe the normal ML incoherent power (equation 15). For addition of independent modes, this expression reduces to the approximate form from McQuinn et al. (Reference McQuinn, Zahn, Zaldarriaga, Hernquist and Furlanetto2006) (their equation 24).
3 OBSERVING MODES
We are interested in understanding the uncertainty in computing the power at a given scale, for different observing schemes. We consider three observing schemes:
-
1. Tracked — beam pointing centre matches the phase centre, which have a constant sky position;
-
2. Zenith drift — pointing centre = zenith, phase centre = EoR field centre. (Note that this observing scheme may have the phase centre outside of the main lobe of the primary beam. For the MWA, this occurs in ~ 2 hours);
-
3. Drift + shift — fixed pointing centres, in steps across the sky, phase centre = EoR field centre (approximates a tracked scan).
The key differences here lie in the influence of the antenna primary beam pattern on the sampling of the sky, and the effect this has on the coherence of measured data.
The beam is the Fourier transform of the primary beam (PB) pattern on the sky, relative to the phase centre of the observation (for antennas with different beams, in Fourier-space it is the convolution of the antenna illumination pattern for each — for simplicity here, we will consider identical beams).
-
1. Tracked: a tracked observation is characterised by the same pointing and phase centres through the observation. The Fourier beam is simply the Fourier transform of the real-space PB, and is real-valued for a symmetric PB. In general, the Fourier beam can evolve through the observation, according to the PB pattern as a function of pointing centre, and this can be incorporated into the beam patterns used for those pointings. The tracked Fourier beam,
$B_{tr}(\overline{u})$
is given by;
(25)
\begin{eqnarray}
B_{tr}(\overline{u}) &=& \mathcal {FT}(B(\overline{l}))\\
\nonumber &=& \int B(\overline{l}) \exp{(-2\pi {i} \overline{u} \cdot \overline{l})}.
\end{eqnarray}
For this mode, the observation volume is given by:
(26)
\begin{equation}
\Omega _u \equiv V_u = \displaystyle \int d^3\overline{u} |B(\overline{u})|^2.
\end{equation}
-
2. Zenith drift: the zenith drift observation is characterised by a constant pointing centre (zenith) and stable PB, and constant sky phase centre, which changes with respect to the pointing. The PB pattern therefore rotates relative to the sky. A rotation in real-space is represented by a phase shift in Fourier space, leading to the zenith drift Fourier beam,
$B_z(\overline{u};\theta)$
,
(27)where
\begin{eqnarray}
B_{z}(\overline{u};\theta) &=& \mathcal {FT}(B(\overline{l}-\Delta {\theta }))\nonumber\\
&=& \int B(\overline{l}-\Delta {\theta }) \exp {(-2\pi {i} \overline{u} \cdot \overline{l})}\nonumber\\
&=& \exp {(-2\pi {i} \overline{u} \cdot \Delta {\theta })} B_{tr}(\overline{u})\nonumber\\
&\equiv & \overline{H}({\theta }) B_{tr}(\overline{u}),
\end{eqnarray}
$\Delta {\theta }=\Delta \overline{\theta }(t)$
is the time-dependent vector offset between pointing and phase centres, and we have defined
$\overline{H}(\theta)$
, a vector encoding the phase shifts at each angular scale. When considering the evolution of the angular offset with time, this becomes a matrix,
${\bm H}(\theta)$
. This produces a scale-dependent (u-dependent) phase rotation in the beam, whereby the largest angular scales on the sky are least affected. For a symmetric PB, this introduces imaginary components into the beam. Over the course of an observation, the telescope beam evolves, such that the integrated beam footprint is;
(28)
\begin{equation}
{\bm B}^\dagger {\bm B} = \int {\bm H}^\dagger (\theta) ({\bm B}^\dagger {\bm B})(\theta) {\bm H}(\theta) d\theta .
\end{equation}
The observation volume is then,
(29)where the approximation comes from considering the beam footprint to be independent of angular offset, θ. For the purposes of this calculation (to compute Ω u ), this approximation is appropriate.
\begin{eqnarray}
\Omega _u &=& \displaystyle \int d\overline{u}^\prime B_1(\overline{u}-\overline{u}^\prime) B_2^\ast (\overline{v}-\overline{u}^\prime) \nonumber\\
&=& \displaystyle \int d^3\overline{u} \left( \int d\theta {\bm H}^\dagger (\theta) ({\bm B}^\dagger {\bm B})(\theta) {\bm H}(\theta) \right)^2 \nonumber\\
&\simeq & \displaystyle \int d^3\overline{u} \left|B(\overline{u})\right|^2 {\rm sinc}(2\pi \overline{\theta }_{\rm max} \cdot \overline{u}) ^2,
\end{eqnarray}
-
3. Drift + </inline − formula > shift: thedrift < inline − graphicxmlns: xlink = "http: //www.w3.org/1999/xlink"xlink: href = "S132335801400023Xinline95"xlink: type = "simple"mime − subtype = "gif"/ > <![CDATA[$ + $]] > shift observation is an intermediate protocol between the tracked and pure-drift scans. It is characterised by a constant sky phase centre throughout the observation, but periods of drift at fixed pointing centres. For the MWA, the field drifts for 30 minutes ( ~ 8 degrees) before re-pointing.


4 SIMULATIONS
In accordance with the EoR experiment description in Bowman et al. (Reference Bowman, Cairns, Kaplan, Murphy and Oberoi2013), a 900-hour observation is simulated for the MWA (6 hours per night), with the phase centre set to a fixed sky position at a declination of δ = −30 degrees. We use a position- and frequency-dependent analytic approximation to the MWA primary beam, including the effects of the ground screen and phasing of 16 individual dipoles. The uv coverage of visibilities is computed for hypothetical one minute integrations and 200 kHz spectral channels over a total bandwidth of 8 MHz. A sky Fourier grid is created with a sampling of Δu = Δv = 0.5, to Nyquist sample a region of sky equivalent to 6 hours of drift. To reduce computational load, a maximum uv distance of $|\overline{u}|_{\rm max}=80$
(l
max = 500, k
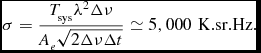
max = 0.077 hMpc− 1) is chosen. Baselines outside of this range are ignored, yielding a significantly reduced dataset. The drift + shift has 12 pointing centres over 6 hours, with 30 minutes at each pointing. The thermal noise per visibility, σ, is computed for a sky-dominated system temperature, Tsys = 440 K, spectral resolution of Δν = 200 kHz, and two polarizations, yielding:
$|\overline{u}|_{\rm max}=80$
(l
max = 500, k
max = 0.077 hMpc− 1) is chosen. Baselines outside of this range are ignored, yielding a significantly reduced dataset. The drift + shift has 12 pointing centres over 6 hours, with 30 minutes at each pointing. The thermal noise per visibility, σ, is computed for a sky-dominated system temperature, Tsys = 440 K, spectral resolution of Δν = 200 kHz, and two polarizations, yielding:
 \begin{equation}
\sigma = \frac{T_{\rm sys}\lambda ^2\Delta \nu }{A_e\sqrt{2\Delta \nu \Delta {t}}} \simeq 5,000 \,\,{\rm K.sr.Hz}.
\end{equation}
\begin{equation}
\sigma = \frac{T_{\rm sys}\lambda ^2\Delta \nu }{A_e\sqrt{2\Delta \nu \Delta {t}}} \simeq 5,000 \,\,{\rm K.sr.Hz}.
\end{equation}
This value is used for each visibility measured by the experiment, with an integrated ~ 1010 visibilities combined over the course of the experiment (10 second cadence, with 128 tiles and 900 hours total observing time).
Equation 12 has two terms to compute. For the thermal noise term, we compute the beam vector, $\overline{B}_V$
, for each single visibility, based on its uv location and the observing mode, and compute the outer product to increment the beam matrix. Viz:
$\overline{B}_V$
, for each single visibility, based on its uv location and the observing mode, and compute the outer product to increment the beam matrix. Viz:
 \begin{equation}
({\bm B}^\dagger {\bm B})_{i+1} = ({\bm B}^\dagger {\bm B})_{i} + (\overline{B}_V^\dagger {\overline{B}_V}).
\end{equation}
\begin{equation}
({\bm B}^\dagger {\bm B})_{i+1} = ({\bm B}^\dagger {\bm B})_{i} + (\overline{B}_V^\dagger {\overline{B}_V}).
\end{equation}
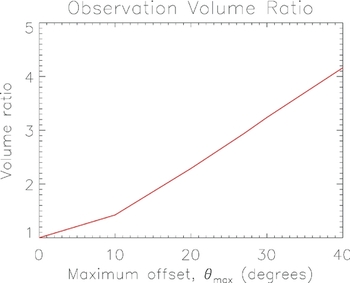
For the cosmic variance, the observation volume, Ω u , in equation 12 is computed by performing the integral over the integrated beam footprint. Figure 2 shows the observation volume, relative to a tracked scan, for the zenith drift and drift + shift modes, as a function of maximum angle between phase and pointing centres. For this experiment, we consider a maximum angle of 27 (4) degrees for drift (drift + shift), with a corresponding volume ratio of Ω u /Ω u (track) = 2.9 (1.3).
Observation volume, Ω u , for a zenith drift scan, relative to a tracked scan for the MWA, as a function of the maximum offset between the pointing centre and phase centre.
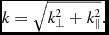
We compute the uncertainty in the 2D power, Pk (mK2.Mpc3 h − 3) by application of equations 22 and 24, for linearly-spaced angular k-bins with a width of Δk ⊥ = 1.5 × 10− 3 hMpc− 1. We then compute the 1D power spectrum from the same simulations by forming the power for each k;
 \begin{equation}
k = \sqrt{k_\bot ^2 + k_\parallel ^2}.
\end{equation}
\begin{equation}
k = \sqrt{k_\bot ^2 + k_\parallel ^2}.
\end{equation}
4.1 Foregrounds
We explicitly included the contribution from unsubtracted foregrounds in the signal covariance matrix, but have, as yet, not distinguished between cosmological signal and foregrounds in the noise analysis. Most current and future experiments aim to remove the strongest of these sources to high precision (others, such as PAPER, Parsons et al. (Reference Parsons2010), try to work in a region of parameter space where foreground contamination is minimal), but emission will remain due to unremoved sources (often below the confusion limit) and imprecise source subtraction (e.g., Trott, Wayth, & Tingay Reference Trott, Wayth and Tingay2012). The information available in the data limits the level and precision to which foregrounds can be removed. Although foregrounds are contaminants to the signal of interest, they have a different signature in the 2D power spectrum parameter space. Previous theoretical work has demonstrated the expected existence of a wedge feature, which is the signature of imprecisely- and un-subtracted smooth-spectrum point sources (Bowman, Morales, & Hewitt Reference Bowman, Morales and Hewitt2009; Datta, Bowman, & Carilli Reference Datta, Bowman and Carilli2010; Trott et al. Reference Trott, Wayth and Tingay2012; Vedantham, Udaya Shankar, & Subrahmanyan Reference Vedantham, Udaya Shankar and Subrahmanyan2012; Morales et al. Reference Morales, Hazelton, Sullivan and Beardsley2012; Thyagarajan et al. Reference Thyagarajan2013). For an achromatic instrument, spectrally-smooth foregrounds occupy the lowest k ∥ modes (flat-spectrum sources strictly occupy only the k ∥ = 0 mode). However, interferometers are inherently chromatic, with each physical baseline sampling signal at different wavenumbers for each spectral channel. This yields the wedge-like structure in the 2D power spectrum, where larger k ⊥ modes have greater leakage into higher k ∥ modes. For the small k ⊥ modes studied in this work, and the coarse spectral sampling, the wedge occupies only the k ∥ = 0 mode. To avoid the contribution of foregrounds, in the foregoing analysis, we omit signal in this mode.
5 RESULTS
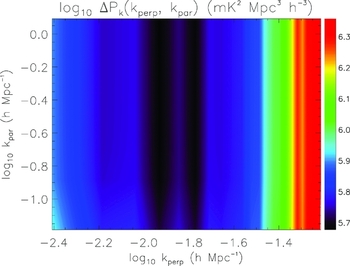
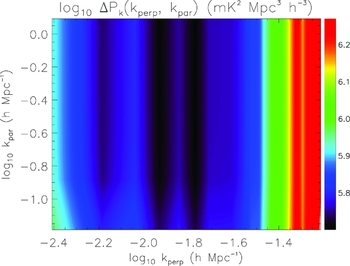
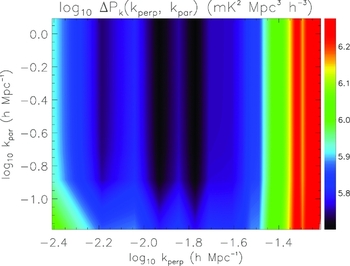
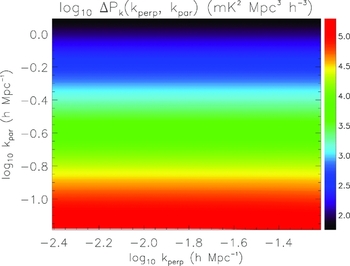
Figures 3–5 display the uncertainty in power for a zenith drift, drift + shift, and tracked mode, respectively, in the 2D power spectrum. For reference, Figure 6 displays the input 21 cm power spectrum used in the simulations (z = 8, neutral IGM, including line-of-sight anisotropy; Eisenstein & Hu Reference Eisenstein and Hu1999; Furlanetto, Oh, & Briggs Reference Furlanetto, Oh and Briggs2006). The overall distribution of noise traces the distribution of baseline lengths for the MWA, with fewer long baselines relative to short (log10 k ⊥ < −1.8). The results also reflect our expectations at these large angular scales, where thermal noise is high (few very short baselines). At low k ∥, the expected signal strength is highest, and cosmic variance contributes noticeable noise uncertainty for the drift + shift and tracked modes. This additional noise is reduced for the zenith drift scan, where the cosmic variance is decreased by the additional sky coverage. Figure 7 displays the log10 ratio of noise uncertainty for the zenith drift mode relative to the tracked mode. The effect of the reduced cosmic variance for the zenith drift scan mode is clearly evident at low k ∥, but the overall improvement in these modes is less than a factor of two in noise uncertainty. At large k ⊥, the drift + shift and tracked modes perform better because the experiment is thermal noise-dominated and there is less coherence for the zenith drift scan mode.
Uncertainty in power for a zenith drift observation (mK2 Mpc3 h − 3).
Uncertainty in power for a drift + shift observation (mK2 Mpc3 h − 3).
Uncertainty in power for a tracked observation (mK2 Mpc3 h − 3).
Reference input 21 cm emission signal, assuming a neutral IGM at z=8 (Eisenstein & Hu Reference Eisenstein and Hu1999; Furlanetto et al. Reference Furlanetto, Oh and Briggs2006).
Ratio of noise uncertainty in each mode, log10 ΔP drift/ΔP dns.
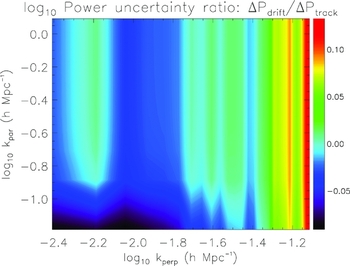
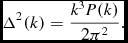
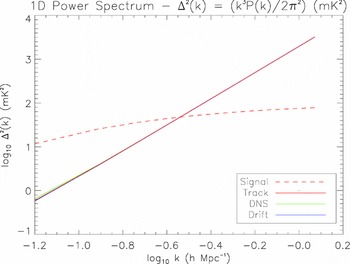
Figure 8 shows the uncertainty in the 1D dimensionless power spectrum, where,
 \begin{equation}
\Delta ^2(k) = \frac{k^3P(k)}{2\pi ^2}.
\end{equation}
\begin{equation}
\Delta ^2(k) = \frac{k^3P(k)}{2\pi ^2}.
\end{equation}
The expected 21 cm signal is shown for comparison. The S/N exceeds unity at large scales. The three observing modes show visually similar results, except at large scales where the zenith drift scan exhibits marginally improved performance. This is expected given the results of the 2D power spectrum; because only small k ⊥ modes are considered here, k is dominated by k ∥ for larger modes. This is where there is reduced cosmic variance, and the two observing modes show comparable results (compare with Figures 3–5).
Expected dimensionless power spectrum (signal), and uncertainty for the track, drift + shift and drift observing modes.
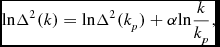
The dimensionless power spectrum can be compared with the expectations for MWA sensitivity to EoR statistical estimation computed in Beardsley et al. (Reference Beardsley, Hazelton, Morales and Arcus2013). They compute the S/N on the amplitude [Δ2(kp )] and slope (α) of the dimensionless power spectrum for a single field and 450 hours of observing where (Lidz et al. Reference Lidz, Zahn, McQuinn, Zaldarriaga and Hernquist2008),
 \begin{equation}
{\rm ln}\Delta ^2(k) = {\rm ln}\Delta ^2(k_p) + \alpha {\rm ln}\frac{k}{k_p},
\end{equation}
\begin{equation}
{\rm ln}\Delta ^2(k) = {\rm ln}\Delta ^2(k_p) + \alpha {\rm ln}\frac{k}{k_p},
\end{equation}
and kp = 0.06 hMpc− 1 is the pivot wavenumber. We compute the Cramer-Rao Bound (CRB, Kay Reference Kay1998) on the minimum uncertainty on estimation of these parameters for an efficient, unbiased estimator, and these data. The S/N on the parameters for 900 hours of observing are shown in Table 1. These can be compared with the quantities from Beardsley et al. (Reference Beardsley, Hazelton, Morales and Arcus2013) for one field and the same observing time, S/NΔ2 p = 10.5, S/Nα = 8.2. Thus, we predict slightly reduced precision on the value of the slope and the amplitude. There are differences in the methodology, input 21 cm signal, and binning of spectra used in the two analyses, but the primary difference lies in the correct accounting for the coherence of measurements in this work. Importantly, both this work and Beardsley et al. (Reference Beardsley, Hazelton, Morales and Arcus2013) predict detectability of the signal with 900 hours of observing.
Signal-to-noise ratios on estimation of the amplitude and slope of the spherically-averaged power spectrum, for the three observing strategies.
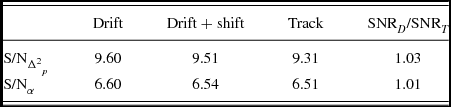
More interesting is the direct comparison of the three observing modes in this work, because these are computed using exactly the same experimental design, input signal and power spectrum binning. We predict improvement in detectability of 1% (3%) for the slope (amplitude) using the zenith drift mode over the tracked mode, for a drift scan encompassing ± 27 degrees of zenith. This translates into direct reduction of required observing time for the same level of detectability. I.e., a zenith drift scan with 875 hours of observing can achieve similar precision on the slope, and better on the amplitude, to a tracked scan of 900 hours duration.
6 DISCUSSION AND CONCLUSIONS
Observing strategy is a key consideration for current and future EoR estimation experiments with aperture arrays. The complexity of the antennas motivates us to consider system stability and instrument calibratability when designing our science experiments. In this work we considered three qualitatively different approaches to measuring the EoR signal with the redshifted 21 cm emission line, and compared them on the basis of noise uncertainty in the 2D power spectrum. Having developed a general framework, we applied it to the EoR experiment underway with the MWA telescope. The analysis suggests that, for this experiment, there is up to a factor of two difference in power uncertainty across the 2D parameter space of spatial modes. Interestingly, the zenith drift scan shows improved performance in the regions of interest for the EoR signal, due to its effective reduction of cosmic variance and higher sensitivity. For the dimensionless 1D power spectrum, we predict marginal gains for using the zenith drift scan, which can be directly translated into a marginal reduction in observing time required to reach the same level of parameter estimation precision. More critically, the comparable performance of the zenith drift scan makes it an attractive option for instruments where calibration stability is a primary concern.
Although the gains in estimation SNR derived here are modest, they refer specifically to the case in question: the 900-hour EoR experiment being undertaken with the MWA. An increase in time-on-sky for the same experiment would favour the drift mode, because it would further reduce thermal noise and increase the relative importance of the cosmic variance. Conversely, less time-on-sky would still lead to a significant estimate of the 1D parameters of slope and amplitude, but thermal noise would be more important and the tracked scan may be favoured. Indeed, the choice of 900 hours is partly due to that corresponding to an approximate balance of these noise terms.
It is worth noting that there may be other differences between these observing modes than simply the coherence of measurements. For example, the feature that makes the drift scan attractive (its large observing volume) may also be a detriment, where it is more difficult to find regions of the sky without strong signal contamination (e.g., the Galactic centre) in a sidelobe of the primary beam. The impact of the precise choice of experimental location depends greatly on the location, and this cannot be assessed in a general way, and has not been explored here. Ultimately, any EoR experiment requires a careful tuning of the experimental conditions to yield the maximum scientific gain. In this work, we have demonstrated that the zenith drift scan is marginally advantageous for signal estimation from the noise perspective alone.
For future experiments with higher sensitivity (e.g., LEDA, SKA-Low; Greenhill & Bernardi Reference Greenhill, Bernardi, Komonjinda, Kovalev and Ruffolo2012; Schilizzi, Dewdney, & Lazio Reference Schilizzi, Dewdney and Lazio2010), coherent reduction of thermal noise will be less important, and the drift scan mode may show additional benefits for reducing cosmic variance. Coupled with the benefits of improved system stability and calibratability of this mode, zenith drift scans may become the mode of choice for statistical estimation of the EoR signal.
ACKNOWLEDGEMENTS
We particularly thank Adam Beardsley for assistance with his sensitivity calculations. The Centre for All-sky Astrophysics is an Australian Research Council Centre of Excellence, funded by grant CE110001020. The International Centre for Radio Astronomy Research (ICRAR) is a Joint Venture between Curtin University and the University of Western Australia, funded by the State Government of Western Australia and the Joint Venture partners. CMT would like to thank the anonymous referee, Ron Ekers, Randall Wayth, Jonnie Pober, Nithya Thyagarajan, and the MWA EoR collaboration, for fruitful discussions and substantial improvement of the manuscript.



