





Introduction
Are voters susceptible to elite arguments when making choices in referendums? Or are voters competent to make choices based on their underlying attitudes towards an issue? In contrast to elections, referendums are political settings in which the propositions voters face are often complex and novel topics (LeDuc Reference LeDuc2002; Hobolt Reference Hobolt2006, Reference Hobolt2009). When the attitudes of voters towards an issue overlap with those of political elites, elite cues can provide voters with heuristic shortcuts that enable them to choose the option that best matches their underlying attitudes (Bowler and Donovan Reference Bowler and Donovan1998; Hobolt Reference Hobolt2009). More common in a referendum is the situation where a proposition involves issues that do not map neatly onto pre-existing political cleavages. Here voters lack the partisan signposts that they can rely on in elections to make choices, making them in theory more susceptible to how arguments are framed instead of making choices based on underlying attitudes (de Vreese Reference de Vreese and de Vreese2007; Marsh Reference Marsh and de Vreese2007; Schuck and de Vreese Reference Schuck and de Vreese2008; Neijens and de Vreese Reference Neijens and de Vreese2009; Boudreau and MacKenzie Reference Boudreau and MacKenzie2014; Bechtel et al. Reference Bechtel, Hainmueller, Hangartner and Helbling2015). Framing effects are when an individual exposed to different considerations on an issue takes a different position than they otherwise would have based on their underlying issue attitudes (Chong and Druckman Reference Chong and Druckman2007; Scheufele and Iyengar Reference Scheufele, Iyengar, Kensi and Jamieson2012; Leeper and Slothuus Reference Leeper and Slothuus2014, Reference Leeper and Slothuus2015; Liu and Scheufele Reference Liu and Scheufele2016).
Voter susceptibility to framing effects can in theory be reduced during the course of a referendum campaign through both voter exposure to information about the proposition and to different arguments that are intended to persuade them to vote in particular ways (LeDuc Reference LeDuc2002; Hobolt Reference Hobolt2009; Bechtel et al. Reference Bechtel, Hainmueller, Hangartner and Helbling2015; Goodwin et al. Reference Goodwin, Hix and Pickup2020; Beach and Finke Reference Beach and Finke2021).Footnote 1 During campaigns, voters receive information that enables them to learn enough about the proposition to map it onto their underlying attitudes. Towards the end of the campaign, many voters will have made up their minds, making them less susceptible to frames (Taber and Lodge Reference Taber and Lodge2006; Hill Reference Hill2017). Additionally, repeated exposure to arguments can in effect ‘inoculate’ voters to their effects if the voter has time to reflect on how the argument maps onto their underlying attitudes (Druckman et al. Reference Druckman, Peterson and Slothuus2013; Goodwin et al. Reference Goodwin, Hix and Pickup2020). Arguments that do not map onto their underlying attitudes will be rejected or accepted if they correspond to attitudes.
However, despite the large literature on framing effects and voting behaviour in referendums, there have been few studies that directly test the impact that exposure to information and arguments can have on voter susceptibility. There are even fewer studies that utilise real-world campaigns as a context. Most studies of framing have deployed survey experiments outside of the context of an actual referendum (see online Appendix 2 for a review of relevant studies). Using a real-world campaign to test framing effects enables us to assess susceptibility in a context that actually matters for voters. Yet the few studies that have been conducted while a campaign was taking place have typically been one-off studies either at the start or the end of a campaign (eg Bechtel et al. Reference Bechtel, Hainmueller, Hangartner and Helbling2015; Masullo and Morisi Reference Masullo and Morisi2019; Goodwin et al. Reference Goodwin, Hix and Pickup2020). While the one-off studies are able to assess the impact of differing levels of information or knowledge at the individual level, they are – by design – unable to test more directly whether the arguments and information provided by a campaign reduce voter susceptibility to framing effects. To do so requires comparing the magnitude of framing effects at the start and the end of a campaign.Footnote 2
This article utilises a unique experimental design that deploys the same framing survey experiment among independent but similar samples of voters at two different stages of a real-world campaign. This enables us to assess the impact of political campaigns on susceptibility to framing effects directly. The first experiment was conducted close to the start of the campaign, while the second experiment was deployed during the final weeks of the campaign. We thereby combine the experimental control of exposure to frames with natural variation in the information environment during the campaign to directly assess the impact of political campaigns on voters’ susceptibility to framing effects.
We utilised a campaign in connection with an EU referendum as a particularly relevant context for assessing voter susceptibility. EU referendums on membership (entry or exit), or in our case, the deepening of integration (eg adoption of new EU treaties, removing opt-outs), are issues where most voters feel that much is at stake. This gives voters motives to gather enough information and process arguments during the campaign to enable them to engage in what is termed ‘issue-voting’, where voters make choices on the proposition based on their underlying EU attitudes (Svensson Reference Svensson2002; Hobolt Reference Hobolt2009; Garry Reference Garry2013; Goodwin et al. Reference Goodwin, Hix and Pickup2020; Beach and Finke Reference Beach and Finke2021). At the same time, while voters in many EU member states have stable and relatively strongly held underlying attitudes towards the EU,Footnote 3 the propositions sent to approval by referendum are typically both highly complex and novel topics.Footnote 4 Additionally, voters cannot necessarily rely on shortcuts such as partisan cues in many EU member states because many voters have different attitudes towards the EU than their elected representatives (Hobolt and de Vries Reference Hobolt and de Vries2016; Hobolt and Rodon Reference Hobolt and Rodon2020).
The EU referendum we chose was the 2022 EU defence opt-out referendum in Denmark. Shortly after the Russian invasion of Ukraine in February 2022, a majority of Danish parties decided to send the Danish defence opt-out to a referendum. The Danish context is one where voters have relatively stable underlying attitudes towards more or less EU cooperation, meaning that they possess predispositions towards the issue that can guide them when deciding how to vote on the proposition. At the start of the campaign, while a majority of Danish voters believed that the proposition was important for Denmark,Footnote 5 the average voter had little information and prior exposure to arguments for/against removing the opt-out. Given this, we would expect that voters are susceptible to how elite arguments are framed at the start of the campaign. However, by the end of the campaign the average voter could in theory have received enough information and arguments to make them less susceptible to framing effects. In order to test the robustness of our findings, we assessed whether there might be heterogeneous effects based on type of argument frame (losses versus gains) and by the education level of voters.
Our main finding is that the referendum campaign did indeed reduce voter susceptibility to framing effects. In the first experiment deployed in the early campaign stage, we find that voters exposed to loss frames related to the negative consequences of either voting yes or no were more likely to state they would vote no (or yes) than the control group. Interestingly, arguments emphasising positive consequences (gains) had little impact, irrespective of whether they were for the yes or no side. When we repeated the same experiment in the late campaign stage among an independent yet similar sample, we found that voters were not susceptible to framing effects, irrespective of whether the arguments focused on positive or negative consequences. This suggests that the change in the information environment and exposure to arguments during the campaign reduced voter susceptibility to framing effects. Strengthening this conclusion is the finding of countereffects towards one of the frames amongst more educated voters at the end of the campaign. The no-loss frame that we deployed had been widely discredited in the media during the campaign. When we exposed more educated voters to this discredited no-frame at the end of the campaign, exposure made them more likely to say they would vote yes in relation to the control group. Our interpretation of this is that they reacted by in effect saying ‘if that bad [discredited] argument is the best the no-side can muster, I should vote yes’.
The article proceeds in the following steps. In section 2, we review the existing literature on framing effects. Based on this, we develop hypotheses about the impact that exposure to information and arguments during a referendum campaign can have in relation to framing effects. Section 3 describes the two wave survey experimental design that we deploy, along with the formulation of the four different frames. Section 4 describes the context of the 2022 Danish defence opt-out referendum and provides additional evidence that demonstrates that the campaign provided enough information and exposure to arguments that it could in theory have enabled voters to take positions that reflect their underlying attitudes instead of being susceptible to framing effects. Section 5 presents the findings of the survey experiments. Section 6 discusses potential alternative explanations and the broader implications of the findings.
Theory
In this article, we assess the impact of a real-world referendum campaign on voter susceptibility to framing effects. A framing effect occurs when a voter who is exposed to an argument or information shifts how they say they would vote on a proposition, other things equal (Druckman and Leeper Reference Druckman and Leeper2012: 876; Goodwin et al. Reference Goodwin, Hix and Pickup2020:484). Frames can work through either making new information available to individuals or by changing the accessibility of information, changing the considerations that voters use when reasoning about how the proposition maps onto their underlying issue attitudes (Leeper and Slothuus Reference Leeper and Slothuus2015). In contrast, issue-voting occurs when voters take positions based on their underlying attitudes to an issue to make an informed choice about a proposition in a referendum (Svensson Reference Svensson2002; Hobolt Reference Hobolt2009). Note that we distinguish here between a framing effect that brings different considerations to mind for voters when reasoning about an issue, and deeper persuasion effects in which the underlying attitudes of individuals towards an issue itself are changed (Nelson and Oxley Reference Nelson and Oxley1999: 1040–1041).Footnote 6 The proposition facing Danish voters in the EU referendum on security affairs was one in which they initially had very little information or prior exposure to arguments, making them in theory susceptible to framing effects. In contrast, by the end of the campaign, given the stakes involved and the amount of information and debate during the campaign, we would expect that voters would be better able to engage in issue-voting.
In the general literature on framing effects, there are mixed findings as regards the impact of frames on voters. Some scholars have found relatively strong effects, implying that political elites can shape views towards a proposition to serve their own interests (Lupia and McCubbins Reference Lupia and McCubbins1998; Druckman and Nelson Reference Druckman and Nelson2003; Chong and Druckman Reference Chong and Druckman2007; Arceneaux and Nickerson Reference Arceneaux and Nickerson2010; Lecheler and de Vreese Reference Lecheler and de Vreese2011; Druckman and Leeper Reference Druckman and Leeper2012; Masullo and Morisi Reference Masullo and Morisi2019; Goodwin et al. Reference Goodwin, Hix and Pickup2020). Other scholars have found framing effects that are weaker, especially when voters are facing real-world political choices on issues that matter to them (Lecheler, de Vreese and Slothuus Reference Lecheler, de Vreese and Slothuus2009; Chong and Druckman Reference Chong and Druckman2010; Bechtel et al. Reference Bechtel, Hainmueller, Hangartner and Helbling2015; Tesler Reference Tesler2015; Ciuk and Yost Reference Ciuk and Yost2015; Hopkins Reference Hopkins2018; Goodwin et al. Reference Goodwin, Hix and Pickup2020; Amsalem and Zoizner Reference Amsalem and Zoizner2022).
Referendum campaigns can in theory reduce voter susceptibility to framing effects by exposing voters to information and arguments (Masullo and Morisi Reference Masullo and Morisi2019; Goodwin et al. Reference Goodwin, Hix and Pickup2020; Beach et al. Reference Beach, Hansen and Larsen2018; Dvořák Reference Dvořák2013). In the literature, there is disagreement about what it is about campaigns that reduce susceptibility.Footnote 7 Some scholars emphasise the impact of increased information by itself, which decreases voter uncertainty about the proposition and strengthens the ability of voters to counter arguments that contradict their underlying attitudes (Taber and Lodge Reference Taber and Lodge2006: 757; Hill Reference Hill2017). Other scholars suggest that prior exposure to arguments reduces their efficacy (Druckman and Leeper Reference Druckman and Leeper2012; Slothuus Reference Slothuus2016), in particular when voters face competing arguments that can cancel each other out (Druckman and Nelson Reference Druckman and Nelson2003; Sniderman and Theriault Reference Sniderman, Theriault, Saris and Sniderman2004; Chong and Druckman Reference Chong and Druckman2010; Druckman et al. Reference Druckman, Peterson and Slothuus2013; Kalla and Broockman Reference Kalla and Broockman2018; Goodwin et al. Reference Goodwin, Hix and Pickup2020). Goodwin et al. (Reference Goodwin, Hix and Pickup2020) found in an EU referendum in the United Kingdom that voters had been exposed to negative arguments about the EU for years, whereas positive arguments about the benefits of the EU had not been widely made until the referendum started. They found framing effects when voters were exposed to the novel positive arguments and limited effects of negative arguments (Goodwin et al. Reference Goodwin, Hix and Pickup2020). However, given that they deployed a one-off study before the start of the campaign itself,Footnote 8 they were unable to assess the impact of information and arguments provided by the campaign itself.
Taken as a whole, the literature suggests that we can expect voters are less susceptible to frames at the end of the campaign. This leads to the first hypothesis:
H1 – framing effects at the beginning of the campaign can be expected to be stronger than at the end of the campaign.
In order to explore whether there are heterogeneous effects of frames in our experimental design, we develop two additional hypotheses related to whether voters are only susceptible to particular types of frames, and whether there are individual-level differences related to levels of political knowledge that might affect voter susceptibility to frames.
Hypothesis 2 relates to whether the type of frame can make a difference. Frames that emphasise gains or losses present different information to voters, thereby potentially altering the weight they attach to different aspects of an issue (Nelson, Oxley, and Clawson Reference Nelson, Oxley and Clawson1997; Chong and Druckman Reference Chong and Druckman2007; Scheufele and Iyengar Reference Scheufele, Iyengar, Kensi and Jamieson2012; Leeper and Slothuus Reference Leeper and Slothuus2015; Liu and Scheufele Reference Liu and Scheufele2016).Footnote 9 In relation to a referendum, a gain frame would emphasise the positive benefits of either voting yes or no, whereas a loss frame would highlight the negative effects of either yes or no. There is a large literature that contends that loss frames can potentially have a larger impact, as most people place more weight on information about negative outcomes than positive ones (Druckman Reference Druckman2004; De Vreese et al. Reference de Vreese, Boomgaarden and Semetko2011; Soroka Reference Soroka2014). Given this, we expect that arguments that emphasise losses will have stronger effects than gain frames. For both the pro/Yes and anti/No arguments, we develop gain- and loss-related arguments to assess whether there are differences in effect size depending on the nature and direction of the argument.
This leads to our second hypothesis:
H2 – loss frames can be expected to have stronger effects than gain frames, irrespective of whether the argument is for or against the proposition.
Hypothesis 3 assesses whether the level of political knowledge of individual voters affects their susceptibility to framing effects. There is a large literature that has found that less knowledgeable voters can be more susceptible to frames for a variety of reasons. One reason is that there is greater likelihood that a frame exposes a less knowledgeable voter to new information, thereby changing how they perceive a proposition (Zaller Reference Zaller1992; Lupia Reference Lupia1994). Another reason can be that less knowledgeable voters lack the informational resources to evaluate when an argument runs counter to their underlying attitudes (Chong and Druckman Reference Chong and Druckman2007; Bechtel et al. Reference Bechtel, Hainmueller, Hangartner and Helbling2015: 687; Goodwin et al. Reference Goodwin, Hix and Pickup2020).
Taken together, this leads to our third hypothesis:
H3 – framing effects can be expected to be stronger for less knowledgeable voters, other things equal.
Data and design
The three hypotheses are tested using a novel survey experimental design deployed in a real-world political campaign setting. While most experiments on framing effects have a ‘captive’ audience that is exposed to a fixed information set (Chong Reference Chong2019: 13), the real-world setting enables us to assess how the exposure to information and arguments in a campaign potentially affects susceptibility to framing effects. Given that we do not utilise a panel design to assess our two hypotheses, our study is not vulnerable to panel mortality or panel conditioning effects.
In our design, we deployed two identical survey experimental vignette treatments to a sample of voters early in the campaign (five to six weeks prior to the vote),Footnote 10 and a separate but similar sample of voters in the last week before the vote.Footnote 11 The reason for this design choice – in contrast to panel data that would allow to examine within-subject opinion changes – is that we are not in itself interested in whether individual respondents’ opinions changes over time but rather the extent to which the framing effects changes over time during the campaign. This can more credibly be examined with two similar but independent samples, whereas a panel design including re-exposure to treatment would potentially confound general campaign effects with pre-treatment effects.
Sample
Our survey respondents are drawn from the online panel of Epinion, a Danish polling firm, using stratified sampling. The samples are representative for the Danish population regarding age, gender, education, and geography (ie region). Comparisons with the Danish Election Study 2022, based on a high-quality probability sample, confirm that our sample closely aligns with the broader population in terms of age, gender, and geography (see Table SI 5).
The first survey experiment consists of 3295 respondents and the second survey experiment has 3254 respondents. The panels in Figure SI 6 (online Appendix) demonstrate a high degree of similarity between the respondents in the two samples with respect to age, gender, education, and geography. To formally assess the similarity between the two experimental samples, we conducted t-tests and chi-square tests on key background variables (see Table SI 4). The results show a high degree of similarity between the samples in terms of age, interest, trust, EU position, education, and geography. Specifically, the mean values for age, interest, trust, and EU position are nearly identical across both samples, and the distributions of education, region, and party preference are consistent. However, the analysis of gender reveals a slight difference in distribution between the two samples, with the proportion of men being 0.49 in the first experiment and 0.47 in the second.
Randomisation and Experimental Conditions
We used simple randomisation that assigns all subjects to one of four treatment groups and one control group with an equal probability. We did not specify exactly how many individuals are assigned to each condition. The number of observations for individual groups ranges from 615 to 677 in the first survey experiment and 590 to 691 in the second survey experiment. Balance tests on the variables age, gender, education, and region show that respondents are very similar across the five conditions (see Figure SI 4–5). Only one treatment group in the first survey experiment shows a statistically significant difference regarding age when compared to the control group (see Table SI 2–3). While we do not include any control variables in our main analysis, we also estimate treatment effects using a specification that includes covariates and show the results in the Appendix. The inclusion of control variables accounts for random differences across groups and might increase the precision of our estimates because variables that strongly predict the outcome help explain more of the variation, leaving less unexplained variability. As the study was embedded in a novel, real-world context, we attempted to ensure that all respondents were aware of the context of the referendum. Therefore, after answering questions on their socio-economic background and general view about the EU, all respondents read the following text: Russia’s invasion of Ukraine has changed the global situation. In light of the new security policy situation that Europe is currently facing, Danish citizens must now decide whether to maintain or abolish the Danish defence opt-out.
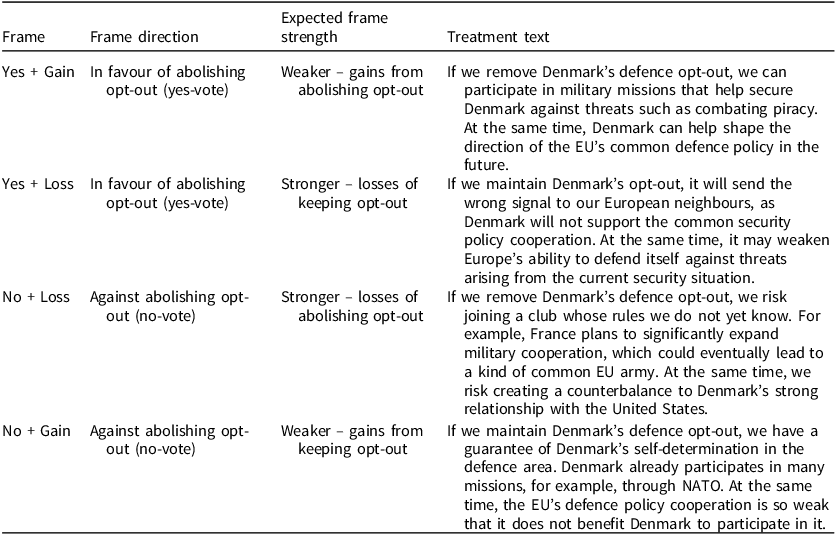
Respondents in the control group did not receive any additional information and proceeded directly to the outcome question. Respondents assigned to one of the four treatment groups were asked to carefully read a short text in connection with the upcoming referendum. The treatment frames are shown in Table 1 (translated from Danish). Given that the primary dimension of voter attitudes towards the EU are on a pro/anti-axis (Hobolt and de Vries Reference Hobolt and de Vries2016; Beach and Finke Reference Beach and Finke2021), and given that we had no reason to expect a particular direction of argument to be more impactful, we tested both pro (yes) and anti (no) arguments at the start and the end to assess whether similar dynamics are at play in different types of arguments. In contrast to the UK Brexit referendum, neither pro- nor anti-argumentive frames were widely available in the issue of the Danish defence opt-out, as the issue had not been widely debated prior to the referendum campaign as the referendum was announced quite suddenly in the wake of Russia’s invasion of Ukraine.Footnote 12
Treatment frames

As H2 explores whether there are different effects depending on the type of frame (gain/loss), we developed four argument frames in total: two arguments in favour of the referendum proposal and two arguments opposed. When developing the two anti-arguments, given that voters in referendums are asked to choose between enacting the proposal or the reversion point if the proposal is rejected (Hobolt Reference Hobolt2006, Reference Hobolt2009), we developed an argument that discussed the negative implications of enacting the proposal (No-loss) and another one about the positive implications of the reversion point (No-gain). The original treatment frames in Danish are shown in Table SI 1 in Appendix 1.To ensure a high degree of experimental realism, we were inspired by the arguments made by both the Yes and No sides in the nascent stage of the campaign from late March to early April 2022, and we drew on the research teams’ expert knowledge of what types of arguments were typically made in past EU referendums in Denmark.Footnote 13
In the next section, we show that political actors actually used the arguments presented in the treatment vignettes in media debates.
Operationalisation and Analytical Strategy
The main outcome is a binary response variable indicating whether the respondent intends to vote ‘yes’ (measure takes the value of 1) or ‘no’ (measure takes the value of 0) in the referendum, using the actual question that was asked of voters in the referendum. The question reads: ‘Do you vote yes or no to Denmark’s participation in the European cooperation on security and defence by abolishing the EU defence opt-out?’ In addition to stating ‘yes’ and ‘no’, respondents could also indicate that they ‘will not vote’ or ‘don’t know’. In our main analysis, we coded these two responses as ‘no’, as both reflect an absence of support for the proposal at the time of the survey. This coding approach allows us to retain more respondents in the analysis and reflects a conservative estimate of support. To assess the robustness of this choice, we also report analyses in the Appendix in which we exclude these two categories entirely. We found no substantive difference in the findings. To analyse our data, we regress our binary outcome variable on the randomly assigned treatment variable, with the control condition as the reference category. In the first experiment, the mean of the binary outcome vote ‘yes’ is 0.45 (SD = 0.50), while in the second experiment, the mean is 0.48 (SD = 0.50). To test our third hypothesis, we had to operationalise respondents’ level of political knowledge. Following Goodwin et al. (Reference Goodwin, Hix and Pickup2020: 485–486), we use education as a proxy for political knowledge. Ideally, we would have relied on three political knowledge questions that we included based on our expectations of the campaign’s factual focus. However, two of these questions proved to be overly technical and obscure, with correct answers largely limited to experts in EU defence policy. We expect that most correct responses to these items resulted from random guessing rather than actual knowledge. We believe this is reasonable as the theory behind the hypothesis is that more knowledgeable voters are more competent to use information when reasoning about how their underlying attitudes map onto the proposition under consideration. As an additional check, we also examined whether level of political interest moderates susceptibility to framing effects, finding similar patterns.
Manipulation Check
After the measurement of the main outcome variable, we conducted a manipulation check that asked respondents whether the stated argument was for or against abolishing the EU defence opt-out.Footnote 14 This approach represents a factual manipulation check, that is, an objective question about the key element of the experimental treatment. By placing the question immediately after the outcome measure, we follow the best practice in the literature (Kane and Barabas Reference Kane and Barabas2019). In our main analysis, we rely on data from all respondents. In the Appendix, we report additional analyses in which we dropped respondents who failed the factual manipulation check. This exclusion criterion applies to one-quarter of the participants in both experiments.Footnote 15 The findings without the excluded respondents are similar to those with them included.
The two-wave design at the start and the end of the campaign enables us to assess the impact of information and arguments on voters (H1). At the same time, deploying the treatments in real-world conditions means that there are some potential confounders that we cannot control for. One potential confounder is that voters might have been more informed of the negative consequences of Russia’s invasion of Ukraine for Danish security by the end of the campaign (late May) based on media reports that were not related to the referendum campaign. This can have made voters at the end of the campaign more certain that they would vote yes and therefore less likely to be influenced by argument frames in the treatments. However, there was a large amount of coverage in Danish media in the immediate aftermath of the invasion in February, meaning that these increased threat perceptions more likely formed part of what can be termed the pre-treatment context (Druckman and Leeper Reference Druckman and Leeper2012). Using a simple media analysis with the search word ‘Russia’, there was almost three times as many stories in the period from 22 February (invasion) to the start of the first round of the experiment (22 April) than there were from 23 April until the end of the second round of the experiment (31 May).Footnote 16 Additionally, once media coverage of the referendum campaign itself started, many of the stories related to the Russian invasion of Ukraine formed part of the background for debates.
The 2022 Danish defence opt-out referendum campaign
In the 2022 referendum, Danish voters were asked whether to abolish the country’s opt-out from EU defence policies (Pedersen et al. Reference Pedersen, Beach, Senninger and Fenger2023). Similar attempts to remove other opt-outs – on the euro in 2000 and on justice and home affairs in 2015 – had failed despite broad elite support (Beach Reference Beach, Christiansen, Elklit and Nedergaard2020). As such, approval in 2022 was far from guaranteed. While Danish voters hold relatively stable attitudes towards the EU (Beach and Finke Reference Beach and Finke2021), the 2022 vote posed a complex choice, shaped by the post-invasion geopolitical context and technical considerations such as participation in EU military missions and the European Defence Agency. In the wake of the Russian invasion of Ukraine, a new defence agreement was adopted between the Social Democrats, the Liberals, the Conservative People’s Party, the Socialist People’s Party, and the Social Liberal Party on 6 March 2022. The agreement both included a decision to increase defence spending, reduce dependency on Russian oil and gas, but also an ambition to abolish the Danish defence opt-out in a referendum to be convened on 1 June 2022. While not signing the agreement, several opposition parties also endorsed it (Liberal Alliance, the Christian Democrats, and the Independent Greens). The Danish People’s Party, the New Right, and the Red-Green Alliance opposed the abolition of the opt-out and recommended a no-vote.
Political actors advocating a yes vote argued that Denmark needed to stand together with the rest of Europe. Several politicians emphasised that if Denmark keeps its opt-out, it will send the wrong signal to European neighbours in light of an increasingly aggressive and assertive Russia. The main argument put forward by political actors advocating a no vote was that the abolishment of the opt-out could lead to a slippery slope of stronger defence cooperation that might become supranational in the future that could result in Denmark losing the ability to control the deployment of Danish troops. One particular concern was whether Denmark might be forced to take part in a common EU military in the future (an EU army). However, this concern was contested by experts during the campaign (Danmarks Radio 2022), and by the end of the campaign the argument had been widely discredited.
In the following, we present a brief analysis showing that the referendum issue was salient for voters in the weeks prior to the referendum and that voters were exposed to a range of different campaign arguments and information.
Figure 1 shows the coverage of Denmark’s defence opt-out (using the word ‘forsvarforbehold’ [defence opt-out] as the search term) across country-wide Danish newspapers and TV programmes, as tracked by the Infomedia database throughout 2022. There is a clear surge in media interest starting in March with the announcement of the referendum (6 March). There is then a large dip, after which another surge in late May and the beginning of June, around the date of the vote itself (1 June). Before the announcement and after the referendum, the data show very little reporting, illustrating the typical lifecycle of media attention around significant political events.
Media reporting.
Note: The dashed lines represent the start of the first and second survey experiment data collections.

Figure 2 presents the distributions of topics from the headlines of the above newspaper articles. Given that we do not have the rights to use and analyse the main body of the news articles, we use the dates and headlines in our media analysis. To identify topics in headlines, we rely on BERTopic, a topic modelling technique that leverages transformers to create dense clusters representing topic categories.Footnote 17 It converts text into high-dimensional vectors using embeddings, a process that captures the semantic meaning of words and phrases. These embeddings are then used to cluster the text into groups, with each cluster representing a distinct topic. The default model (‘all-MiniLM-L6-v2’) performs very well in English. We translated the Danish newspaper headlines into English using DeepL’s API before we applied topic modelling.Footnote 18
Media content – topic distribution.

Our analysis identifies 48 different topics. The words most associated with these topics show they span a wide range of subjects, including NATO’s defence partnership (topic 6), the Ukraine war’s influence (topic 13), concerns about Russia and Putin (topic 7), the Danish People’s Party and its leader Morten Messerschmidt’s positions (topic 16), consequences of rearmament (topic 11), controversies about the question wording on the ballot paper (topic 32), expert insights on polling (topic 35), and the campaign to win over young voters (topic 8). Figure 2 shows that many of the topics have very similar levels of prominence in our data. Although certain topics were more prominent, it is evident that the public had access to a diverse array of information about the referendum. This variety in coverage likely provided voters with ample opportunity to become well informed during the campaign period.
We draw on data from a separate panel survey, conducted by Epinion using a web-based CAWI design, in which a representative sample of Danish voters (N = 1,249) was interviewed at the beginning of the campaign in April 2022 and re-interviewed immediately after the referendum. The two-wave panel design allows us to track changes in public opinion over the course of the campaign and examine motivations for voting yes or no. The first wave was fielded seven weeks before the vote – prior to the campaign’s informational push across media – and the second wave followed shortly after the referendum. Panel attrition between the two waves was approximately 25%. In the following, we present descriptive and visual evidence comparing the two panel waves to show how respondents’ positions shifted over the course of the campaign. First, as with previous opt-out referendums (Hobolt Reference Hobolt2009; Beach Reference Beach2018, Beach Reference Beach, Christiansen, Elklit and Nedergaard2020; Beach and Finke Reference Beach and Finke2021), there is evidence that most voters acquired enough amount of information throughout the campaign, enabling them to make informed choices. In April 2022, 45% of the respondents said they had sufficient information to make an informed choice (ie perceived knowledge), whereas by the vote, 67% believed they had this information (see Figure 3).
Increase in feeling informed throughout the campaign.
Note: Respondents’ perceived knowledge is measured on a 1–5 scale based on their agreement with the statement: ‘I have/had sufficient knowledge to assess what I should vote for in the referendum on the defence opt-out’. Response options range from ‘completely agree’ to ‘completely disagree’.

Figure 4 illustrates the movement of voters during the campaign. Most respondents in the panel survey ended up voting as they stated they intended to vote at the start of the campaign. Undecided voters broke towards voting ‘yes’ in the final weeks of the campaign. In total, 46% of the undecided voters ended up voting ‘Yes’ and 28% voted ‘No’.
Voter movement during the campaign.
Note: Respondents’ vote choice is measured by the question: ‘Did you vote/do you intend to vote “yes” or “no” to the abolition of the Danish opt-out from the EU’s defence policy?’ Response options are: ‘yes’, ‘no’, ‘abstain’, and ‘don’t know’.

To further investigate whether voters’ decisions aligned more closely with their underlying EU attitudes as the campaign progressed, we present Figure 5 based on our panel data from the start and the end of the campaign.
EU position during the campaign.
Note: Respondents’ EU positions are measured on a 1–5 scale, asking whether Denmark has gained more advantages or disadvantages from EU membership. Responses are grouped into ‘More advantages’ (1–2) and ‘More disadvantages’ (4–5).

The figure tracks individual respondents’ EU positions and their reported vote intentions over the course of the campaign. The analysis reveals two key patterns. First, voters’ attitudes towards the EU remained relatively stable throughout the campaign period (see upper panel in Figure 5). Notably, the shifts that did occur moved in both directions with about the same magnitude. Second, as the campaign advanced, EU-positive voters increasingly expressed intentions to vote ‘Yes,’ while EU-negative voters became more likely to indicate a ‘No’ vote (see lower panel in Figure 5). This growing alignment between EU attitudes and vote intentions suggests that voters became more informed over time, allowing them to better connect their pre-existing views with the referendum choice. These findings support the interpretation that the campaign facilitated information processing and helped voters activate their EU positions (ie engage in issue-voting), rather than simply being influenced by elite messaging.
Findings
In this section, we present the results of the analysis of the three hypotheses. We first analyse the extent to which there was a difference in the magnitude of the effects of the four frames at the start and the end of the campaign (H1). This analysis also enables us to assess whether there were heterogeneous effects in terms of frame strength (H2). We then analyse whether less knowledgeable voters were more susceptible to frames both at the start and the end of the campaign (H3).
The first hypothesis predicted that voters would be responsive to frames at the start of the campaign, but that after exposure to information and arguments during the campaign, they would be less susceptible to framing effects. The upper panels in Figure 6 present results using the collapsed treatment categories. While both the Yes and No groups point in the expected direction – suggesting that exposure to either type of frame influenced vote intention – neither effect reaches conventional levels of statistical significance.
Framing effects at the start and the end of the referendum campaign.
Note: First survey experiment at the start of campaign (upper and lower left panels). Second survey experiment at the end of campaign (upper and lower right panels). Error bars represent 90% and 95% confidence intervals.

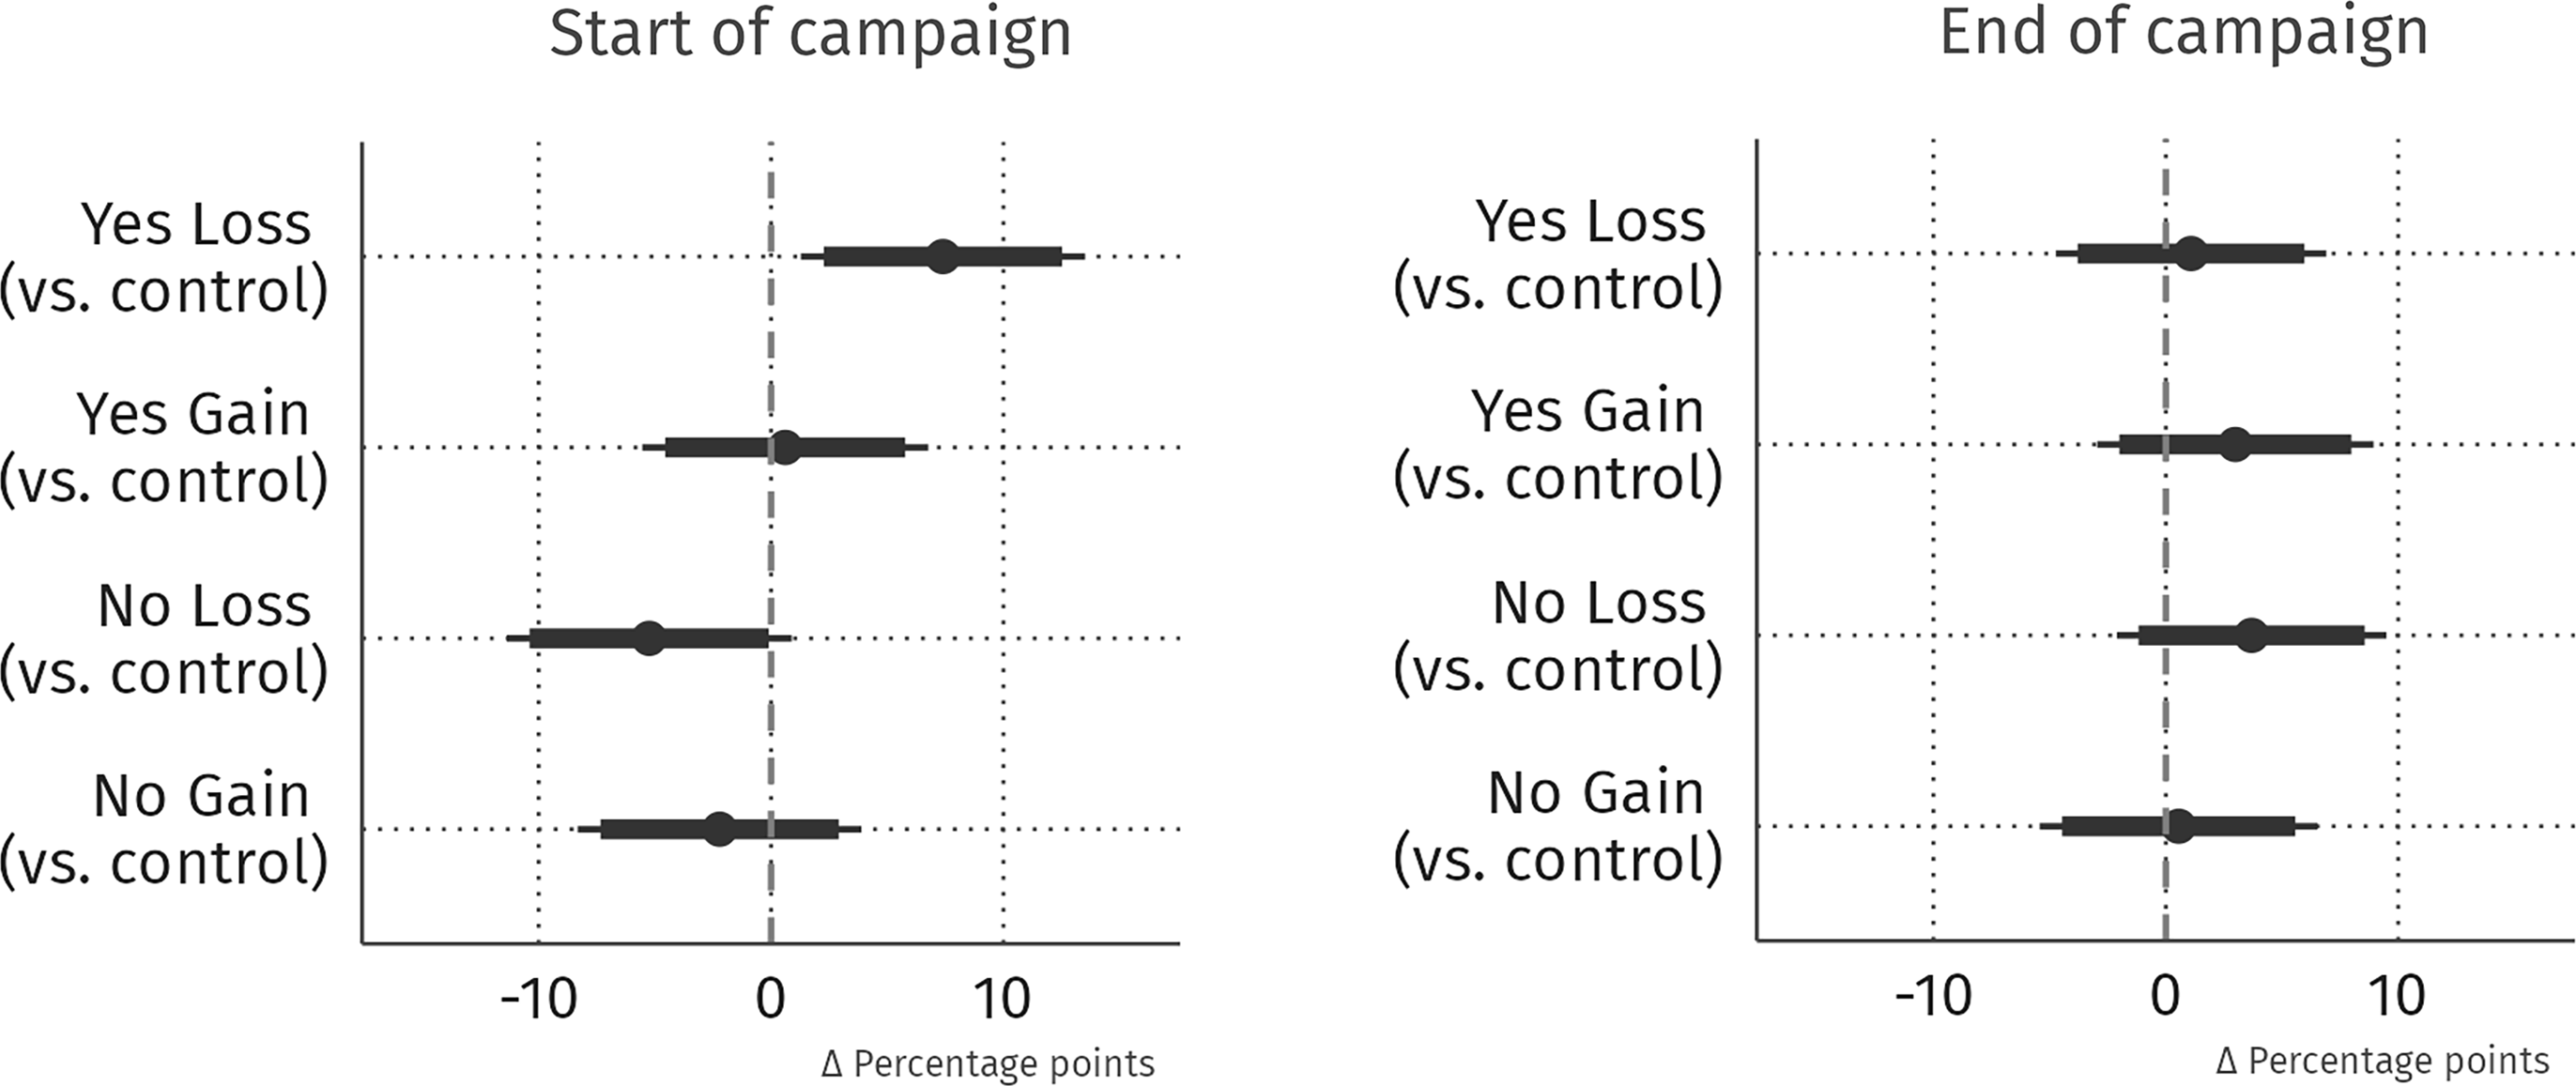
Significant effects of frames first appear when we disaggregate the pro/anti messages according to loss or gain frames. The lower left panel in Figure 6 presents estimates of the effects of all four frames deployed at the start of the campaign. The analysis shows that respondents receiving both loss frames (Yes and No) at the start of the campaign shifted their views towards the proposition as compared to the control group. Both shifts were in the direction expected. Support for abolishing the defence opt-out amongst respondents who received the Yes-Loss frame was 5.7% higher than for the control group (95% CI: 11.2%::0.3%) (Yes-Loss).Footnote 19
In turn, respondents in the treatment group receiving the frame highlighting negative consequences of abolishing the opt-out (No-Loss) showed a lower level of support. The point estimate indicates that support in this group was -4.7% (95% CI: -10.2 %::0.7%) lower as compared to the control group. The changes for voters who received either Yes or No ‘gain’ frames were not significant compared to the control group.
The lower right panel in Figure 6 shows that there were no substantial and statistically significant framing effects at the end of the campaign. The point estimates related to the loss frames were smaller in size compared to the before-campaign experiment. The figures indicate that voters on aggregate were not affected by framing effects at this late stage of the campaign, or, if so, the effects were small.Footnote 20 Strikingly, there are almost no differences in framing effects across the four treatment groups in the second survey experiment. Taken as a whole, the results provide partial confirmation of our hypotheses. While voters were more susceptible to frames at the start than at the end of the campaign, this held only for loss frames.
In order to test whether our results are robust across different specifications, Figure 7 shows that the exclusion of respondents who said that they ‘will not vote’ or ‘don’t know’ does not alter the findings. Instead, this exclusion provides additional evidence indicating that loss frames had a substantial impact on respondents at the beginning of the campaign. However, it also confirms that the framing effect diminished over time as the campaign progressed.
Framing effects – ‘will not vote’ and ‘don’t know’ excluded.
Note: First survey experiment at the start of campaign (left panel). Second survey experiment at the end of campaign (right panel). Error bars represent 90% and 95% confidence intervals.

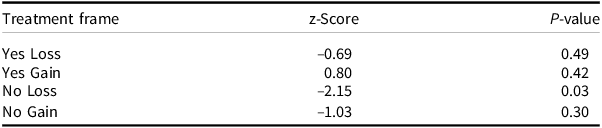
We also test hypotheses one and two more formally through a z-test. The z-value measures the difference between two coefficients (in standard error units) and tells us how many standard errors the difference between the two coefficients is from zero. The p-value measures the strength of evidence against the null hypothesis that there is no difference between the two coefficients. A p-value less than 0.05 (for a two-tailed test) suggests that the evidence against the null hypothesis is strong and that we can reject the null hypothesis in favour of the alternative hypothesis that the two coefficients are different. Table 2 shows that we observe such a difference for the treatment frame No-loss. The frame highlighting the negative consequences of voting for the proposal decreased respondents’ willingness to support the abolishment of the opt-out at the start of the campaign; however, this was no longer the case at the end of the campaign.
Z-test results

The third hypothesis dealt with whether there were heterogeneous effects based on levels of knowledge of voters. Were less knowledgeable voters more susceptible to framing effects? Respondents were coded as less knowledgeable if they had attained less than at least a short higher education.Footnote 21 We also ran analyses using political interest instead of education with substantively similar results. Figures 8 and 9 depict the results by education at the start and the end of the campaign.
Framing effects by education at the start of campaign.
Note: Survey experiment for less educated voters (left panel). Survey experiment for more educated voters (right panel). Error bars represent 90% and 95% confidence intervals.

Framing effects by education at the end of campaign.
Note: Survey experiment for less educated voters (left panel). Survey experiment for more educated voters (right panel). Error bars represent 90% and 95% confidence intervals.

As expected, we find that less knowledgeable voters were more susceptible to frames at the start of the campaign when compared with more educated voters, although only for the stronger loss frames. Support for abolishing the defence opt-out amongst respondents who received the Yes-Loss frame was 5.8% higher than for the control group. In turn, respondents in the treatment group receiving the No-loss frame showed a lower level of support, with the point estimate for support reduced by -6.5% compared to the control group.
At the end of the campaign, none of the frames were close to being statistically significant for less educated voters. Interestingly, the No-loss frame was significant for more educated voters – but in the opposite direction of the argument! Support amongst respondents who received the No-loss frame was 11.3% higher than for the control group (with 95% confidence). This appears to be what Chong and Druckman term a ‘countereffect’ (2007: 109-10), which can occur when respondents have the cognitive capacity and enough information to identify implausible arguments. When a respondent is then faced with the implausible argument, this treatment can push them in the opposite direction based on the logic that if that is the ‘best’ argument for a position, then the position itself becomes discredited, making them more likely to support the opposite position.
During the 2022 Danish referendum campaign, the no-side argument that emphasised the likelihood that common EU defence would lead to the (unwanted) creation of a common EU army was widely rejected by experts in the media and debates. As this discredited argument was a prominent part of the No-Loss frame that we used in the experiment, the dismissal of it by experts can during the campaign have contributed to the argument backfiring when we gave it to more educated voters at the end of the campaign, making them more likely to say they will vote yes in comparison to the control group.
Discussion and implications
Overall we found support for the claim that voter susceptibility to framing effects was reduced during the course of the referendum campaign, although only for strong loss-related frames and amongst less knowledgeable voters. At the start of the campaign, voters were found to be susceptible to stronger loss argument frames. By the end of the campaign, none of the argument frames were significant across all of the surveyed voters, demonstrating that even less knowledgeable Danish voters had received enough information and exposure to arguments to make them less susceptible to framing effects. This interpretation is strengthened by the finding of a ‘countereffect’ amongst more knowledgeable voters at the end of the campaign, in which they were able to correctly identify a discredited argument. That these voters became more likely to support the opposition position is not an indication that they became susceptible to a new type of framing effects. Instead, as argued by Chong and Druckman (Reference Chong and Druckman2007), it indicates that exposure to an implausible argument undermines voter assessments of the position itself. One alternative interpretation of our findings could be that voters were only susceptible to frames that were consistent with their underlying attitudes towards the EU. However, we found that voters were susceptible to loss-related frames at the start of the campaign irrespective of argument direction (yes or no), suggesting that framing effects worked independently of underlying attitudes towards the issue.
Our findings show that after being exposed to a campaign, most Danish voters were able to make choices based on their underlying attitudes towards the issue itself, that is, issue-voting. The findings therefore paint a more optimistic picture regarding campaign effects, different from other studies that highlight more pessimistic concerns related to the role of negativity, voter selectivity, and asymmetry in capacities across agents in political campaigns (Nyhuis et al. Reference Nyhuis, Song and Boomgaarden2021; Ramírez-Dueñas and Vinuesa-Tejero Reference Ramírez-Dueñas and Vinuesa-Tejero2021; Prato and Wolton Reference Prato and Wolton2018).
Finding that campaigns reduce voter susceptibility to frames raises an interesting paradox. Political parties and other elites spend considerable time and resources trying to persuade voters during high salience EU referendum campaigns. Why would they do this if our finding holds that elite arguments do not move voters during campaigns? One answer is that when much is at stake, neither side of a referendum battle would want to cede the stage to their opponents. If debates were completely one-sided, we might expect that voters would potentially be more susceptible to elite arguments, as they would lack information and arguments that would enable them to figure out whether their underlying attitudes point in the other direction.
Yet when both sides engage in debate, our findings suggest that they tend to cancel each other out. And in some instances, an argument from the opposing side can be so discredited that it backfires on the campaigners advocating it, as we found with the no-side’s EU army argument. But taken as a whole, when seen from a direct democratic perspective, finding that elite arguments do not work after voters are exposed to information and arguments is a good thing. While they do not persuade voters, the efforts by political parties and other elites are a democratic public good that provide the information and arguments that empower competent voters to make choices that are consistent with their underlying attitudes (Beach and Finke Reference Beach and Finke2021: 1501).
Can we expect that the impact of the campaign in reducing voter susceptibility holds in other EU referendums, and referendums on other topics? Given that our more optimistic findings echo those found by other scholars using different designs in other EU referendums (Goodwin et al. Reference Goodwin, Hix and Pickup2020; Beach and Finke Reference Beach and Finke2021) and in other types of referendum (eg Bechtel et al. Reference Bechtel, Hainmueller, Hangartner and Helbling2015 for a Swiss case), this suggests that our findings about campaigns are generalisable. What then are the conditions under which we might expect exposure to information and arguments reduces voter susceptibility to framing effects? Through comparing the context of our study with other studies that find similar patterns, we identify three contextual conditions.
First, for a campaign to reduce susceptibility to framing effects, there has to be a relatively robust stream of communication (Hobolt Reference Hobolt2009). If there is little coverage, or if it is very one-sided, we would not expect voters to be exposed to enough information and arguments to make attitude-consistent choices. Second, voters should feel that the issue is important enough to be motivated to gather and process information and arguments instead of relying on shortcuts such as partisan cues (Svensson Reference Svensson2002; Hobolt Reference Hobolt2009). In both the 2015 and 2022 Danish opt-out referendums for instance, voters in surveys responded that they perceived that the propositions were important. One proxy for importance is turnout. While lower than for national parliamentary elections, turnout in EU referendums tends to be relatively high in countries such as Ireland and Denmark.Footnote 22 Third, voters need to have stable, pre-existing attitudes towards the issue, as well as some degree of knowledge and interest in the issue. This can be due to a history of EU referendums in a country (eg Ireland and Denmark), or when an issue was debated extensively prior to a referendum being convened, as was the case in the British 2016 EU membership referendum (Goodwin et al. Reference Goodwin, Hix and Pickup2020). Fourth, broader systemic factors – such as media environments that ensure balanced information flows, party systems that are not deeply polarised, and campaign regulations that secure relatively equal access for different sides – may also influence the degree to which voters can engage sensibly with campaign content. In contexts such as these, we would expect that voters would be competent to use exposure to campaign information and arguments to become less susceptible to framing effects.
On a final note, our findings also have a broader methodological implication for researchers using survey experiments. The information environment in which an experiment is deployed can affect the findings. If we had only undertaken the initial ‘before campaign’ survey experiment, we would have concluded that framing effects of negative (loss) arguments mattered. However, our findings would have been externally valid only within the pre-campaign context and could not be generalised to the after-campaign context. The importance of the informational environment for what a survey experiment finds is also supported by the findings of Goodwin et al. (Reference Goodwin, Hix and Pickup2020), in which they found that at the start of the Brexit referendum campaign, positive arguments mattered because voters had not been exposed to them previously. However, if they had deployed their survey experiment at the end of the Brexit campaign, they would most likely have found that neither positive nor negative arguments mattered. In other words, survey experiment findings should be contextualised based on the information environment in which they were fielded.
Conclusion
Do campaigns matter in reducing voter susceptibility to framing effects? This article used the case of the 2022 Danish defence opt-out referendum to test whether campaigns matter. EU referendums such as the 2022 Danish opt-out vote are a particularly good context in which to assess the impact of exposure to arguments and information during a campaign because potential confounders such as partisanship and prior information on the issue are not present. At the same time, voters in countries such as Denmark have underlying attitudes towards the issue of support/opposition to the EU.
In contrast to existing studies, our design enabled us to test directly the impact that the campaign made for voter susceptibility to framing effects. However, we also acknowledge several limitations with our design. First, given that all the frames contained different information to match the real-world campaign arguments, future work could explore whether more equivalent loss and gain frames matter. While more equivalent arguments might sacrifice a degree of realism, they would be a more precise treatment. Moreover, utilising panel survey data would allow for closer examination of opinion dynamics at the individual level. Additionally, future studies could conduct a more comprehensive media analysis that leverages the wealth of contextual information generated during such campaigns across both online and offline platforms. While our study was limited to analysing media headlines, future research might utilise full articles, social media discourse, and other forms of campaign communication to gain a more nuanced understanding of how political messages are disseminated and resonate with voters. Finally, future studies should collect supplemental information during the experiment that could be used to shed more light on whether the mechanisms behind reduced susceptibility were more related to voters having enough information or due to prior exposure to arguments themselves. For example, respondents at the end of the campaign could be asked about their reasoning through either open-ended response questions or qualitative interviews.
Taken as a whole, the findings suggest however that the 2022 referendum campaign made Danish voters able to make choices based on their underlying EU attitudes instead of being prone to elite arguments. We found that while voters were susceptible to framing effects related to ‘loss’ arguments at the start of the campaign, they were not susceptible at the end of the campaign. This suggests that Danish voters had received enough information and/or were repeatedly exposed to political arguments that enabled them to take positions that reflected their underlying EU attitudes. In other words, the campaign empowered them to actually answer the question they were asked in the referendum.
Supplementary material
The supplementary material for this article can be found at https://doi.org/10.1017/S147567652510011X.
Data availability statement
Replication material for this study is available at https://doi.org/10.7910/DVN/AION8Q
Funding statement
The Independent Research Fund Denmark funded the survey instrument for the project ‘DKOPT – DEF – Voter behavior in the Danish defence opt-out referendum’, grant number 2033-00240B. The project was approved on the 11 March 2022.




 Open access

