


Introduction
Borderline personality disorder (BPD) is a debilitating psychiatric condition characterized by pervasive instability across multiple core domains of functioning. Although a heterogeneous disorder, those affected by BPD typically experience intense and frequent emotion dysregulation, interpersonal strife, and engage in self-damaging behaviors (American Psychiatric Association [APA], 2022). As many as 10% of persons with BPD are estimated to die by suicide (Paris, Reference Paris2019). Persons with BPD frequently utilize mental health resources, emergency departments, and primary healthcare systems (Pascual et al., Reference Pascual, Córcoles, Castaño, Ginés, Gurrea, Martín-Santos and Bulbena2007; Sansone, Farukhi, & Wiederman, Reference Sansone, Farukhi and Wiederman2011), and thus, clinical settings offer a unique opportunity to prevent premature mortality among this population.
Many risk and vulnerability factors thought to shape the emergence and maintenance of BPD are also linked to the etiology of self-inflicted injury, and suicide more broadly (e.g. emotion dysregulation, interpersonal trauma, isolation, and loss, behavioral impulsivity; Derbidge & Beauchaine, Reference Derbidge, Beauchaine, Lewis and Rudolph2014; Kaufman, Crowell, & Lenzenweger, Reference Kaufman, Crowell, Lenzenweger, Beauchaine and Hinshaw2017). This co-occurrence helps to explain why suicide risk is elevated among persons with BPD compared to many other clinical groups and compared to the general population (Kaufman et al., Reference Kaufman, Crowell, Lenzenweger, Beauchaine and Hinshaw2017). At the same time, the majority of persons who die by suicide do not have a BPD diagnosis, and the majority of those with a BPD diagnosis do not die by suicide. Given that suicide is a low base-rate outcome even among high-risk groups (Centers for Disease Control and Prevention, 2023), and key predictors do not typically demonstrate sensitivity or account for substantial variance in suicide in isolation (Franklin et al., Reference Franklin, Ribeiro, Fox, Bentley, Kleiman, Huang and Nock2017), identifying risk profiles among vulnerable groups may be particularly beneficial. Recent work by Xiao et al. supports this multifaceted approach to suicide prevention. The authors identified five distinct suicide profiles (latent classes) in an analysis of data (death investigator information gathered from witnesses, family, friends, and other informants) on over 300 000 suicide decedents from the National Violent Death Reporting System 2003–2020. This work highlights the complexity of suicide and the importance of suicide prevention strategies that address the specific and often differing needs of those who die by suicide.
Specific to BPD, Wedig et al. (Reference Wedig, Silverman, Frankenburg, Reich, Fitzmaurice and Zanarini2012) assessed baseline and time-varying predictors of suicide attempts among patients with BPD over 16 years of prospective follow-up. They identified several risks as bivariate predictors of suicide attempts, many of which were co-occurring mental health conditions and previous exposure to self-injury. It can be challenging to identify persons with BPD who are at particularly high risk of death by suicide, as, by definition, many of the risk factors for self-injury are defining criteria of BPD. It therefore may be helpful to characterize how persons with BPD who die by suicide differ both from living individuals with BPD and those who die by suicide without a history of this condition.
Although it is challenging to design prospective studies that will sample persons who do and do not die by suicide, alternative designs using retrospective medical records often contain important information that can speak to individuals' functioning prior to death. The present study utilizes a population-based data resource and biobank available through the Utah Suicide Mortality Risk Study (USMRS) to characterize patterns of medical and mental diagnoses among persons with a BPD diagnosis who died by suicide (SUI + BPD). To better understand the factors that are associated with suicide death among this already high-risk group, we compare our SUI + BPD group to (1) persons who died by suicide without a history of BPD (SUI – BPD), (2) persons with BPD who did not die by suicide (CTRL + BPD), and (3) individuals who died by suicide with a different personality disorder diagnosis (SUI + PD – BPD) using a phenotype-based phenome-wide association study framework. Identifying high-risk profiles or subtypes of individuals who are particularly vulnerable to suicide may help us more effectively target prevention and treatment efforts that are typically limited in availability.
Methods
Samples
Suicide mortality is particularly high in the state of Utah (Utah Department of Health and Human Services, Indicator-Based Information System (IBIS) for Public Health, 2023). A centralized Office of the Medical Examiner (OME) makes a determination of suicide following a detailed investigation of the scene and circumstances of death, and determination of medical conditions by autopsy, interviews with survivors, and toxicology reports. Through a 25-year collaboration with the OME, the USMRS has built a large population-based data resource that facilitates unique opportunities to identify critical gaps in our understanding of suicide and enhance ongoing suicide prevention work. Annual approvals from institutional review boards at the University of Utah, Intermountain Healthcare, and the Utah Department of Health and Human Services allow the linkage of Protected Health Information (PHI) from suicide deaths to data within the Utah Population Database (UPDB). The UPDB is a secure state-wide database that includes demographics and two decades of electronic health records (EHR) data (all inpatient encounters, emergency department, and ambulatory care encounters, and outpatient encounters from the two largest clinical data providers in the state, University of Utah Healthcare and Intermountain Healthcare), with coverage of ~85% of the state's population. PHI is stripped before data are provided to the research team and all samples are de-identified. Currently, the USMRS includes records from 10 500 Utah suicides with linked demographic and EHR data. In addition to the suicide death data, demographic and EHR data are also available from 99 990 Utah controls (population-based; matching 1:10 on age/sex to suicide deaths using at-risk sampling). This study assessed suicide death and control data from 1996 through 2022.
Diagnostic EHR data
Phenotypes for suicide deaths and controls were based on International Classification of Diseases (ICD 9 and 10) diagnostic codes. For suicide deaths, ICD codes within 2 weeks of death were removed to ensure that codes from the death event were not included in the phenotyping. Only individuals who were 18 and older were included in this study. The presence of at least one BPD ICD code (ICD 9 301.83; ICD10 F60.3) was used to define individuals with a BPD diagnosis. To broadly assess common medical conditions, diagnostic data were aggregated to PheWAS trait codes (hereby ‘phecode’). Phecodes are curated groupings of ICD codes designed to capture clinically relevant traits or conditions and are commonly used in phenotyping applications from the EHR (Bastarache, Reference Bastarache2021). We used the PheWAS R package (Carroll, Bastarache, & Denny, Reference Carroll, Bastarache and Denny2014) for suicides and controls separately. Phecodes represent one validated way to define phenotypes for research using EHR data (Bastarache, Reference Bastarache2021). ICD 9 Phecode Map 1.2 was used to aggregate all ICD 9 codes and ICD 10 CM Phecode Map 1.2 beta was used to aggregate all ICD 10 codes (Denny et al., Reference Denny, Bastarache, Ritchie, Carroll, Zink, Mosley and Roden2013). Phecode maps, phecode definitions, and additional information can be found at https://phewascatalog.org/phecodes. Individuals were classified as positive for a specific phecode trait if their medical records contained at least one corresponding ICD code within that phecode's defined set, ensuring a comprehensive phenotypic categorization based on established clinical coding standards. We defined the SUI + PD−BPD group based on the presence of at least one ICD code in the personality disorder phecode domains (‘Personality disorders’, ‘Schizoid personality disorder’, or ‘Antisocial/borderline personality disorder’), only including individuals without an ICD BPD diagnosis. Other personality disorders in ICD 9 and 10 include paranoid, schizoid, schizotypal, antisocial, borderline, histrionic, narcissistic, avoidant, dependent, and obsessive-compulsive PDs, as well as other specific or unspecified personality disorders (see online Supplementary Table S1). Comparisons of age and sex between the groups (SUI + BPD v. SUI−BPD; SUI + BPD v. CTRL + BPD; SUI + BPD v. SUI + PD−BPD) were done using t tests with Benjamini–Hochberg (BH) adjustment to correct for multiple testing. The mean time to death from the first diagnosis year of BPD and the year of suicide death was also calculated.
Phenotype-based phenome-wide association tests
We performed phenotype-based phenome-wide association analyses (Gao et al., Reference Gao, Coombes, Ryu, Pazdernik, Jenkins, Pendegraft and Olfson2023), testing for differences in a wide range of clinical diagnoses (phecodes) between groups that associate with individuals with BPD that died by suicide. Multivariable logistic regression models controlling for age, sex, and the square root-transformed total number of diagnostic codes were used to test for diagnostic differences between groups. The transformed number of total ICD codes was included as a proxy for the total number of health encounters, to account for the potential influence of informative presence bias (Goldstein, Bhavsar, Phelan, & Pencina, Reference Goldstein, Bhavsar, Phelan and Pencina2016). Differences in healthcare utilization patterns can arise for many reasons such as access to healthcare, socioeconomic status, or simply differing health needs. Some individuals in the Utah cohort are frequent users of medical services (e.g. regularly visiting doctors or managing chronic conditions). Conversely, others rarely seek medical attention, leading to more sparse EHRs. Since individuals with ‘poorer health’ tend to have more frequent healthcare visits, more data are likely recorded for them compared to other individuals, we accounted for this potential bias. Since some phecodes have a low frequency within groups, Firth's penalized maximum likelihood logistic regression was used to reduce bias (Heinze & Schemper, Reference Heinze and Schemper2002). All analyses were conducted in R (https://www.r-project.org/).
Three different comparisons were made (SUI + BPD v. SUI − BPD; SUI + BPD v. CTRL + BPD; SUI + BPD v. SUI + PD − BPD). In total, 1733 phecodes were compared between SUI + BPD v. SUI − BPD. With Bonferroni correction for 1730 tests, p values below 2.89 × 10⁻⁵ were considered significant. In total, 1564 phecodes were compared between SUI + BPD v. CTRL + BPD. With Bonferroni correction for 1564 tests, p values below 3.2 × 10⁻⁵ were considered significant. In total, 1577 phecodes were compared between SUI + BPD v. SUI + PD − BPD. With Bonferroni correction for 1577 tests, p values below 3.17 × 10⁻⁵ were considered significant. Numbers of phecodes tested differ between comparisons based on prevalence. If the phecode was not present in either group compared it was excluded from the analysis.
We also performed within-sex, stratified analyses with multivariable logistic regression models controlling for the square root-transformed total number of diagnostic codes and age within the comparisons described above. In total, 1648 phecodes (female) and 1624 phecodes (male) were compared between SUI + BPD v. SUI − BPD, with Bonferroni correction for multiple testing and p values below 3.03 × 10⁻⁵ were considered significant for females and 3.08 × 10⁻⁵ for males. In total, 1473 phecodes (female) and 1214 phecodes (male) were compared between SUI + BPD v. CTRL + BPD, with Bonferroni correction for multiple testing and p values below 3.39 × 10⁻⁵ were considered significant for females and 4.12 × 10⁻⁵ for males. In total, 1480 phecodes (female) and 1318 phecodes (male) were compared between SUI + BPD v. CTRL + BPD, with Bonferroni correction for multiple testing and p values below 3.38 × 10⁻⁵ were considered significant for females and 3.79 × 10⁻⁵ for males.
Results
Sample characteristics
BPD diagnoses were present in 3.8% of suicide deaths and among 0.3% of controls. Other personality disorder diagnoses (excluding BPD) were present in 6.0% of cases and 1% of controls. On average members of the SUI + BPD group were significantly younger than the three comparison groups (adjusted p values <0.03), and were significantly more likely to be female (adjusted p values <0.0003; Table 1). The prevalence of each phecode for each group is given in online Supplementary Table S2. Age at death for each group is also now reported in Table 1. The mean time to suicide death from the first year BPD was diagnosed to the year of suicide death 5.07 years (5.30 s.d.). In total, 126 individuals (33% of suicide deaths with BPD diagnoses) died by suicide within a year of their first known diagnosis of BPD.
Table 1. Demographics and diagnostic characteristics of the sample
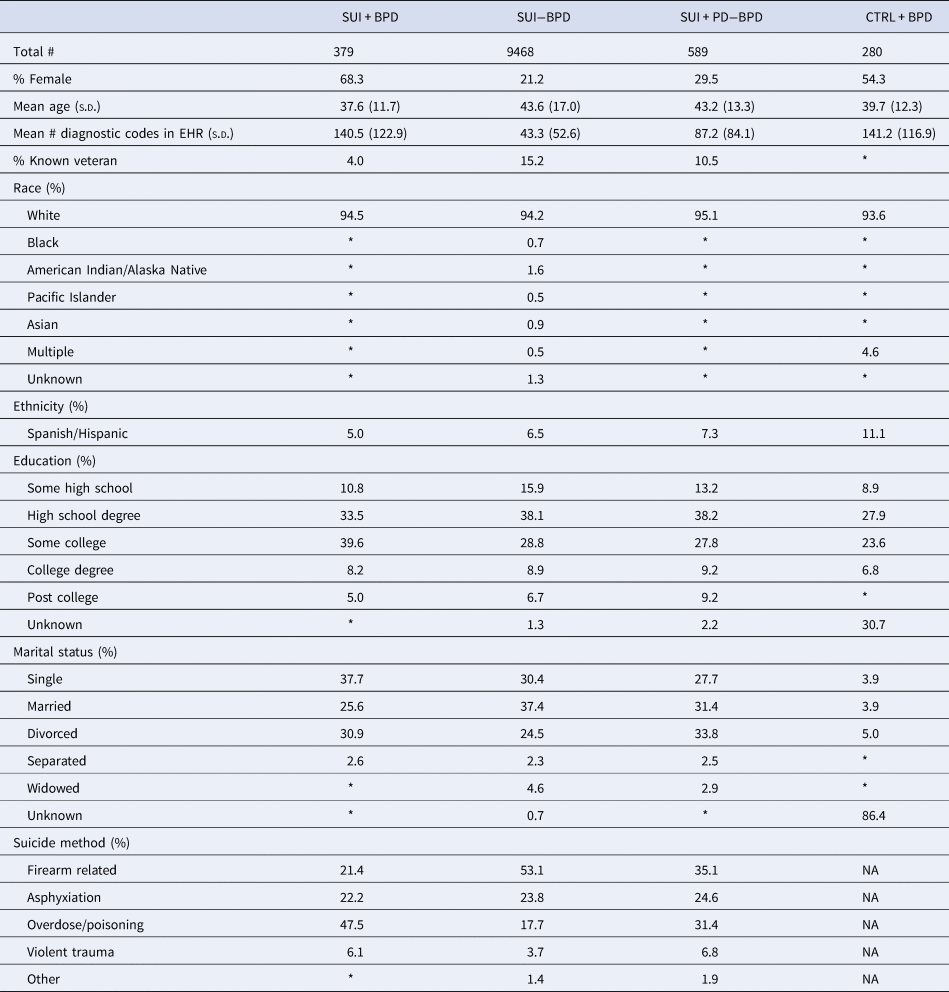
In compliance with the Utah Resource for Genetic and Epidemiologic Research (RGE) standards, numbers smaller than 11 individuals cannot be reported and are indicated with an asterisk.
Model comparisons
In the SUI + BPD v. SUI − BPD comparison, 17 phecodes related to psychiatric disorders (posttraumatic stress disorder [PTSD], major depressive disorder [MDD]/depression, schizophrenia/psychosis, bipolar, anxiety, agoraphobia/social phobia/panic disorder, obsessive-compulsive disorders, and dissociative disorder), substance use disorders, suicidal ideation, and previous suicide attempts were statistically significantly overrepresented in suicide deaths with BPD diagnoses (see Fig. 1; Table 2; online Supplementary Table S3). Conversely, 16 phecodes related to pain (acute and chronic), inflammation, and type 2 diabetes were statistically significantly overrepresented in suicide deaths without BPD diagnoses (see Fig. 1; online Supplementary Table S3). In the female-specific analysis, 13 phecodes related to psychiatric disorders (PTSD, MDD, anxiety, schizophrenia/psychosis, bipolar), substance use disorders, hypopotassemia, and previous suicide attempts were statistically significantly overrepresented in female suicide deaths with BPD diagnoses (online Supplementary Table S4). Three phecodes related to inflammation and premature labor were statistically significantly overrepresented in female suicide deaths without BPD diagnoses (online Supplementary Table S4). In the male-specific analysis, nine phecodes related to MDD/depression, anxiety, bipolar, suicidal ideation and previous suicide attempts, and insomnia were statistically significantly overrepresented in male suicide deaths with BPD diagnoses and no phecodes significantly differed in male suicide deaths without BPD diagnoses (online Supplementary Table S5).
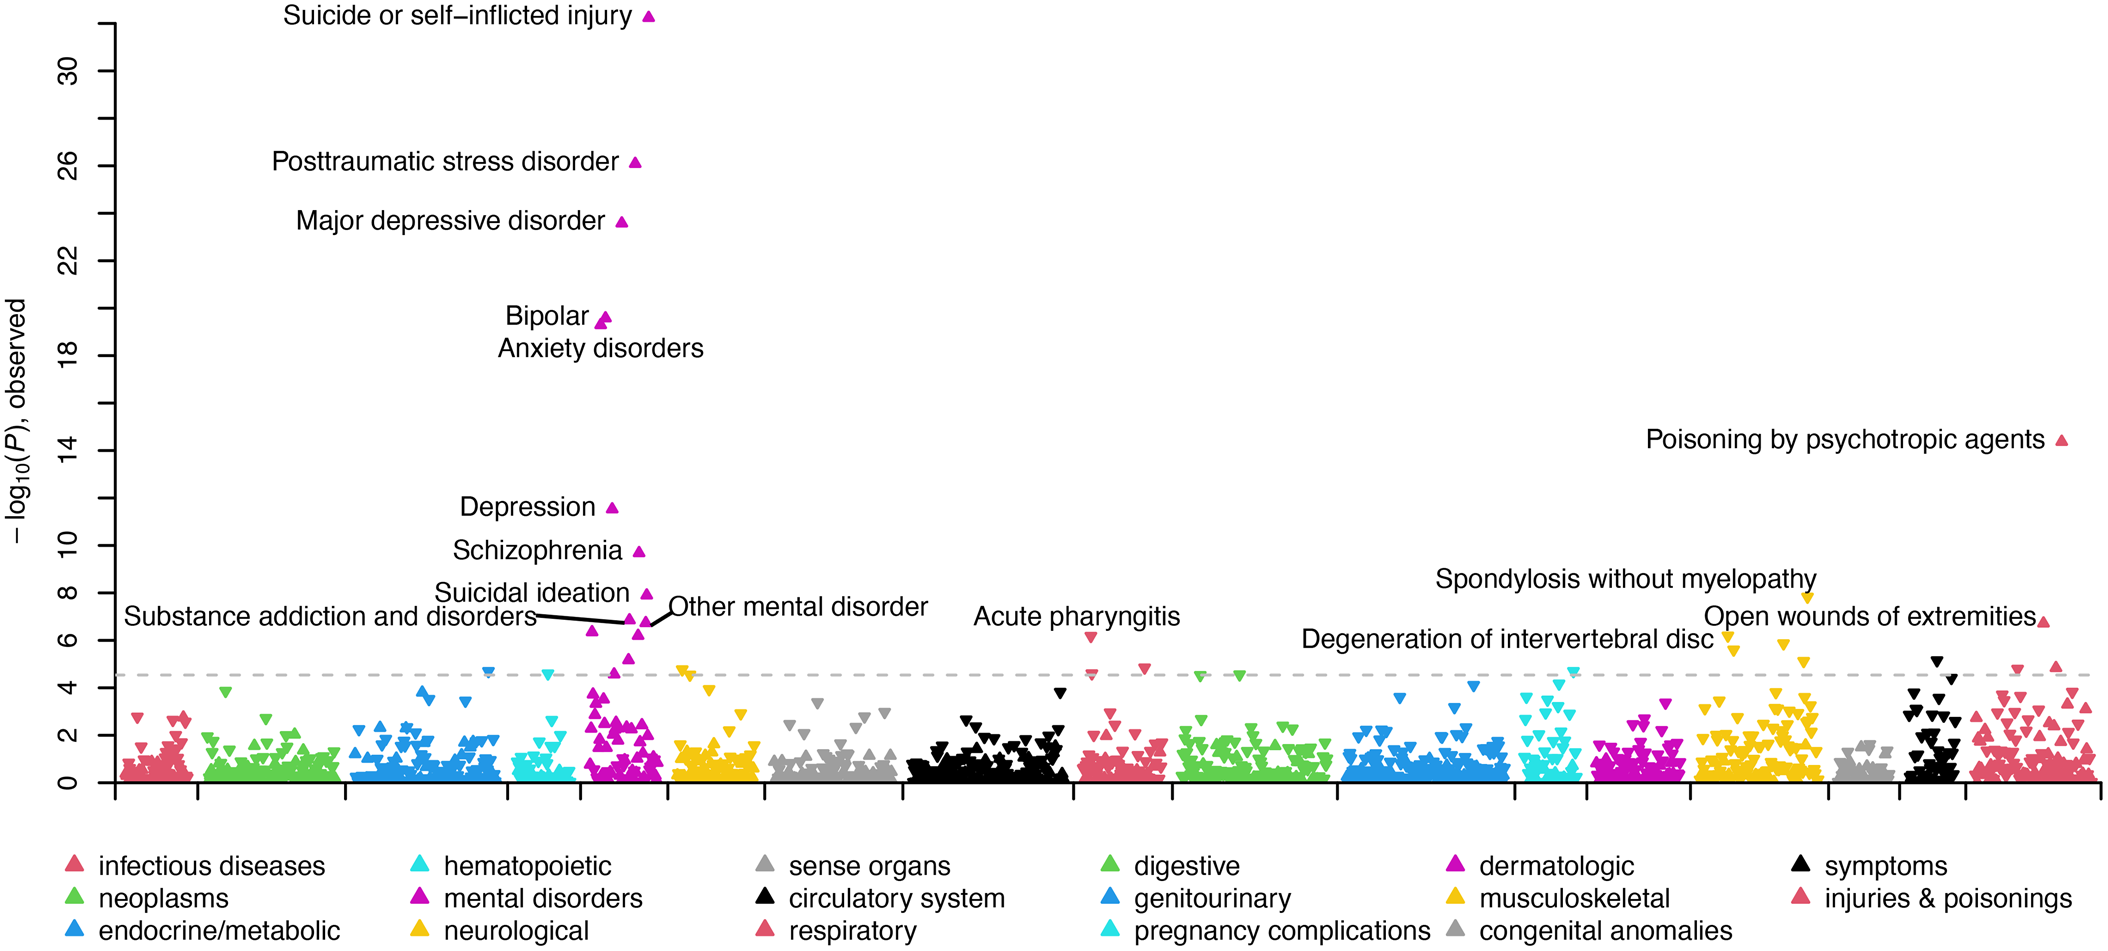
Figure 1. Manhattan plot comparing clinical phenotypes (Phecodes) in the electronic health record of SUI + BPD v. SUI − BPD. Phenotypes are grouped into 17 color-coded clinical categories along the x-axis. The y-axis represents the −log10 (p value) of the association between clinical category and SUI + BPD v. SUI − BPD. Arrows pointed upwards and indicate phenotypes that are elevated in SUI + BPD; whereas downward arrows indicate elevated phenotypes among SUI − BPD. The dashed line indicates the significance threshold with top significant clinical phenotypes in each clinical category labeled.
Table 2. Phecode information, means and significant model results for each group comparison

In the SUI + BPD v. CTRL + BPD comparison, four phecodes were statistically significantly overrepresented in suicide deaths with BPD diagnoses related to previous suicide attempts (including overdoses) or self-injury and hypopotassemia (see Fig. 2; Table 2; online Supplementary Table S6). One phecode was more prevalent in controls with BPD diagnoses ‘infectious and parasitic complications affecting pregnancy’. In the female-specific analyses, the same phecodes as above were significant, with the addition of substance use disorders in the female suicide deaths with BPD diagnoses (online Supplementary Table S7). No phecodes were significantly different in the male-specific analyses (online Supplementary Table S8).
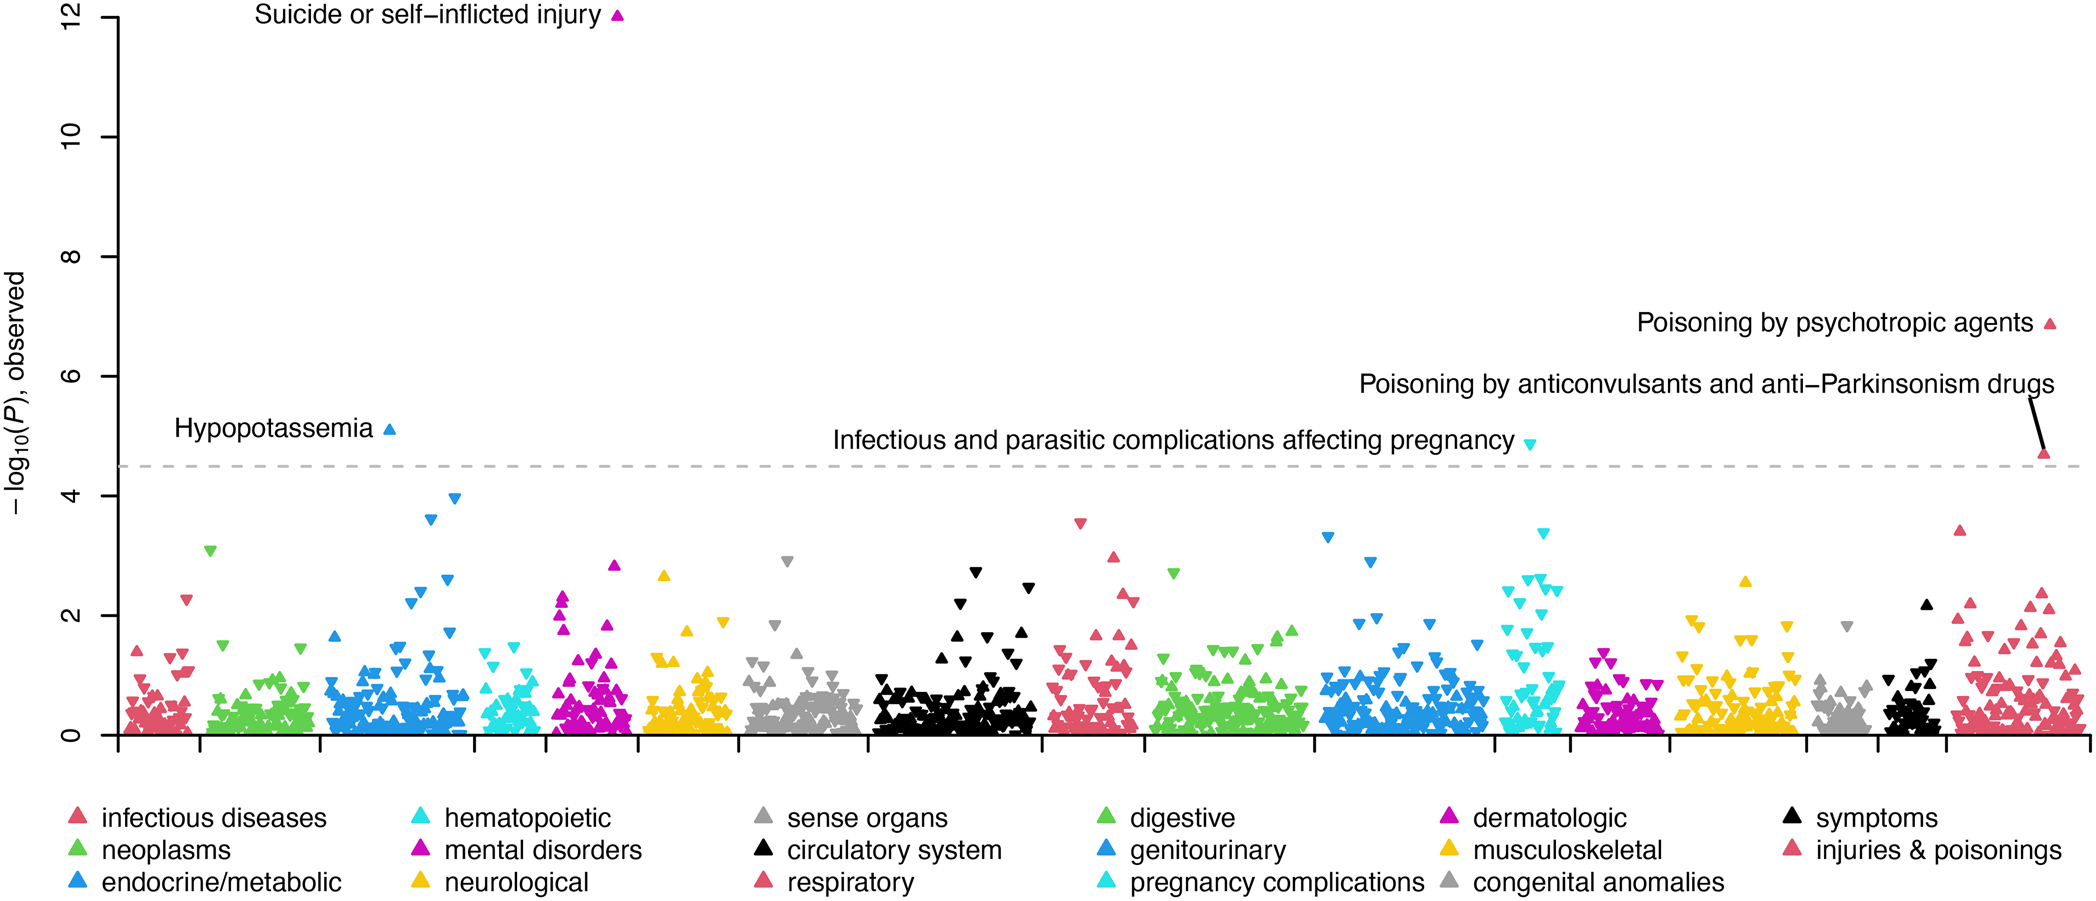
Figure 2. Manhattan plot comparing clinical phenotypes (Phecodes) in the electronic health record of SUI + BPD v. CTRL + BPD. Phenotypes are grouped into 17 color-coded clinical categories along the x-axis. The y-axis represents the −log10 (p value) of the association between clinical category and SUI + BPD v. CTRL + BPD. Arrows pointed upwards and indicate phenotypes that are elevated in SUI + BPD; whereas downward arrows indicate elevated phenotypes among CTRL + BPD. The dashed line indicates the significance threshold with top significant clinical phenotypes in each clinical category labeled.
In the SUI + BPD v. SUI + PD − BPD comparison, one phecode was statistically significantly overrepresented in suicide deaths with BPD diagnoses, ‘PTSD’. No phecodes were statistically significantly overrepresented in suicide deaths with other personality disorder diagnoses (Fig. 3; Table 2; online Supplementary Table S9). In the female-specific analysis, the PTSD phecode remained statistically significantly overrepresented in suicide deaths with BPD diagnoses (online Supplementary Table S10) and no phecodes were significant in the male-specific analysis (online Supplementary Table S11).
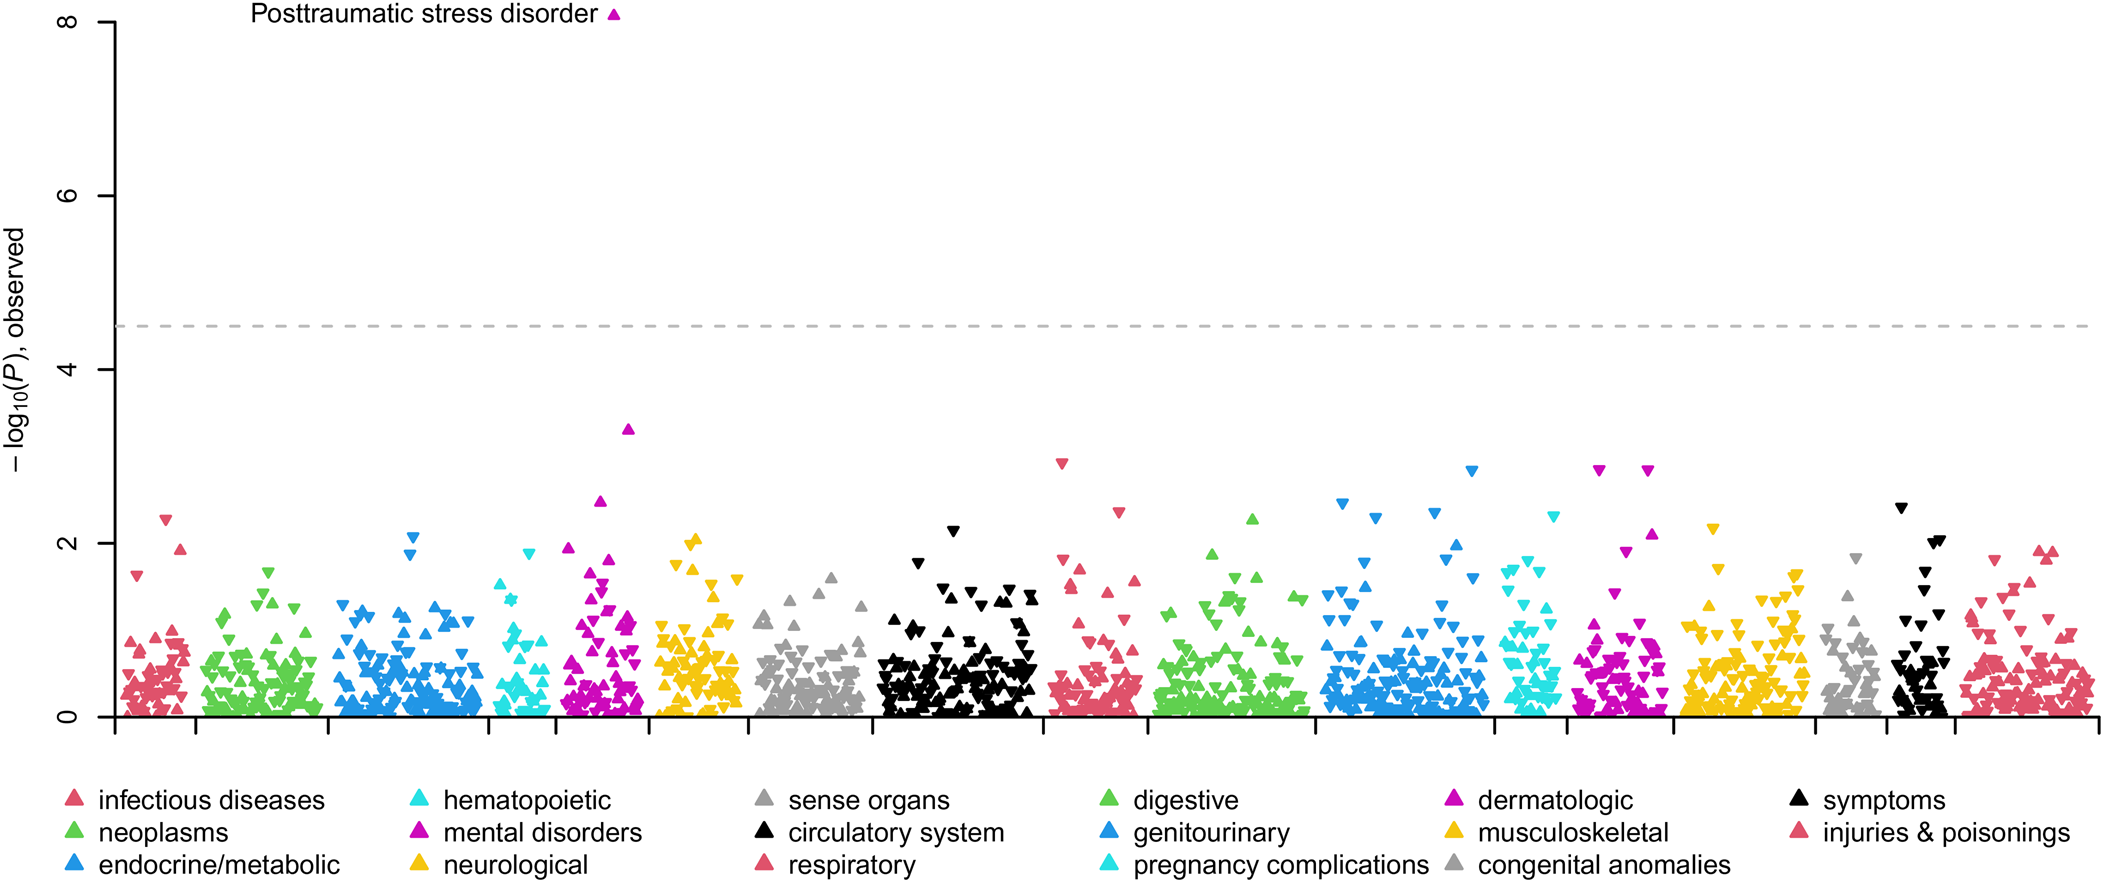
Figure 3. Manhattan plot comparing clinical phenotypes (Phecodes) in the electronic health record of SUI + BPD v. SUI + PD − BPD. Phenotypes are grouped into 17 color-coded clinical categories along the x-axis. The y-axis represents the −log10 (p value) of the association between clinical category and SUI + BPD v. SUI + PD − BPD. Arrows pointed upwards and indicate phenotypes that are elevated in SUI + BPD; whereas downward arrows indicate elevated phenotypes among SUI + PD − BPD. The dashed line indicates the significance threshold with top significant clinical phenotypes in each clinical category labeled.
Discussion
The present study used a unique, population-based suicide data resource to examine diagnostic correlates among persons with a BPD diagnosis who died by suicide. We compared this high-risk group to a number of clinically meaningful comparison groups in an attempt to better understand what characterizes risk among members of this particularly vulnerable clinical population. Even using a conservative approach to correct for multiple comparisons, differences emerged between persons with BPD who died by suicide and all other groups examined.
Those in the SUI + BPD group appeared more likely to present with co-occurring psychiatric diagnoses, and have a documented history of self-harm in the medical system prior to death, relative to those in the SUI – BPD group. Self-harm phecodes included ‘Open wounds of extremities (871)’, ‘Suicide or self-inflicted injury (297.2)’, and ‘Poisoning by psychotropic agents (969)’; these encompass a broad range of self-harm behaviors which included both non-suicidal and suicidal intent prior to the suicide death event.
These results align with an extensive literature documenting prevalent co-occurrence of BPD and self-injury, as well as high comorbidity of BPD with other psychiatric conditions like substance use. For example, studies suggest that as many as 70–95% of persons with BPD engage in some form of self-harm (whether non-suicidal or suicidal in nature; Goodman et al., Reference Goodman, Tomas, Temes, Fitzmaurice, Aguirre and Zanarini2017; Oumaya et al., Reference Oumaya, Friedman, Pham, Abou Abdallah, Guelfi and Rouillon2008), and approximately half of persons with BPD also meet criteria for current alcohol use disorder (Trull, Sher, Minks-Brown, Durbin, & Burr, Reference Trull, Sher, Minks-Brown, Durbin and Burr2000; Trull et al., Reference Trull, Freeman, Vebares, Choate, Helle and Wycoff2018). These patterns are noteworthy for two reasons. First, substance misuse and self-harm each appear to elevate risk for suicide in their own right (Grandclerc, De Labrouhe, Spodenkiewicz, Lachal, & Moro, Reference Grandclerc, De Labrouhe, Spodenkiewicz, Lachal and Moro2016; Rizk, Herzog, Dugad, & Stanley, Reference Rizk, Herzog, Dugad and Stanley2021), and, when combined with BPD, may elevate risk still further. Second, substance misuse and self-injury often each serve as means for dampening or avoiding negative affect (Hooley & Franklin, Reference Hooley and Franklin2018; Weiss et al., Reference Weiss, Kiefer, Goncharenko, Raudales, Forkus, Schick and Contractor2022). Emotion dysregulation is arguably the most central feature of BPD (Linehan, Reference Linehan1993) and our results demonstrate that BPD is associated with conditions marked by emotional and psychological distress at an elevated rate (even in comparison to other persons who die by suicide).
Interestingly, persons who died by suicide without BPD appear to have more frequently documented medical comorbidity and phecodes related to pain. There is an extensive literature documenting chronic pain as a risk factor for suicidal ideation, attempts, and suicide deaths (Kohrt, Griffith, & Patel, Reference Kohrt, Griffith and Patel2018), and recent evidence indicates that the risk of suicide increases twofold among individuals with chronic pain (Chincholkar & Blackshaw, Reference Chincholkar and Blackshaw2023). Recent latent class analyses have found that physical pain and medical conditions constitute a substantial group of suicide deaths (Xiao et al., Reference Xiao, Bi, Yip, Cerel, Brown, Peng and Mann2024). It is therefore noteworthy that individuals in the BPD + suicide group were relatively less likely to experience such conditions; particularly as individuals with BPD are overrepresented among those seeking medical care (see e.g. Sansone & Sansone, Reference Sansone and Sansone2015). Future research should examine whether the pathways to suicide may be more closely tied to emotional distress among persons with BPD, as compared to physical illness and/or pain among those who die by suicide without BPD.
Results comparing the SUI + BPD to the CTRL + BPD group indicate that history of previous suicide attempts and/or self-injury was significantly more common among those who died by suicide. This aligns with extant research indicating that more frequent engagement with self-injurious behaviors (suicidal and non-suicidal) advances risk for death by suicide more robustly than other known predictors and correlates (Franklin et al., Reference Franklin, Ribeiro, Fox, Bentley, Kleiman, Huang and Nock2017; Guan, Fox, & Prinstein, Reference Guan, Fox and Prinstein2012). It may be that persons with BPD who go on to die by suicide are more likely to engage in, or perhaps persistent in their self-injury, relative to living persons with a BPD history. Those in the SUI + BPD group also had higher incidents of hypopotassemia, whereas those in the CTRL + BPD were more likely to have medical complications affecting a pregnancy. It may be that persons in the SUI + BPD group were more likely to be hospitalized or treated in emergency departments where electrolytes are often assessed via blood test. There may also have been differences in medications prescribed to members of each of these groups such that potassium may have been more impacted among those with SUI + BPD. This may be an indirect signal of differences in treatment patterns for these groups. Diuretic use and patterns of binging/purging may also result in low potassium, and may have contributed to differences across groups.
Finally, when comparing the SUI + BPD group to those who died by suicide with another PD diagnosis, differences only emerged with respect to the PTSD phecode. Studies suggest that approximately 30% of those with BPD have comorbid PTSD (Pagura et al., Reference Pagura, Stein, Bolton, Cox, Grant and Sareen2010). A review by Frías and Palma (Reference Frías and Palma2015) suggests that rates of PTSD are not generally elevated among persons with BPD as compared to other personality disorder diagnoses. However, results from our sample indicate that PTSD was more common among persons with BPD who die by suicide as compared with both the other PD group and the SUI–BPD group. Future research should examine whether trauma exposure and PTSD symptoms interact with other suicide risk factors in the context of BPD to elevate risk of death. It is possible that the presence of BPD may compound symptoms of trauma so as to maximize their negative impact.
Our work is complementary to recent research by Xiao et al. (Reference Xiao, Bi, Yip, Cerel, Brown, Peng and Mann2024) which identified five latent classes in suicide decedents and provides further support for a multifaceted approach to suicide prevention. Here, we comprehensively assessed diagnosed health conditions among suicide decedents who had interactions with the healthcare system. For example, the Utah medical examiner reports (data similar to those included in the NVDRS/Xiao et al. study) indicate BPD among only eight individuals. However, the additional and complimentary diagnostic data gleaned from electronic heath records indicate that 379 individuals who died by suicide had a documented history of BPD diagnoses. It is possible that these individuals represent an additional subtype within class 1 ‘mental health and substance problems’ or class 2 ‘mental health problems’ identified by Xiao et al.; however, additional research is needed to investigate this hypothesis.
There are a number of study limitations that warrant discussion. First, although medical charts can and do provide essential and valid information, documented mental health diagnoses may not have been assigned by a mental health professional or following a rigorous diagnostic assessment. Emergency departments and medical providers are not typically trained on how to identify BPD or provide appropriate referrals (Cases, Lafont Rapnouil, Gallini, Arbus, & Salles, Reference Cases, Lafont Rapnouil, Gallini, Arbus and Salles2020). Recent work has also highlighted how stigma surrounding BPD can lead to medical neglect and misdiagnosis (see e.g. Masland et al., Reference Masland, Victor, Peters, Fitzpatrick, Dixon-Gordon, Bettis and Rizvi2023). Thus, there are likely many persons in the USMRS who may have met criteria for BPD or another psychiatric disorder yet were undiagnosed, and many persons who were incorrectly diagnosed (reflected in the lower prevalence rates of BPD and other PDs in the USMRS relative to the general population; Lenzenweger, Lane, Loranger & Kessler, Reference Lenzenweger, Lane, Loranger and Kessler2007). This may be particularly true for males with respect to BPD. Though prevalence rates of BPD in men and women are roughly equal (Lenzenweger et al., Reference Lenzenweger, Lane, Loranger and Kessler2007; Torgersen, Kringlen, & Cramer, Reference Torgersen, Kringlen and Cramer2001), approximately 75% of persons receiving the diagnosis are women (APA, 2022), indicating potential bias in sampling and diagnosis (Masland et al., Reference Masland, Victor, Peters, Fitzpatrick, Dixon-Gordon, Bettis and Rizvi2023). (Also of note, our BPD + suicide group is 32% male [n = 120]. This sample size may be insufficient to provide adequate statistical power for detecting associations with clinical diagnoses. With such a small cohort, we are likely underpowered to detect true associations that actually exist in the broader population.) ICD codes may also not be applied with specificity for billing in comparison to a comprehensive diagnostic interview – particularly when disentangling closely related psychopathology such as distinguishing PDs. Relatedly, many individuals may not have disclosed a history of self-inflicted injury to a medical provider nor are these behaviors universally screened for in all health care settings, and thus, such history may have gone undocumented among some percentage of our sample. Both of these phenomena would result in bias toward the null due to the inability to include true BPD cases and/or correctly document self-inflicted injury.
Relying on EHR data may also have resulted in incomplete coverage with respect to diagnostic data among older participants in the sample, as electronic records came in to use for the USRMS in 1996. The mean age for our identified groups is somewhat young, and thus, we likely capture EHR data across much of the adult life span of most of our participants. Nevertheless, results may be most relevant to younger cohorts.
Another limitation is that we did not investigate the timing of phecode documentation relative to participant death except for first diagnosis of BPD relative to death by suicide. Future research should examine baseline and time-varying indicators of risk longitudinally so as to gain a better understanding of both immediate and cumulative risk, as well as onset, persistence, and offset of medical and mental health diagnoses relative to suicide death. Generally, relying on medical records as the only data source also limits the amount of contextual information we can glean. Future research should combine this type of archival information with that obtained via other data collection methods (e.g. bloodspot data to assess genetic sources of risk available through the USMRS; prospective data acquired from family members). Data regarding marital status were less complete for control individuals in our sample, which may have contributed to observed differences in marriage rates between groups. Thus, this finding should be interpreted with caution. Finally, we would like to note limitations related to the generalizability of our findings. Although the USMRS provides an unparalleled resource, racial and ethnic diversity is limited in Utah (U.S. Census data, 2023) and our data reflect that. The patterns we observed may not generalize readily to non-White groups, which is especially unfortunate, as the impacts of stigma, discrimination, and marginalization impact the manifestation, assessment, conceptualization, and treatment of both psychopathology and medical illness (see e.g. Chen & Mallory, Reference Chen and Mallory2021).
Our findings indicate that history of engagement with self-injury, comorbidity with other psychiatric conditions, and engagement with maladaptive emotion regulation strategies may be particularly frequent among persons with BPD who die by suicide – even relative to other persons who die by suicide. Although our study was purely correlational in nature and we cannot speak to causality, results of the present study highlight several areas for further inquiry. Future directions for this work include examining patterns of health service contacts, more thoroughly characterizing patterns of comorbidity (e.g. examining the frequencies of specific combinations of comorbid diagnoses represented across groups), investigating patters of medication usage, and examining age-period-cohort effects with longitudinal modeling to understand changes over time.
Our data highlight that chronically suicidal people with BPD kill themselves at an elevated rate. Prevention efforts aimed at addressing self-harm by providing adaptive coping strategies may aid in reducing the burden associated with BPD, and potentially reduce risk for suicide among this population; whereas targeting physical pain and chronic medical conditions may be helpful among persons at elevated risk of suicide without BPD. Allocation resources to those with multiple co-occurring diagnoses (particularly PTSD) may be especially impactful. This work, in agreement with much previous research, elucidates the high degree of vulnerability among individuals with BPD and chronic self-harm, and the urgent need for increased understanding of the clinical and demographic nuances enhancing their risk. Continued work in this area will assist in improvements in risk detection and personalized treatments.
Supplementary material
The supplementary material for this article can be found at https://doi.org/10.1017/S0033291724002034.
Acknowledgements
Partial support for all datasets within the Utah Population Database was provided by the University of Utah Huntsman Cancer Institute and the Huntsman Cancer Institute Cancer Center Support grant, P30 CA2014 from the National Cancer Institute. Research was supported by the NCRR grant, ‘Sharing Statewide Health Data for Genetic Research’ (R01 RR021746, G. Mineau, PI) with additional support from the Utah Department of Health and Human Services and the University of Utah. We thank University of Utah Health Data Science Services for data and analytics support, and the University of Utah Pedigree and Population Resource and the University of Utah Health Enterprise Data Warehouse for establishing the Master Subject Index between the Utah Population Database and the University of Utah Health Sciences Center. We also thank Intermountain Healthcare for data access and data support. The support and resources from the Center for High Performance Computing at the University of Utah are also gratefully acknowledged.
Funding statement
This work was supported by the National Institute of Mental Health (H. C.: R01MH122412, R01MH123489; A. R. D.: R01MH123619; A. V. B.: R01ES032028).
Competing interests
None.


 Open access