


Introduction
The sex ratio at birth (SRB)Footnote 1 is defined as the number of live males born for every 100 females. The pioneer demographer John Graunt (1620-1674) was the first person to show that more males are born than females. Scottish physician and mathematician John Arbuthnot (1667-1735) thought that the larger number of males was statistically significant, and attributed it to divine providence. Some experts believe that this ratio is a natural biological constant situated around 105-106 (Livi Bacci, Reference Livi Bacci1993; Ein-Mor et al., Reference Ein-Mor, Mankuta, Hochner-Celnikier, Hurwitz and Haimov-Kochman2010). The PhD thesis by Chahnazarian (Reference Chahnazarian1986) used birth data from 24 European countries from 1962 to 1980, showing that the SRB varied from 105 to 107, with a median of 105.9. This latter figure has been taken as a reference in many studies, for example, to estimate the number of sex-selective abortions in certain countries (Coale, Reference Coale1991).
Since the 1930s, the SRB has attracted the interest of many researchers in the United States who have attempted to quantify it and explain the patterns of variation and determinants from various perspectives (Winston, Reference Winston1931; Russell, Reference Russell1936; Ciocco, Reference Ciocco1938; Berstein, Reference Berstein1948; Slatis, Reference Slatis1953; MacMahon and Pugh, Reference MacMahon and Pugh1953; Novitski, Reference Novitski1953; Myers, Reference Myers1954; Novitski and Sandler, Reference Novitski and Sandler1956; Tarver and Lee, Reference Tarver and Lee1968; Teitelbaum, Reference Teitelbaum1970; Teitelbaum and Mantel, Reference Teitelbaum and Mantel1971; Erickson, Reference Erickson1976; James, Reference James1984; Khoury et al., Reference Khoury, Erickson and James1984; Ruder, Reference Ruder1985 and 1986; Marcus et al., Reference Marcus, Kiely, Xu, McGeehin, Jackson and Sinks1998; Mathews and Hamilton, Reference Mathews and Hamilton2005; Castor et al., Reference Castor, Smyser, Taualii, Park, Lawson and Forquera2006; Davis et al., Reference Davis, Webster, Stainthorpe, Chilton, Jones and Doi2007; Branum et al., Reference Branum, Parker and Schoendorf2009; Bruckner et al., Reference Bruckner, Catalano and Ahern2010; Meyers, Reference Meyers2012; Ferrell, Reference Ferrell2013; Grech, Reference Grech2016, Reference Grech2017, Reference Grech2018 and 2019; Long et al., Reference Long, Chen, Larsson and Rzhetsky2021). Many variables have been analysed by these authors at different historical moments, sometimes yielding contradictory results: socioeconomic status, race, ethnicity, intrauterine mortality, parental age and educational level, birth order, legitimacy, regional differences, climate, latitude, seasonal variation, solar radiation, mortality and fertility rates, terrorist attacks, wars, maternal nutrition, etc. Researchers have tried to associate differences in the SRB in the United States and other countries with dozens of factors: biological factors (sperm characteristics, female hormone levels at the moment of conception), behavioral factors (coital frequency, stress levels, tobacco consumption), environmental factors (radiation, pollutants in water supply) (James and Grech, Reference James and Grech2017; Chahnazarian, Reference Chahnazarian1988; Fellman, Reference Fellman2019).
The main difficulty posed when studying the SRB is that the statistical analyses show that for comparative purposes very large databases need to be used (Fellman and Eriksson, Reference Fellman and Eriksson2011). Guilmoto (Reference Guilmoto2015: 189) indicates that the precision of measurements of the sex ratio is subject to the effects of a binomial law that depends on the inverse of the square root of the number of observations. That is, the greater the number of cases available (births), the lower the variation.
The secondary sex ratio can also vary over time. The length of the study period is crucial for secular trend analyses. It is likely that some of the contradictory results obtained by Chahnazarian (Reference Chahnazarian1986), Feitosa and Krieger (Reference Feitosa and Krieger1992) and James and Grech (Reference James and Grech2017) could be due at least partly to the fact that the study periods were not long enough. Many of the studies on the SRB in the United States mentioned above were based on short time spans and used a small number of cases. Moreover, many of these studies adopt a univariate approach in their analyses. The present study uses a database of 199 million records of births in the United States in the period 1968-2019Footnote 2 . Our aim is to analyze the relationship between the SRB and some of the factors mentioned above from a multivariate perspective in order to confirm or contradict the results published to date. Our study may afford a deeper understanding of the causal mechanisms through which sociodemographic factors can affect the SRB.
Historical development of the sex ratio at birth in the United States
Figure 1 shows the historical development of the SRB in the United States for different population groupsFootnote 3 . Except for the data concerning the population as a whole, the other figures represent only those births for which both parents are of the same race or ethnic group. The evolution of the SRB for the total population and for White people (the broad majority of the population) shows a slow, slightly fluctuating downward trend. By contrast, that for the Black, American Indians and Alaska Natives reveal a considerable increase in the SRB from the mid-20th century onwards, although in the last few years a downward trend also seems to have set in. The initial fluctuations found in the Asian group were followed from the mid-1980s onwards by very constant SRB values (around 107).
Sex ratio at birth in the United States according to race (both parents of the same race, except the “All” group). 5-years-moving-average.
Note: Data predating 1968 were obtained from Hamilton et al. (Reference Hamilton, Lu, Chong, Rossen, Lipphardt and Keralis2020) and Ciocco (Reference Ciocco1938).
AIAN: American Indian and Alaska Native

The most striking feature in Figure 1 is precisely the size of the differences between population groups. The Asian group has much higher values than Black and American Indian and Alaska Native (AIAN) populations.
Even within each racial group there is considerable diversity. Within the Asian group, the Chinese, Filipino and Korean populations have higher values than the Vietnamese, Asian Indian and JapaneseFootnote 4 . Similarly, not all Whites have the same values. While non-Hispanic Whites have higher SRBs, Mexican Whites have lower ones. The data suggest that the slight downward trend noted in the “All” and “White” groups is likely to be related to the growing proportional weight of Hispanics (particularly Mexicans) and Blacks in the US populationFootnote 5 . Analysis of Figures 1 also allows us to confirm that the SRB in White non-Hispanic, Mexican White and All Asian has remained practically stable over the last 40 years.
Figure 2 shows the evolution of the SRB in the United States compared to other western countries. Although the United States had some of the highest values for the first three decades of the 20th century, since the mid-20th century it has had some of the lowest. The growing weight of the Hispanic and Black population has clearly had the effect of bringing down the SRB for the population as a whole.
Sex ratio at birth in several western countries (5-years-moving-average).
Source: The data were obtained from the National Statistical Institutes for the countries concerned, all of which can be accessed by Internet.

Interracial crosses
Given that the SRB is dependent on maternal age, it may be influenced by the proportional distribution of liveborn children according to the mother’s age. To offset the effect of the different distribution in different population groups, we applied a standardization procedure. Direct standardization consists of applying the same proportional distribution of births according to the mother’s age to the different SRBs in different maternal age groups. This direct standardization is also known as “population-type standardization”, because it uses the distribution of births in one population as the standard or model population. The model population that we chose for this study is the proportional distribution of births in the USA between 1968 and 2019 according to the mother’s age. The proportional weights for the different standardizations used in the present study are: age <20: 0.086; 20-24: 0.233; 25-29: 0.280; 30-34: 0.250; 35-39: 0.123; 40-44: 0.026; >44: 0.002.
Table 1 and Figure 3 show the SRB for different combinations of races and ethnic groups in the United States. Asians (with the sole exception of the Japanese) have the highest values; Whites have an intermediate position, and Black and AIAN populations have the lowest. The difference between the highest and lowest groups is greater than 5 points. It is known that some immigrant groups from Asia (Asian Indian, Chinese and Korean) practice selective abortion of females, and so we should bear in mind that part of these high SRB values is caused by deliberate elimination of female fetuses (Egan et al., Reference Egan, Campbell, Chapman, Shamshirsaz, Gurram and Benn2011; Puri et al., Reference Puri, Adams, Ivey and Nachtigall2011; Howell et al., Reference Howell, Zhang and Poston2018).
Standardized and non-standardized sex ratio at birth by parents’ race. United States, 1968-2019

Note: WHNM: White Hispanic non-Mexican; AIAN: American Indian and Alaska Native; NH: non-Hispanic; W.: White.
Standardized sex ratio at birth in interracial crosses (1st female, 2nd male).
Note: AIAN: American Indian and Alaska Native; NH: non-Hispanic; W.: White.
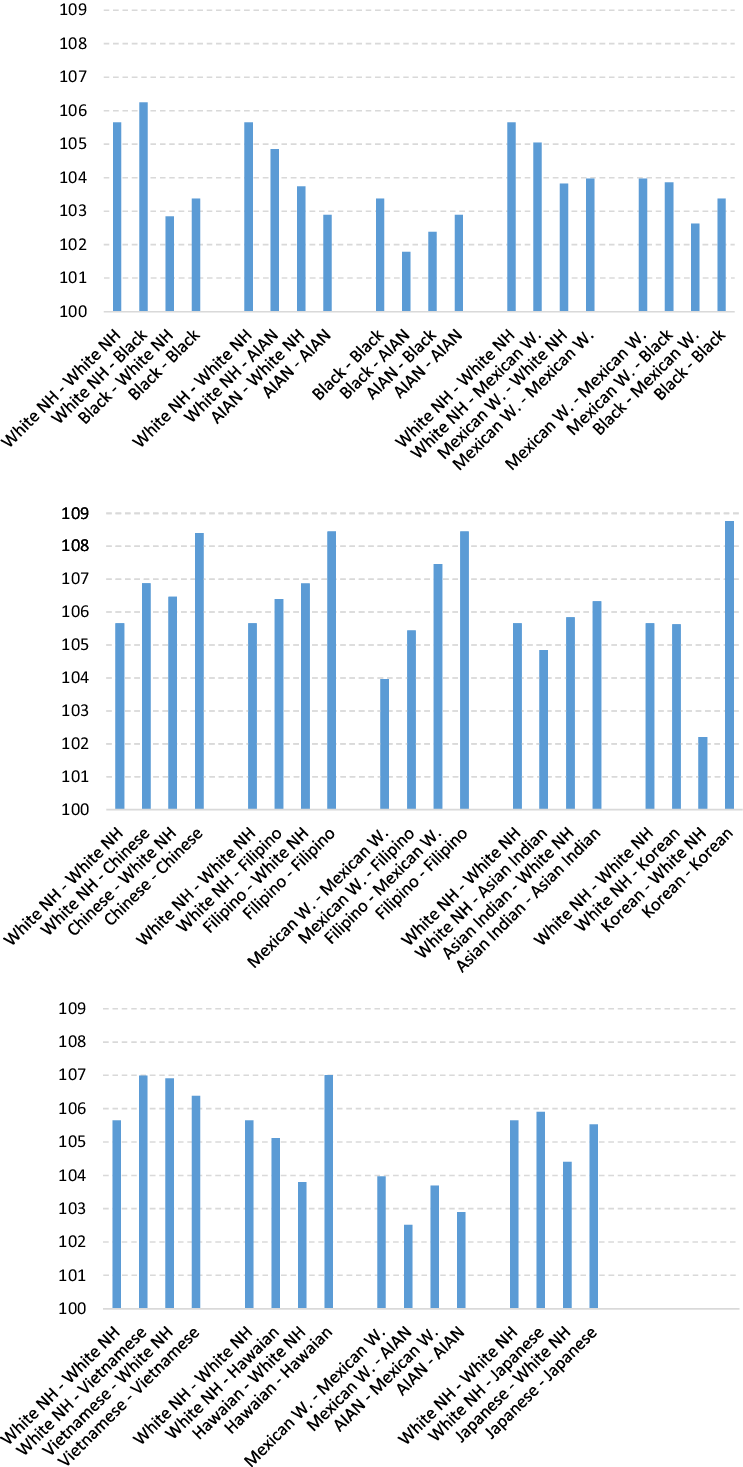
Observation of the different racial crossings brings to light that when someone belonging to one racial/ethnic group with high SRB values has children with someone from a group with lower values, in most cases (19 out of 28 combinations analyzed, 68%) the SRB declines.
In their study of the United States, Khoury et al. (Reference Khoury, Erickson and James1984) concluded that the differences in the SRB for crossing between White and Black, and between White and AIAN, are due to the effects of the father’s race rather than the mother’s. Figure 3 shows us that when a race with high SRB values is mixed with one of lower values, normally (though not always) the SRB is higher when it is the man who belongs to the first of these groups than when it is the woman.
All of this suggests that there may be some kind of biological determinant associated with race or ethnicity that has a strong influence on the SRBFootnote 6 . In view of the striking differences observed, we consider that it is essential that analyses of the SRB in countries with racial/ethnic diversity should always take into account the population subgroups in order to offset the variations resulting from the changing proportional weight of each community.
Mean age at motherhood and fatherhood
Parental age was one of the first demographic factors to be taken into account in the studies performed in the early 20th century. Sperm quality, maternal hormone levels, and the frequency of coitus all vary according to the age of the parents and the birth order of their children, and may thus affect the SRB. The survival rate of the fetus during gestation also varies according to the mother’s age, and could affect the SRB.
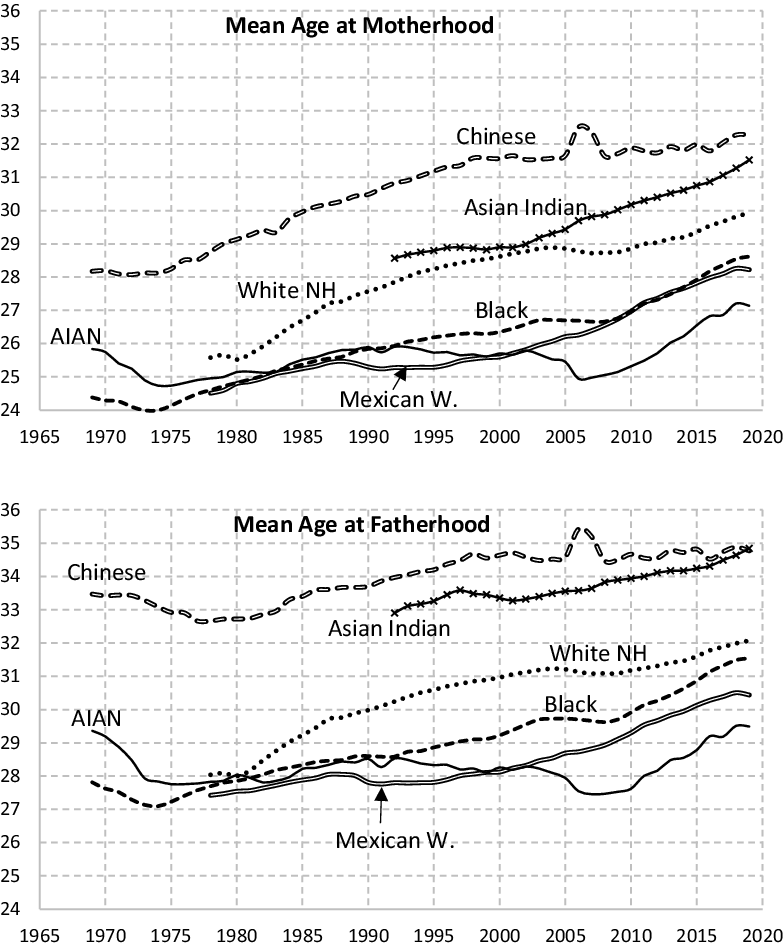
Mean age at motherhood (MAM) and fatherhood (MAF) for all population groups in the United States has been rising since the mid-1970s (Figure A1 in the Appendix). The decline in fertility in the United States over the last 50 years was accompanied by a significant rise in the age at which women have their first child (Guzzo and Payne, Reference Guzzo and Payne2018). People have fewer and fewer children, and they have them when they are older. In all cases we have analized, we found that the younger the parents, the higher the SRB (Figure A2 and A3 in the Appendix).
The age of mother and father are highly correlated with each other, since most women have men of similar age as reproductive partners. Table 2 shows that over half of the children born in the United States in the period 1968-2019 had parents whose absolute difference in age was 2 years or less. Almost three quarters of the children born had parents whose absolute age difference was 4 years or less.
Percentage distribution of births in the United States (1968-2019) classified according to absolute difference between ages of parents

Given the strong correlation between the age of the parents, it is hard to conclude whether it is the mother’s age or the father’s age, or perhaps both, that really has a bearing on the SRB. To assess the contribution of each sex, it is necessary to evaluate the SRB keeping the other value constant. This is done in Figures 4 and 5. Figure 4 shows the SRB levels maintaining the maternal age as a constant and varying the age difference between parents. What we can see is that for all the maternal age groups, the older their male partners are, the lower the SRB is. This is true throughout the population as a whole, and in each population subgroup.
Sex ratio at birth according to maternal age group and age differences between father and mother, Unites States, 1968-2019 (both parents of the same race, except the “All” group).

Sex ratio at birth according to paternal age group and age differences between father and mother, United States, 1968-2019 (both parents of the same race, except the “All” group).

The same can be seen in Figure 5. When the father’s age is constant, we can observe that the younger the female partners are, the higher the SRB. We can therefore conclude that both the mother’s age and the father’s age have a moderate impact on variations in the SRB.
Previous studies that analyzed this variable failed to reach a consensus concerning the effect of maternal and paternal age on the SRB (Russell, Reference Russell1936; Ciocco, Reference Ciocco1938; McMahan, Reference McMahan1951; MacMahon and Pugh, Reference MacMahon and Pugh1953; Novitski and Sandler, Reference Novitski and Sandler1956; Novitski, Reference Novitski1953; Myers, Reference Myers1954; Novitski and Kimball, Reference Novitski and Kimball1958; Tarver and Lee, Reference Tarver and Lee1968; Teitelbaum and Mantel, Reference Teitelbaum and Mantel1971; Erickson, Reference Erickson1976; Ruder, Reference Ruder1985). Although most of them indicated a negative effect of maternal and paternal age on the SRB, some did not detect any effect. Some studies even found a bell-shaped effect.
Birth order of children
Birth order is another of the variables addressed in the first studies from the early 20th century as possible factors conditioning the SRB. Figure 6 shows that, as is logical, the higher the birth order, the higher the mean age of the mother: mothers always have their first children at an earlier age than their later children. We can also see that the mean age at motherhood for all birth orders has become higher since the early 1970s.
Mean age at motherhood according to birth order (all births, United States, 1968-2019).

The vast majority of early studies analyzing birth order and SRB found a negative relationship between the two (Chahnazarian, Reference Chahnazarian1988). If the parents are younger at the birth of the first child (Figure 6) and younger parents have a higher proportion of males than older parents do, this negative relationship is logical. However, these early studies presented their results on birth order and SRB without controlling for the age of the mother, and so in reality they do not reveal whether the decline in SRB is caused by the simple fact indicated above that the parents of children of higher birth order (i.e. second, third or fourth children) are older than those of lower birth order children (i.e. firstborn), or by some factor related exclusively to the birth order itself, that is, the specific fact of already having had more or fewer children.
To resolve this problem, we have to isolate the effect of maternal age and establish whether the SRB varies according to some factor related to having had more or fewer children previously. It is important to clarify this, since the proportional weight of births of different orders has changed over time. Figure 7 clearly illustrates how, at the end of the 1940s, third and higher birth orders gained proportional weight (coinciding with the so called baby boom), which resulted in a significant reduction in the SRB. By contrast, when the proportional weight of the first and second births increased in the 1960s, the SRB rose notably.
Evolution of the percentage distribution of births according to order (left axis) and sex ratio at birth (5 years-moving-average) (right axis) in the United States (all births).
Note: Data about birth order before 1968 were obtained from the U.S. Department of Health and Human Services (1984).

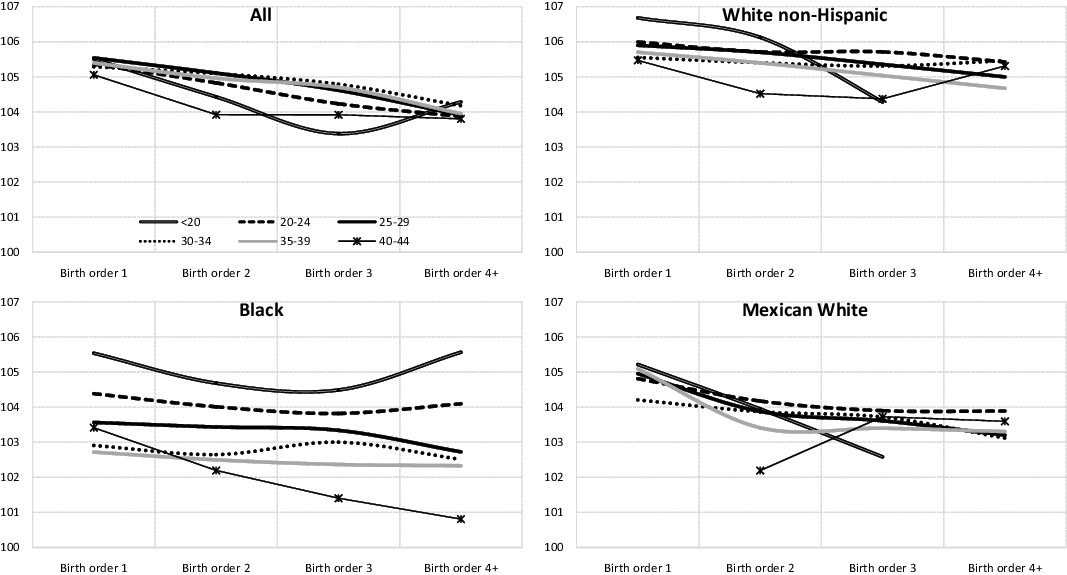
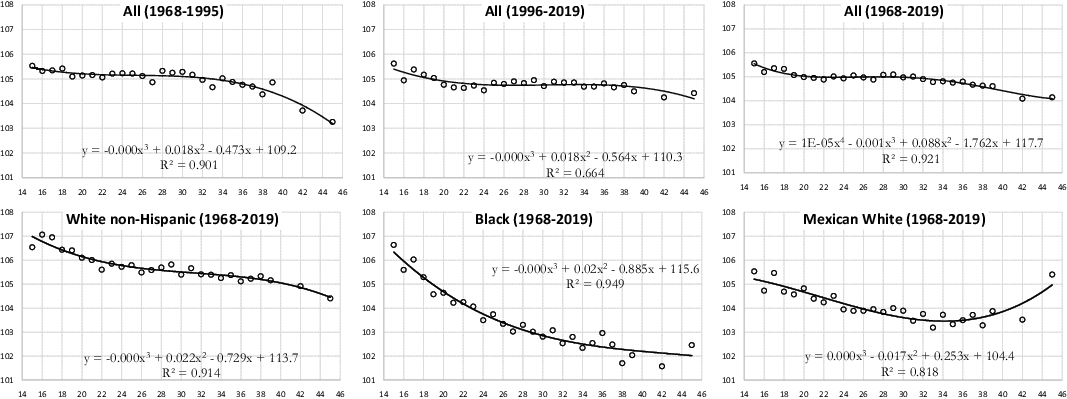
Figure 8 shows the variation in SRB according to birth order, controlling for the mother’s age. Both for the “All” group and for the different racial/ethnic subgroups analyzed, we can observe that when the mother’s age is constant, the SRB declines as birth order rises. That is, the more children the mother has already had, regardless of her age, the lower the probability that her next child will be a boy.
Sex ratio at birth according to maternal age and birth order, United States, 1968-2019 (both parents of the same race, except the “All” group).
Figures 9 and 10 also show all births in the United States during the period 1968-2019 classified according to maternal age and birth order. In the first, we can clearly observe that the SRB falls as the birth order rises. The second shows us that in all maternal age groups analyzed, the lower the birth order, the higher the SRB. In short, these two figures confirm the results indicated above from a different perspective: the birth order influences the SRB, regardless of the mother’s age.
Sex ratio at birth according to maternal age and birth order. United States, 1968-2019.
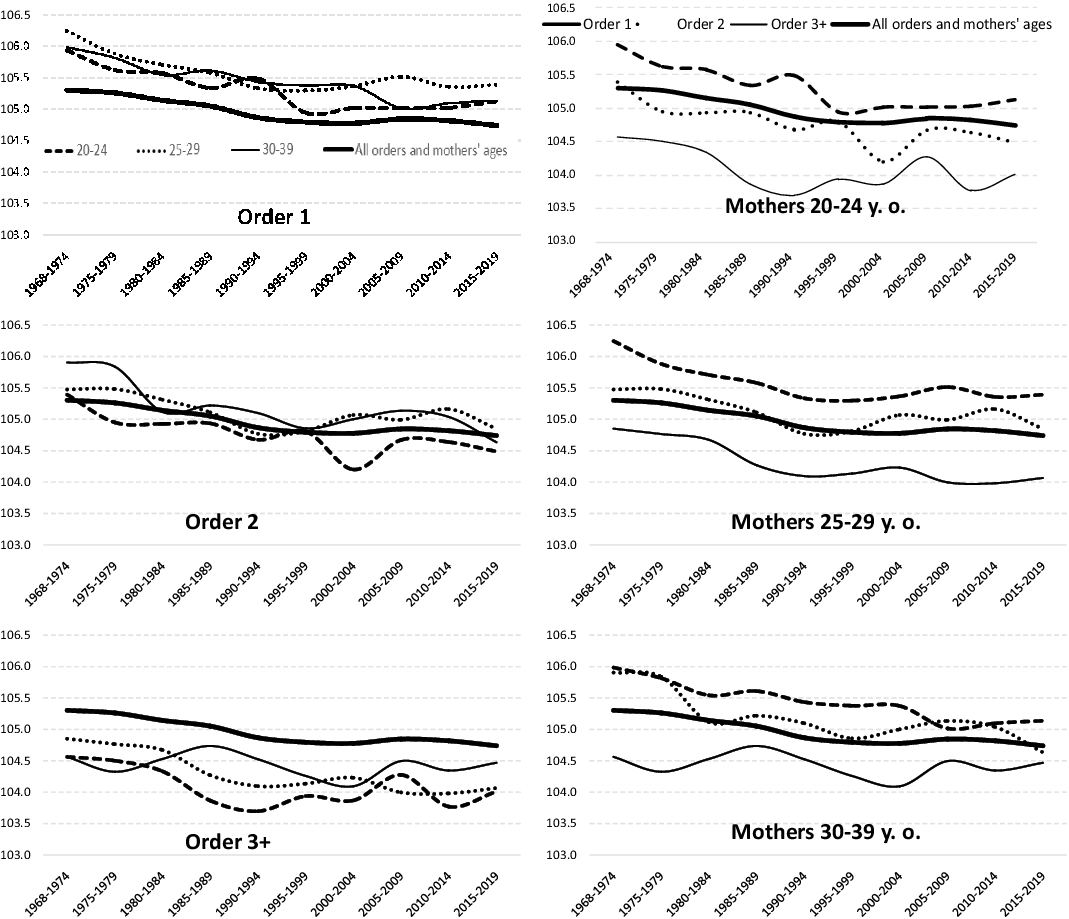
Sex ratio at birth according to birth order and maternal age. United States, 1968-2019.

Changes in parental age patterns
Since the age of both parents has a significant effect on the SRB (particularly in the Black and Mexican White populations), it could be interesting to analyze changes in parental age patterns. The mean age of motherhood and fatherhood has increased in all racial/ethnic groups since the mid-1970s. Figure 6 confirms that the mean age of motherhood has also increased at all birth orders. At the same time as these two processes were taking place, the mean age difference between mother and father was also decreasing (Figure 11), especially in the Asian Indian and Chinese groups. Once again, we can appreciate the notable differences between the population groups.
Evolution of mean age difference between father and mother for births in the United States, 1968-2019. Both parents of the same race.
Note: AIAN: American Indian and Alaska Native; NH: non-Hispanic; W.: White.

In the Black population there was a reduction in the mean age difference between father and mother until the mid-1990s. Later, however, this increased again, and since 2005 it has remained constant at the levels found before the first decline. The White non-Hispanic and Mexican White groups are those with the smallest age differences between parents. These differences have continued to decrease since the mid-1970s.
Figure 12 shows the age difference between parents classified according to the mother’s age and the racial group. It is clear that, in all population groups, the age difference between younger parents is much larger than that between older parents (this is particularly true for the Asian Indian and Chinese groups).
Mean difference in age between father and mother at the moment of birth in the period 1968-2019 in the United States, according to mother’s age. Both parents of the same race.
Note: NH: non-Hispanic.

Why is the mean age difference between father and mother smaller as age rises? The most likely explanation is that the quality of sperm deteriorates as men grow older. The fact that older mothers have children with men closer to their own age (or even with younger men) than women at the start of their reproductive life is due mainly to the fact that the quantity and quality of spermatozoids among western men are declining, and this probably affects older men more (Levine et al., Reference Levine, Jørgensen, Martino-Andrade, Mendiola, Weksler-Derri, Mindlis, Pinotti and Swan2017). It is important to point out that among the Black population, the reduction in the mean age difference between father and mother is much less pronounced than for the other population groups.
Standarization of the sex ratio at birth, according to maternal age
We know that, as the age of both parents rose, the SRB declined (especially in the Black and Mexican White groups). Also, we know that the mean age at motherhood and fatherhood not only varies widely across different population groups, but has also increased greatly since the 1970s. It is therefore possible that some of the variations observed in the SRB could simply be due to the changes in parental age. It would thus appear reasonable to calculate the standarized SRB values, that is, keeping the proportional weights of the SRB for each age subgroup.
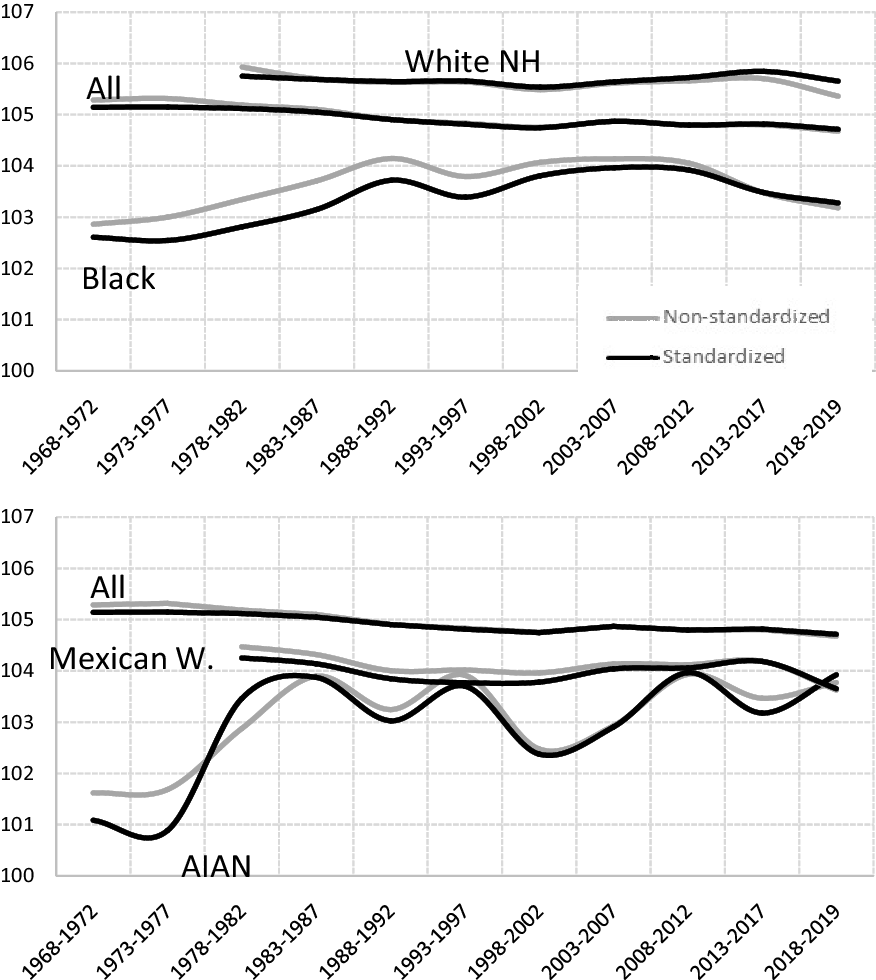
In both Table 1 and Figure 13, the standardized and non-standardized SRB values are shown. In Figure 13 we can see how, as would be expected, the discrepancies between the two values are much greater in the Black and Mexican White population than in the White non-Hispanic group: Black and Mexican White people have children at younger ages than White non-Hispanic people, and there is a sharper decline in the SRB values as the parental age rises. The high stability in the standardized SRB values in the White non-Hispanic and total population is worthy of note.
Standardized and non-standardized sex ratio at birth (both parents of the same race, except the “All” group).
Note: AIAN: American Indian and Alaska Native; NH: non-Hispanic; W.: White.
Solar radiation and vitamin D
Some recent medical research points to the positive relationship between maternal blood vitamin D levels before conception and the SRB values (Purdue-Smithe et al., Reference Purdue-Smithe, Kim, Nobles, Schisterman, Schliep, Perkins, Sjaarda, Freeman, Robinson, Radoc, Mills, Silver and Mumford2019 and 2021). Vitamin D is synthesized in the skin from cholesterol thanks to a chemical reaction that is naturally activated by type B ultraviolet light (UVB) from sunlight. Exposure to sunlight is not the only factor that influences blood vitamin D levels. Others that can also have a determining effect are: skin pigmentation, skin coverage, malabsorption, dietary choices, adiposity, supplements, disease, age and lifestyle. Darker skin interferes with cutaneous vitamin D synthesis. Black people may require 6 times the amount of UV radiation needed to produce a similar serum vitamin D concentration in a white person. This would explain why adults with darker skin tend to have a higher prevalence of vitamin D insufficiency (Tangpricha and Khazai, Reference Tangpricha and Khazai2020).
According to Purdue-Smithe et al. (Reference Purdue-Smithe, Kim, Nobles, Schisterman, Schliep, Perkins, Sjaarda, Freeman, Robinson, Radoc, Mills, Silver, Ye and Mumford2021: 3), “among women attempting to conceive, vitamin D sufficiency versus insufficiency during preconception is associated with higher probability of carrying and giving birth to a live-born male infant […] No associations were observed for vitamin D status and female live birth, suggesting that sufficient preconception levels of vitamin D may ameliorate an inflammatory process that is disproportionally harmful to male conceptuses”.
Our research hypothesis is that, if other conditions are assumed to remain the same, women living in the regions of the United States with higher solar radiation will have higher vitamin D levels in their blood, and therefore the SRB will be higher than in regions with less radiation. To test this hypothesis, we contrasted the figures for two groups of states in 1968-2019 since, according to the United States National Solar Radiation Data Base, the states in the South and South East receive the most Global Horizontal Irradiance (Senguptaa et al., Reference Senguptaa, Xie, Lopez, Habte, Maclaurin and Shelby2018):
-
a) Southern states: Arizona, California, Florida, Nevada, New Mexico, Texas and Utah.
-
b) Northern states: Alaska, Maine, Michigan, Minnesota, Montana, New Hampshire, New York, North Dakota, Pennsylvania, Vermont, Washington and Wisconsin.
What we found is that (1) a higher proportion of babies in the southern United States are males, (2) a higher proportion of babies born in the summer months (for which the period before conception was also in the summer months) are male; and (3) this effect seems stronger among black and Mexican people than it is among White, Asian or Chinese people (Figure A4 and Tables A1 and A2 in the Appendix). We can therefore conclude that, as Purdue-Smithe et al. (Reference Purdue-Smithe, Kim, Nobles, Schisterman, Schliep, Perkins, Sjaarda, Freeman, Robinson, Radoc, Mills, Silver, Ye and Mumford2021) indicate, maternal vitamin D sufficiency mitigates maternal inflammation and has a very positive effect on the survival of male foetuses.
Temperatures
Some studies have linked the periods with higher temperatures to raised SRB levels (Lerchl 1999; McLachlan and Storey Reference McLachlan and Storey2003; Catalano et al., Reference Catalano, Bruckner and Smith2008; Helle et al., Reference Helle, Helama and Jokela2008). From Figure 14 we can see that there is no relationship between the developments of these two indicators for the different population groups in the United States. Although during the period 1960-2008 there was indeed some parallel growth in the SRB among the Black population and the mean temperatures, during the 2008-2017 period this relationship was reversed.
Evolution of sex ratio at birth among different racial/ethnic groups (both parents of the same race) (left axis) and the mean annual temperature in ºC in the United States (right axis). 5-years-moving-average.
Note: Temperature data from the United States were obtained from Lai and Dzombak (Reference Lai and Dzombak2019).

Table 3 compares the SRB values for the hottest and coldest years in the period 1968-2019. For White non-Hispanic and Mexican White, the differences observed between the two periods are negligible. In the Black group the warmest years correspond to higher SRB levels, but in view of the observations in Figure 14, it would be risky to assume a causal relationship.
Standardized sex ratio at birth in the twelve warmest and coldest years in the period 1968-2019. Both parents of the same race

Hottest years: 1987, 1990, 1991, 1998, 1999, 2006, 2007, 2012, 2015, 2016, 2017 and 2018. Coldest years: 1968, 1969, 1970, 1972, 1976, 1978, 1979, 1982, 1985, 1993, 1996 and 1997.
Pollution levels
Various studies have indicated that the rising levels of environmental chemicalization could be responsible for the recent decline in the SRB in western countries (Vartiainen et al., Reference Vartiainen, Kartovaara and Tuomisto1999; Jongbloet et al., Reference Jongbloet, Roeleveld and Groenewoud2002; Weisskopf et al., Reference Weisskopf, Anderson and Hanrahan2003; Terrell et al., Reference Terrell, Hartnett and Marcus2011). To test for the effect of pollution on the SRB in the United States, we used the population size of the counties in which the mothers were resident as a proxy variable. We assumed that the pollution level in counties with over one million inhabitants is higher than in those with fewer than 250,000 inhabitants. Table 4 shows that, although for the total population and the Black and Mexican White populations the most populated counties are indeed those with the lowest SRB, the same does not hold for the most numerous racial group, namely the non-Hispanic Whites. These data therefore do not allow us to draw a clear conclusion about the possible impact of pollution levels on the SRB.
Standardized sex ratio at birth according to population of county where mother resides. United States, 1968-2019. Both parents of the same race, except the “All” group

Marital status
A review of population-based studies concluded that maternal stress is a factor that increases the risk of natural abortion, low birth weight, premature birth and infant mortality (Witt et al., Reference Witt, Litzelman, Cheng, Wakeel and Barker2014). Other studies have shown that stress-related public phenomena (earthquakes, terrorist attacks, shoot-outs, famines, poor working conditions, etc.) may increase the risk of natural abortions, and particularly of the weaker male fetuses, which would lower the SRB (Catalano et al., Reference Catalano, Bruckner, Gould, Eskenazi and Anderson2005 and 2012; Catalano, Yorifuji and Kawachi, Reference Catalano, Yorifuji and Kawachi2013). At the same time, many studies have pointed to the effect that socioeconomic factors have on the SRB. Ever since the earliest studies carried out in the 1930s, it has been thought that socioeconomic stress could be related to lower SRB levels (Winston, Reference Winston1931; Teitelbaum and Mantel, Reference Teitelbaum and Mantel1971; Grech, Reference Grech2018).
We can assume that pregnant Non-married women are more likely to suffer high stress levels and also experience greater socioeconomic difficulties. Pregnant married women have the support and protection of their husbands and are thus exposed to lower stress levels, and are less likely to suffer from anxiety, unhappiness, fatigue or exhaustionFootnote 7 . We classified births according to the mother’s marital status (married and Non-married) and calculated the standarized SRB. The results can be seen in Table 5. Contrary to what we might think, the married women in all population groups had the lowest SRB values. Therefore, if it were true that pregnant Non-married women have higher stress levels and socioeconomic difficulties, we would have to conclude that these situations have the opposite effect on the SRB from that detected in previous studies.
Standardized sex ratio at birth by mother’s marital status (both parents of same race). United States, 1968-2019

Note: AIAN: American Indian and Alaska Native.
We could argue that the data in Table 5 are affected by the fact that many young mothers marry after having one or more children, that is, they have their first child when unmarried and later children when married. Since younger women generally have a higher SRB, there would be a bias in favor of Non-married women. Table 6 shows the values for the SRB by mother’s marital status and birth order. We can see that, even when we control for birth order, the Non-married women have a higher SRB than their Married counterparts. That is, when we control for the mother’s age and birth order, the Non-married women have more male children than the Married ones.
Sex ratio at birth by mother’s marital status and birth order (both parents of same race). United States, 1968-2019
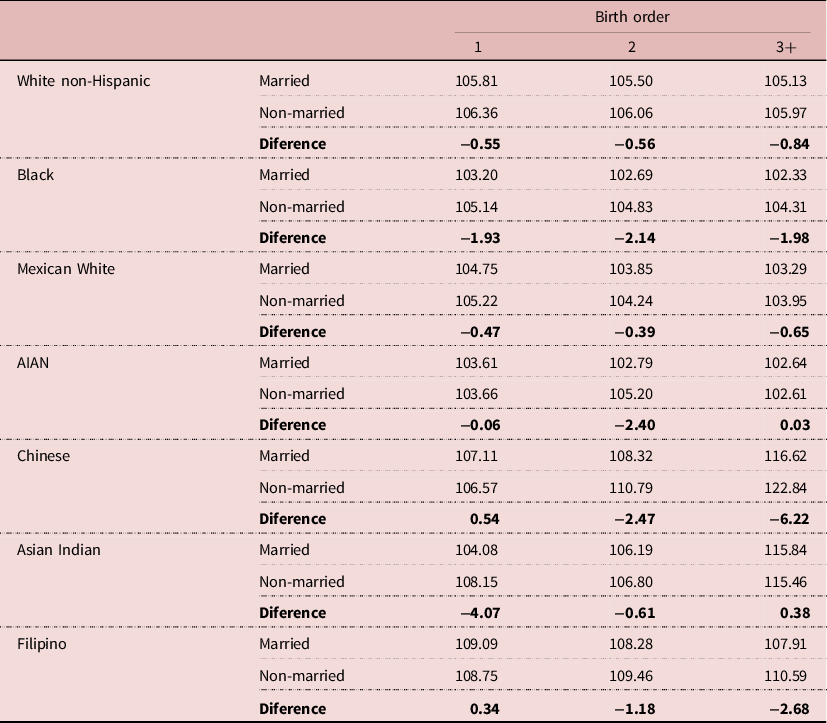
Note: AIAN: American Indian and Alaska Native.
Weeks of gestation
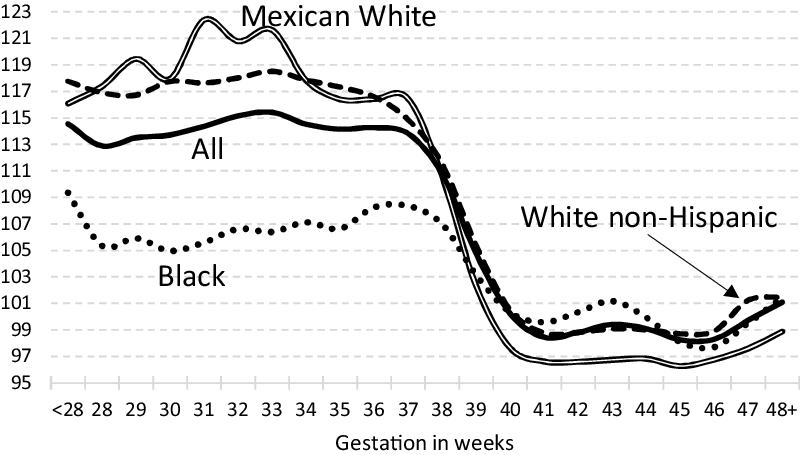
Previous authors are in disagreement about the relationship between the gestation period and the SRB. While James (Reference James1994 and 2003) and Cagnacci et al. (Reference Cagnacci, Renzi, Arangino, Alessandrini and Volpe2003) consider that the longer the gestation period, the higher the SRB, Orzack et al. (Reference Orzack, Stubblefield, Akmaev, Colls, Munné, Scholl, Steinsaltz and Zuckerman2015) propose the opposite. The data presented in Figure 15 leave little room for doubt: among the more premature children (born at less than 37 weeks) there is a notably higher SRB than among those born after 40 weeks. From weeks 37 to 40 there is a sharp decline in the SRB. Even though the same trend is perceptible among the different races analyzed, it is striking that the racial differences among the most premature children are inverted for those born after 40 weeks. In the first group it is the Mexican Whites and the non-Hispanic Whites who have the highest values, while the Blacks have the lowest. By contrast, for those born after 40 weeks, the opposite racial differences are observed.
Sex ratio at birth according to weeks of gestation (both parents of the same race, except the “All” group). United States, 1968-2019.

Conclusions
The main conclusion that can be drawn from the data analyzed (nearly 199 million birth records) is that the variable that influences the Sex Ratio at Birth (SRB) most is race/ethnicity, as Asians have the highest values and Black and AIAN the lowest. When parents are from different racial/ethnic populations, the SRB of their offspring generally occupies an intermediate position between those for the parents’ groups. We consider that, in view of the strong contrasts in SRB among different racial/ethnic groups, each population group should be examined individually. The changes in the proportional weight of the different racial/ethnic groups in one country may considerably modify the SRB in the total population.
Perhaps the second most significant conclusion is the fact that when we divide the population into subgroups, we observe a striking stability in the evolution of the SRB values with the only exception of the Black and AIAN groups. The downward trend observed in the SRB across the total population can largely be explained by the changing racial/ethnic make-up that the society of the United States has undergone in the last 60 years. Intrapopulation variation is lower than that observed between racial/ethnic groups.
We have also shown that both the mother’s and father’s age influence the SRB, albeit only slightly. The younger the parents, the higher the SRB. At the same time, we have confirmed that the birth order also has a bearing on the SRB, regardless of the mother’s age: the higher the birth order, the lower the SRB.
Our analysis of the changes in parental age suggest that: a) the trend towards older motherhood/fatherhood extends across all population groups, b) differences in parental age are reduced as the mother’s age rises, almost certainly due to the loss of semen quality as the male partner grows older; c) when the SRB is standardized according to the mother’s age, the changes are relatively small, except in the case of the Black population.
We tested the role that solar radiation (and the production of vitamin D in blood) might have in determining the SRB: practically all the population groups analyzed living in the south of the United States (and therefore exposed to greater solar radiation) have a higher proportion of male offspring than the people of the same race/ethnicity living in the north. Similarly, SRB levels were higher for children conceived in the months in which their mothers had accumulated higher blood vitamin D levels. We also detected a negative relationship between length of the period of gestation and the SRB.
We were unable to detect any relationship between the SRB and changes in temperature or urbanization level. Contrary to expectations, Non-married women in all the racial/ethnic groups analyzed had higher SRB levels than married women.
The increase in the SRB among the Black and AIAN populations in the second half of the 20th century remains to be explained. Møller (Reference Møller1996) and Fellman and Eriksson (Reference Fellman and Eriksson2011) consider that the increase in the SRB observed in Nordic countries in the period 1750-1950 was due to an improvement in socioeconomic conditions, and relate this to the decline in the Stillbirth Rate and the sex ratio of stillbirthsFootnote 8 . It would be useful to research whether there is any connection between the rise in the SRB among the Black population and the decrease in the rates of stillbirth at 20 or more weeks of gestation between 1981 and 2000 (Ananth et al., Reference Ananth, Liu, Kinzler and Kramer2005).
Racial differences in infant mortality were very pronounced even as recently as 2014-2016. Black non-Hispanics and AIAN populations had higher infant mortality, 11.2‰ and 8.5‰, respectively, while for Asian Indian, Vietnamese, Japanese, Korean and Chinese populations the rates were lower than 4‰ (Singh and Yu, Reference Singh and Yu2019). Are the racial/ethnic differences observed in the infant mortality rates also reflected in the rates of stillbirth? Does the sex ratio of stillbirths vary according to race/ethnicity? How do the different levels of fetal mortality for each sex affect the SRB? A detailed study of the sex ratio at conception and sex-specific intrauterine mortality differentials for each of the large population groups in the United States might possibly help us to understand why the SRB followed a different course among Black and AIAN populations in the second half of the 20th century in comparison to the other population groups. Although this lies beyond the scope of the present article, we consider that this question would be worth pursuing.
Conflicts of interest
The author has no conflicts of interest to declare.
Funding
This study was supported by the Ministerio de Economía, Industria y Competitividad, CSO2017-83290-P (Spain)
APPENDIX. Factors influencing the sex ratio at birth in the United States from a historical perspective
Mean age at motherhood (MAM) and fatherhood (MAF) by race in the United States. Both parents of the same race.
Note: AIAN: American Indian and Alaska Native; NH: non-Hispanic; W.: White.
Sex ratio at birth according to mother’s age, United States (both parents of the same race, except the “All” group).
Sex ratio at birth according to father’s age, United States, 1968-2019 (both parents of the same race, except the “All” group).

Deviation from the mean of sex ratio at birth for each month, according to parents’ race/ethnicity (both parents of the same race, except the “All” group). United States, 1968-2019.

Standardized sex ratio at birth according to geographical area and race (both parents of the same race). United States, 1968-2019

Note: AIAN: American Indian and Alaska Native; NH: non-Hispanic; W.: White.
Sex ratio at birth according to month of birth and parents’ race/ethnicity (both parents of the same race, except the “All” group). United States, 1968-2019

Note: AIAN: American Indian and Alaska Native.


 Open access