


Introduction
The Greenland Ice Sheet (GrIS) has been losing mass at an accelerating rate due to a combination of increases in solid ice discharge from marine-terminating glaciers and surface meltwater runoff since the 1990s (Meredith and others, Reference Meredith and Pörtner2019; King and others, Reference King2020; Shepherd and others, Reference Shepherd2020). The rate of mass loss due to increased ice discharge greatly depends on glacier velocity changes. Ice velocities of Greenland glaciers are known to vary at different spatiotemporal scales due to a mixed influence of changing atmospheric, oceanic and local geometric conditions (Khan and others, Reference Khan2014). These influencing factors include summertime production of surface meltwater (Bevan and others, Reference Bevan, Luckman, Khan and Murray2015; Kehrl and others, Reference Kehrl, Joughin, Shean, Floricioiu and Krieger2017; Rathmann and others, Reference Rathmann2017; Lemos and others, Reference Lemos2018), ice frontal changes (Howat and others, Reference Howat, Joughin, Fahnestock, Smith and Scambos2008, Reference Howat, Box, Ahn, Herrington and McFadden2010; Moon and others, Reference Moon2014; King and others, Reference King2018; Bevan and others, Reference Bevan, Luckman, Benn, Cowton and Todd2019) and seasonal mélange break up (Rathmann and others, Reference Rathmann2017).
Observations at several Greenland glaciers (e.g. 55 in Moon and others (Reference Moon2014), 45 in Vijay and others (Reference Vijay2019) and 10 in Sakakibara and Sugiyama (Reference Sakakibara and Sugiyama2019)) over different periods suggested a potential link between melt season velocity changes and the seasonal switch between inefficient and channelized subglacial networks due to meltwater availability. Among 55 Greenland glaciers, Moon and others (Reference Moon2014) first defined three distinct seasonal velocity patterns (type-1, 2 and 3) during 2009–2013. Vijay and others (Reference Vijay2019) extended their work by filling data gaps using consistent and dense ice velocity data for the period 2015–2017. While type-1 glacier velocity variations were linked with changes in the ice front position, type-2 and -3 seasonal behaviors were identified with seasonal switching of the drainage networks (Vijay and others, Reference Vijay2019). Type-2 glaciers significantly accelerate for a couple of weeks after the surface melt onset, followed by slowdown to near the velocity prior to melt-onset for the rest of the melt season. In contrast, type-3 glaciers show a smaller amplitude acceleration with melt onset and have larger deceleration during the late melt season, declining to late season speeds substantially lower than pre-melt season speeds. Moon and others (Reference Moon2014) found type-2 behavior to be prevalent in NW Greenland and spring speedups concurrent with the onset of meltwater runoff. They noticed that type-3 glaciers generally slowed despite increased runoff, reaching an annual minimum during late summer and relatively decreased runoff, indicating a transition from inefficient to efficient subglacial drainage (Schoof, Reference Schoof2010). Velocity patterns indicating a similar relationship were found in Prudhoe Island, NW Greenland during 2014–2016 (Sakakibara and Sugiyama, Reference Sakakibara and Sugiyama2019). However, Greenland-wide analyses in King and others (Reference King2018) found no significant relationships between summer ice discharge (or velocity) maxima and total or maximum runoff, suggesting that glaciers may be more sensitive to the timing of runoff than the seasonal sum and that regional or individual behavior may not be representative of the ice sheet as a whole. The individual seasonal behaviors, and their changes through time, of most Greenland glaciers, are unknown.
Observations from year-around Sentinel-1 synthetic aperture radar (SAR) data with a 6- to 12-day revisit frequency enable ice-sheet-wide assessment (Nagler and others, Reference Nagler, Rott, Hetzenecker, Wuite and Potin2015). In this study, we make use of Greenland-wide standard ice velocity products, derived from Sentinel-1 SAR data by the PROMICE (Programme for Monitoring of the Greenland Ice Sheet) program by the Geological Survey of Denmark (Solgaard and others, Reference Solgaard2021). Here, we present a classification scheme applied to the full ice sheet by extending earlier classification studies (Moon and others, Reference Moon2014; Vijay and others, Reference Vijay2019). This approach is first applied to 2017 ice velocity data in order to classify 221 Greenland glaciers into type-2 and -3 based on their seasonal velocity patterns. We couple the 2017 classification results with runoff data and a simple hydrologic model (Chu and others, Reference Chu2016b) to explore how well seasonal ice velocity changes may reflect the characteristics of subglacial systems. Finally, we also extend our classification to 2018 and 2019 to test if classifications remain consistent across multi-year scales.
Data and methods
Glacier ice velocities
We used GrIS-wide ice velocity mosaics generated as a part of PROMICE using the Interferometric Post Processor (IPP) developed at the Technical University of Denmark (Solgaard and others, Reference Solgaard2021). Ice velocity is derived from European Space Agency's Sentinel-1 SAR data using offset tracking (Strozzi and others, Reference Strozzi, Luckman, Murray, Wegmüller and Werner2002) and assuming surface parallel flow using the digital elevation model from the Greenland Ice Mapping Project (GIMP DEM, NSIDC 0645) (Howat and others, Reference Howat, Negrete and Smith2014, Reference Howat, Negrete and Smith2015). Sentinel-1 is a space-borne radar mission comprising two identical C-band (5.405 GHz) satellites (Sentinel-1A and 1B) that provide consistent SAR images of Greenland in Interferometric Wide swath mode (swath width: 250 km × 250 km) with a 6- or 12-day revisit frequency (Torres and others, Reference Torres2012; Potin and others, Reference Potin, Rosich, Roeder and Bargellini2014). Each mosaic spans two repeat cycles of Sentinel-1A/B (total 24 days) consisting of both 6- and 12-day image pairs and these mosaics are available at 6–12 day temporal intervals (Solgaard and others, Reference Solgaard2021). These mosaics are posted on 500 m × 500 m grids. Ice velocity uncertainties are estimated from the local standard deviation of the displacement maps generated by the offset-tracking (Solgaard and others, Reference Solgaard2021). Although this is not a complete error characterization, Boncori and others (Reference Boncori2018) showed that it provides the correct order of magnitude of the errors. These uncertainties are obtained for each pixel of the ice velocity mosaics. The PROMICE ice velocity product has been validated using GPS measurements from PROMICE automatic weather stations. The standard deviation of the difference between the GPS measurements and the satellite derived product as well as the mean difference was found to be 19 and 4 m yr−1, respectively (Solgaard and others, Reference Solgaard2021).
Classification based on seasonal ice velocity patterns
The studies by Moon and others (Reference Moon2014) and Vijay and others (Reference Vijay2019) noticed three distinct seasonal ice velocity patterns (type-1, 2 and 3), defined in the Introduction section. The type-1 pattern does not suggest sensitivity to meltwater, while type-2 and -3 patterns highlight the contrasting glacier response to surface melt onset and the duration of the melt season (Moon and others, Reference Moon2014; Vijay and others, Reference Vijay2019). Our classification method is motivated by type-2 and -3 behaviors observed in Vijay and others (Reference Vijay2019). These behaviors are exemplified by the seasonal patterns of Hagen Bræ (type-2) and Upernavik Isstrøm-I (type-3) in 2017 (Fig. 1), and therefore we select them as standards for classifying 221 glaciers in 2017. However, the seasonality can vary from year to year and therefore, these glaciers cannot be treated as standards for other years. For instance, the pre-melt onset and late-melt season velocities of Hagen Bræ are not comparable in 2018. Hence, Nordenskiöld Gletsjer (Glacier No. 111) is chosen as a standard type-2 for 2018 and 2019, while Kangilernata Sermia (106) and Heilprin Gletsjer (29) are selected as standard type-3 for 2018 and 2019, respectively. In order to produce velocity time-series for classification, we calculated a median of 8–10 pixel values, defined by a circle of radius ~750 m (area: 4700 m2), within 2 km of the ice fronts. The coordinates of these observed locations are available in Supplementary Material. We normalized the ice velocities by their respective annual minimum and maximum values, and compared each individual (test glacier) velocity time-series with the standard type-2 and type-3 patterns by calculating the respective time-series distances. These distances are the cumulative absolute residuals between the normalized observations at test glaciers and each standard curve divided by the number of observations (~45), which are evenly distributed throughout the year. We manually set a threshold of 0.25 on time-series distance (where a value of zero indicates the time-series are identical) for classification, which means a distance value of less than but not equal to 0.25 classifies a test glacier into either type-2 or type-3. Glaciers remain unclassified if their time-series distance values from both standard patterns are either equal to or exceed this threshold (⩾0.25).
Examples showing the standard type-2 (Hagen Bræ) and type-3 (Upernavik Isstrøm-I) seasonal ice velocity patterns in 2017 by blue and red dots, respectively. Test glacier patterns shown by black dots were classified into type-2 or type-3 based on a distance computed using time-series analysis of ~45 such observations. The top panel shows Zachariae Isstrøm (test glacier) and its time-series distances from standard type-2 and type-3 glaciers, which came out to be 0.14 and 0.37, and therefore it was classified as type-2. The bottom panel displays Kangilernata Sermia as type-3 as its distance from the standard types 2 and 3 are 0.46 and 0.2, respectively. The cyan and pink vertical bars in the panels show daily meltwater runoff from Hagen Bræ and Upernavik Isstrøm-I, respectively.

Hydrologic routing algorithm
It is well known that surface meltwater reaching the bed is routed subglacially, affecting the basal water pressure and sliding, resulting in seasonal fluctuations in ice flow speeds (Bartholomew and others, Reference Bartholomew2010; Hoffman and others, Reference Hoffman, Catania, Neumann, Andrews and Rumrill2011). The response of individual glaciers, however, can vary depending on the channelization (Schoof, Reference Schoof2010) and rerouting of subglacial pathways (Chu and others, Reference Chu, Creyts and Bell2016a). Type-2 and -3 seasonal behaviors are expected to be primarily governed by meltwater-induced changes in the subglacial hydrology (Moon and others, Reference Moon2014; Vijay and others, Reference Vijay2019). In this study, we document GrIS-wide observations of glaciers that show either of these behaviors. In order to investigate the potential link between ice velocity and subglacial hydrology across the ice sheet, we apply a simple hydrological routing algorithm to estimate the general subglacial water pathways beneath glaciers that showed type-2 and type-3 behaviors in 2017. We carry out four experiments by simulating changes in the general subglacial flow paths due to: (1) decadal changes in ice surface elevations using GIMP (Greenland Ice Mapping Project) DEMs including errors and (2) variations in flotation fractions from 0.8 to 1.1. More details on the applied algorithm can be found in the Supplementary Material.
Meltwater runoff onset and end
We use daily modeled runoff estimates from the Regional Atmospheric Climate Model version 2.3p2 (RACMO2.3p2) at 5.5 km, statistically downscaled to 1 km spatial resolution, to mark the days of onset and end of the meltwater runoff season in 2017 for our study glaciers (Noël and others, Reference Noël, van de Berg, Lhermitte and van den Broeke2019). The onset and duration of the melt season were defined by significant change points in slope and mean runoff values. We identify the 40 most significant change points in runoff, and use the first and last change points as the bounds of the melt season. We combine these dates with the glaciers’ annual peak velocity days. The peak velocity day is the center date of the observation epoch with the annual maximum velocity. The time difference between runoff onset and peak velocity is termed as the speedup period, while the time interval between peak velocity and the end of meltwater runoff is called the slowdown period.
Results
Classification
Our new semi-automatic classification scheme presents a first GrIS-wide classification of seasonal velocity patterns of 221 Greenland outlet glaciers in 2017, 2018 and 2019. Most of the study glaciers (~96 %) terminate at the ocean with a few exceptions in the SW basin.
Classification in 2017
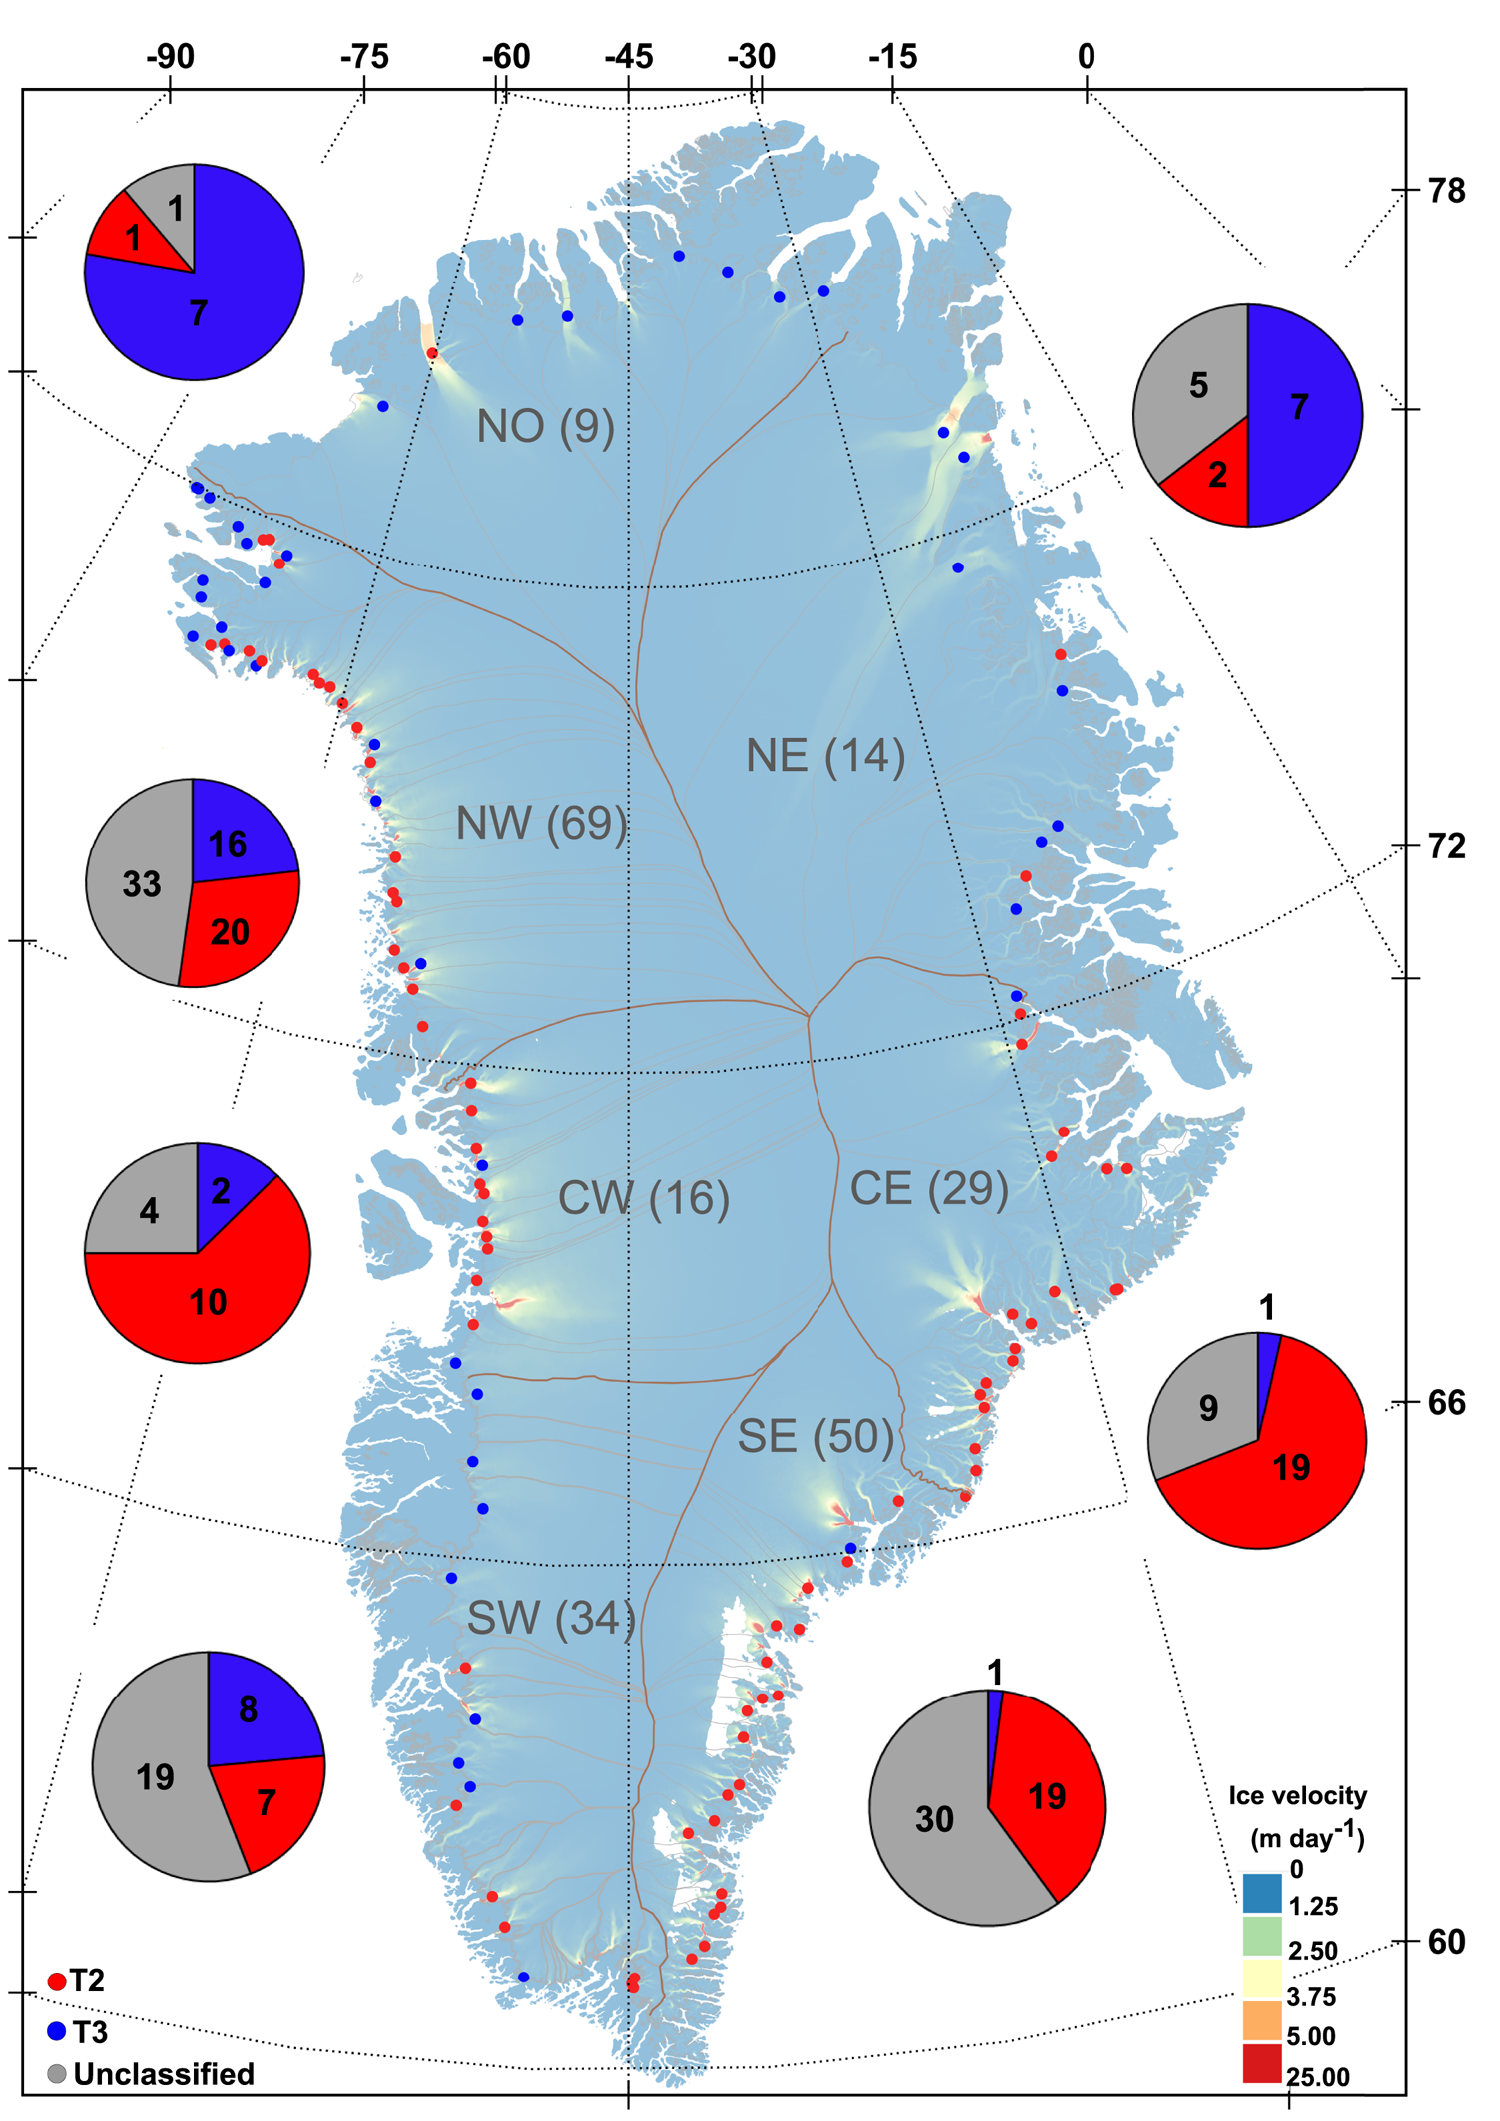
In 2017, we classified 42 and 78 glaciers as type-2 and type-3, respectively (Fig. 2). As shown in Figure 2, type-2 glaciers are clustered in the NE, NO and NW basins of Greenland, while the CW, CE and SE basins are dominated by type-3 glaciers. Most of the investigated glaciers in NO and NE regions showed type-2 behavior (Supplementary Table 2). In the far northwest of the NW basin, a large number of glaciers showed type-2 behavior. About half of glaciers in the SE, CE and CW basins showed type-3 behavior. The SW basin has a near equal mix of both types, while more than half of the glaciers remain unclassified out of which 23% do not terminate at the ocean (Supplementary Table 2).
Seasonal ice velocity classification map of Greenland showing the location of type-2 (blue dots) and type-3 (red dots) glaciers in different basins, namely NO: North, NE: North East, CE: Central East, SE: South East, SW: South West, CW: Central West, NW: North West. Pie charts display number of type-2 (blue), type-3 (red) and unclassified (gray) glaciers in these basins. The background velocity map is NASA MEaSUREs Greenland Quarterly Ice Sheet Velocity Mosaics from SAR and Landsat, Version 1 product (Joughin and others, Reference Joughin, Smith and Howat2018) and the basins are provided from Mouginot and others (Reference Mouginot2019).
Combining 2017 runoff data with ice velocity changes, we found that type-2 glaciers, on average, accelerated for ~5 weeks and decelerated for ~11 weeks in the melt season, while type-3 glaciers’ average acceleration and deceleration periods were ~2 and ~16 weeks, respectively (Fig. 3). On average, the peak in velocity for type-3 glaciers occurred in the 22nd week of 2017, which is ~ 5 weeks prior to that of type-2 glaciers. Figure 4 shows melt season length, timing of acceleration and duration of deceleration for glaciers showing type-2 and -3 behaviors in 2017. The peak velocity of 24% of our type-3 glaciers occurred prior to the melt season, whereas the peak velocities for type-2 glaciers took place only during the melt season, with the exception of one glacier (Storstrømmen) that attained peak velocity within 2 weeks prior to the melt onset (Fig. 4). Apart from broad classification of glaciers into two categories and their average characteristics, our approach also reveals differences in the magnitudes and timing of velocity changes within the individual categories. For instance, Hagen Bræ, which we use as the standard type-2 pattern in 2017, accelerated for nearly 4 weeks and took 12 weeks to return to its pre-melt ice velocity (Fig. 1 and 4). Conversely, Zacharie Isstrøm, also classified as a type-2 glacier, had nearly symmetric acceleration and deceleration periods of ~7 and ~6 weeks, respectively (Fig. 1). Standard type-3 glacier Upernavik Isstrøm-I reached its peak velocity within a week after the melt season onset and took 13 weeks to slow down from its annual maximum velocity to minimum velocity (Fig. 4). Similarly, Kangilernata Sermia (Fig. 1) showed a modest acceleration in the early melt season (3 weeks) and needed almost 14 weeks to slow down to the late-season annual minimum.
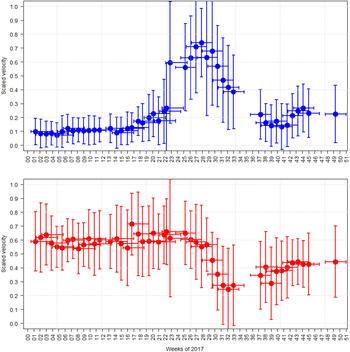
Cumulative plots of 42 type-2 (upper panel) and 78 type-3 (lower panel) glaciers showing their median variations in ice velocities in 2017 by blue and red dots, respectively. Vertical bars show the median absolute deviations (MAD) in velocities and horizontal bars denote the time period over which each velocity value was estimated.

Panels showing histograms of melt season length, timing of speedup and duration of slowdown for type-2 and type-3 glaciers in 2017.

Classification in 2018 and 2019
In 2018, 49 glaciers showed type-2 behavior and 55 glaciers exhibited type-3 behavior, while, in 2019, 38 were classified as type-2 and 96 glaciers showed type-3 behavior (Supplementary Figs 2 and 3, Table 2). In general, 2018 and 2019 regional patterns are similar to what we notice in 2017. For instance, NO and NE regions are dominated by type-2 glaciers, whereas SE, CE and CW regions had more of type-3 glaciers in 2018 and 2019. In the SW region, the number of type-2 and type-3 glaciers were relatively consistent across years 2017, 2018 and 2019. Across the ice sheet, we found that 100 glaciers consistently exhibited type-2 (39 glaciers) and type-3 (61 glaciers) behaviors for at least 2 years in 2017–2019. Across the 3-year study period, 15 glaciers were consistently type-2, and 23 glaciers were consistently type-3. The majority (68%) fit more than one classification in this period, demonstrating the high degree of interannual variability in the seasonal velocity patterns.
Discussion
Classification sensitivity to observational and threshold parameters
We use observations of ice velocities close to the glacier fronts for classification. It is worth noting that seasonal patterns of variability, and therefore the glacier type can vary at different locations on the glacier. For example, seasonal variability in 2017 at Hagen Bræ is consistently type-2 when sampled at increasing (up to 14.4 km inland) distances from the front (Supplementary Fig. 4). By contrast, Kangerlussuup Sermia closely matches type-3 behavior near its front with elevated velocities in the winter and spring, but deviates from this pattern further inland (> 15 km) with elevated velocities confined only to mid-summer (Supplementary Fig. 4). This potentially indicates that the role of meltwater may vary along flow depending on glacier geometry, meltwater input and interactions with changes at the glacier front. Therefore, our classification based on observations closest to the front provides consistency for inter-glacier comparisons, but does not necessarily describe the behavior of each glacier beyond its front.
The standard type-2 and type-3 velocity patterns are very distinct from one another, and these distinctions are mirrored in the mean seasonal variability of all glaciers classified as each respective type (a plot of mean seasonal variability for all type-2 glaciers (n = 42) and type-3 glaciers (n = 78) in 2017 is provided in Fig. 3). Using our criteria-meeting limit of 0.25, we found no instances of a glacier qualifying as both type-2 and type-3 in 2017 except a very few cases in 2018 and 2019, highlighting the distinction between the two types. While our use of 0.25 as a classification threshold was empirically derived, these results show that its application minimizes both the number of glaciers meeting both classifications and also the number of glaciers that remain uncategorized (i.e. those that deviate from both standard type-2 and type-3 velocity curves by greater than the threshold). Finally, we briefly consider how uncertainties in velocity observations may impact classifications, and perform a sensitivity test using 2017 velocity data. Relative velocity uncertainties vary by glacier, but are typically <10% of the velocity magnitude, with only a few instances of larger uncertainties (>30%) at slow-moving glaciers. Artificially varying the velocities within the 10% uncertainty bounds and recomputing the time series distance calculations, we found that 33 (28% of the classified sample) glaciers became unclassified. These glaciers were previously near the classification threshold limit with time series distance values between 0.23 and 0.25.
Individual and regional changes in seasonal behavior
The standard seasonal patterns, in terms of the timing of their variability relative to meltwater runoff, are consistent with the hypothesis that the surface melt reaching the subglacial environment influences the capabilities of the subglacial drainage systems and hence the ice velocities (Bartholomew and others, Reference Bartholomew2010; Sundal and others, Reference Sundal2011; Moon and others, Reference Moon2014, Reference Moon, Joughin and Smith2015; Bevan and others, Reference Bevan, Luckman, Khan and Murray2015; Vijay and others, Reference Vijay2019; Sakakibara and Sugiyama, Reference Sakakibara and Sugiyama2019; Solgaard and others, Reference Solgaard2020; Neckel and others, Reference Neckel, Zeising, Steinhage and Helm V2020). This relationship is pertinent to a large number of Greenland glaciers, classified in this study, while the influencing factors in the case of unclassified glaciers may vary. For example, Kangerlussuaq Gletsjer’ seasonal time-series is distinct from both type-2 (0.39) and type-3 (0.29) behavior in 2017 (Supplementary Fig. 5). However, this glacier showed high autumn-wintertime velocities and summer speedup, like type-3, but did not show any signs of late-season slowdown, which was also observed in 2015 by Kehrl and others (Reference Kehrl, Joughin, Shean, Floricioiu and Krieger2017). Kangerlussuaq Gletsjer remains unclassified in 2018 and 2019 as well, but is inclined toward type-3 behavior in general as inferred from its distance values from standard type-3 (0.29, 0.25 and 0.26), as also noticed by Moon and others (Reference Moon2014) for 2012 and 2013. This indicates that meltwater-induced late-summer channelization probably did not occur these years. Similarly, the seasonal ice dynamics of Jakobshavn Isbræ (Supplementary Fig. 5) does not conform to either of these patterns during 2017–2019. We noticed significant summer speedup followed by wintertime slowdown in these years as also found by Lemos and others (Reference Lemos2018) and Joughin and others (Reference Joughin, Shean, Smith and Floricioiu2020), which they attribute to changes in the front positions. A long-term study by Joughin and others (Reference Joughin, Shean, Smith and Floricioiu2020) indicates the role of mélange rigidity in winter slowdown and terminus advance caused by ocean temperature, further manifesting that complex mechanisms persist in this case. Hagen Bræ is a surge-type glacier and its last active phase ended around 2013. It has not returned to the quiescent phase and is currently transitioning between type-2 and type-3 behavior (Solgaard and others, Reference Solgaard2020). We found consistent type-2 behavior of Hagen Bræ during 2017–2019. In-situ Global Positioning System observations in the summer of 2017 at 79N Glacier also showed its type-2 behavior (Neckel and others, Reference Neckel, Zeising, Steinhage and Helm V2020). Our observed seasonal patterns in NW Greenland are in line with previous observations for the period 2009–2015 (Moon and others, Reference Moon, Joughin and Smith2015) and 2014–2016 (Sakakibara and Sugiyama, Reference Sakakibara and Sugiyama2019) using different satellite data. The dominance of type-3 glaciers in CE and SE regions is also documented in Moon and others (Reference Moon2014) (2009–2013) and Vijay and others (Reference Vijay2019) (2017–2019), for example, Upernavik Isstrøm-I has been consistently type-3 since 2009. A few studies also found the prevalence of type-2 glaciers in NO-NE Greenland (Rathmann and others, Reference Rathmann2017; Lemos and others, Reference Lemos2018; Vijay and others, Reference Vijay2019).
Connections between changes in seasonal velocity, melt season and subglacial hydrology
Subglacial drainage channels grow when the rate of melting of channel walls, which increases with meltwater discharge, exceeds the rate of creep closure, which declines with increasing subglacial water pressures (Schoof, Reference Schoof2010). Thus, melt rates become large at high subglacial water discharges and pressures, leading to rapid growth of basal channels and a switch from inefficient drainage through dispersed cavities and channels to efficient drainage through concentrated tunnels (Kamb, Reference Kamb1987; Schoof, Reference Schoof2010). This results in a decrease in subglacial water pressure and basal sliding even if high rates of meltwater discharge persist. From the contrasting type-2 and type-3 behaviors and their average periods of speedup and slowdown, we infer that the transition from inefficient to efficient modes of subglacial drainage generally occurs more rapidly in case of type-3 as compared to type-2 (Fig. 4). We therefore expect the prevalence of type-2 and type-3 glaciers to be partially dependent on the intensity and duration of surface melting. As calculated from RACMO2.3p2, type-3 glaciers had longer melt seasons in 2017 (19±4 weeks) compared to type-2 glaciers (15.6±4 weeks) (Fig. 4). As can be seen from Figure 2, type-2 instances are clustered in NE, NO and far northwest parts of the NW basin, which correspond to shorter melt seasons (~14 weeks) compared to regions dominated by type-3 glaciers, for example, SE basin (~21 weeks). Time series of Sentinel-1 C-band radar backscatter in 2017 also confirm different timings of melt onset and their durations among glaciers in NE, CE, SE and CW basins (Vijay and others, Reference Vijay2019). For example, the melt season onsets earlier and lasts longer at Upernavik Isstrøm- I (our type-3) than at Zachariae Isstrøm (our type-2) (Vijay and others, Reference Vijay2019). Type-3 glaciers generally had high autumn-wintertime velocities and a quarter of these glaciers acquired peak velocities in winter, which means that their melt seasons mostly evidenced slowdown. We expect that as discharges and water pressures both decline in early autumn, the rate of creep closure increasingly exceeds the melting of subglacial channels. This can potentially impound remaining surface meltwater or basal melt in the subglacial system, again increasing both subglacial water pressure and sliding velocity (Lingle and Fatland, Reference Lingle and Fatland2003; Chu and others, Reference Chu2016b). We also investigate the relationship between cumulative meltwater runoff and individual glacier behavior as type-2 and type-3 in 2017 (Supplementary Fig. 6). Nearly half of type-2 glaciers (45%) produce meltwater <0.5 Gtonnes in 2017, while 65% of type-3 glaciers produce melt between 0.5 and 2.0 Gtonnes. Several of both glacier types produce meltwater >2.0 Gtonnes. This is not clearly indicative of all the type-2 or type-3 glaciers being governed by cumulative meltwater.
Subglacial flow paths carrying surface meltwater are known to be rerouted for a few glacier systems in Greenland depending on surface topography and water pressure (Chu and others, Reference Chu, Creyts and Bell2016a). We expect that the subglacial water rerouting can influence the development of subglacial drainage systems and ultimately ice flow. Therefore, we tested if rerouting occurs in our classified glaciers (2017) due to decadal changes in ice surface elevations and variations in flotation fractions (Wright and others, Reference Wright, Siegert, Le Brocq and Gore2008; Chu and others, Reference Chu, Creyts and Bell2016a) (Supplementary Material). Three out of four different scenarios suggest that 65–74% type-2 glaciers are likely to reroute water. We speculate that they may have a more ephemeral water supply that is less favorable for sustaining an efficient subglacial drainage configuration at high discharges, as also inferred from the type-2 velocity behavior. Three scenarios suggest 48–66% of type-3 glaciers show no rerouting, but a large number of glaciers also show rerouting. These statistics neither confirm nor deny our hypothesis that the type-3 glaciers with persistent subglacial drainage pathways could be in a favorable condition to develop and sustain an efficient drainage system.
Conclusions
We propose a semi-automatic scheme to provide first of its kind ice-sheet wide classification of 221 Greenland glaciers in 2017–2019 based on two distinct (type-2 and -3) seasonal ice velocity patterns. These behaviors are possibly linked with variations in subglacial hydrological conditions due to surface meltwater runoff. We expect that this seasonal transition occurs when increasing subglacial meltwater discharge and water pressure result in rapid enlargement and coalescence of drainage pathways into a system of tunnels and, therefore, likely indicates sustained, high meltwater discharge. Combining seasonal velocity changes with melt season characteristics of classified glaciers in 2017 suggests that the seasonal switch of subglacial drainage from inefficient to efficient occurs more rapidly in case of type-3 glaciers compared to type-2 glaciers. We would then expect a switch to efficient drainage associated with type-3 behavior to be more prevalent where the melt season is more intense. Consistent with this hypothesis, we find that type-2 behavior is dominant in the colder northern regions where melt seasons are less intense, while type-3 is dominant in the warmer southern and central regions during the 2017–2019 period. In addition, we expect that the greater, sustained subglacial drainage associated with type-3 glaciers should be associated with more persistent subglacial routing, whereas type-2 glaciers may have routing systems that change over time, including through water piracy between adjacent drainages. We test this hypothesis by using a hydrologic routing model to detect the occurrence of subglacial water rerouting at the glacier-basin scale. Results from a hydrologic routing model are inconclusive for nearly half of type-3 glaciers and one-third of type-2 glaciers. This suggests that other factors besides large-scale glacial hydraulic conditions determine the seasonal variability in ice flow speed and that more advanced approaches, including numerical models that can characterize the transient evolution of the drainage system under meltwater forcing, may be required to understand seasonal behavior. We also emphasize that the behaviors not only change inter-annually but may vary depending on the observation point on the glacier. A large number of glaciers (96) showed type-3 behavior in 2019 as compared to 2017 (78) and 2018 (55), possibly linked with the fact that 2019 was relatively warmer than these earlier years (Sasgen and others, Reference Sasgen2020), and hence more meltwater production suitable for type-3 behavior. However, this requires further investigations and an inter-annual analysis of runoff, ice thinning and changes in both ice velocity and front position will help better understand glacier switching behaviors and their prevalence.
Supplementary material
The supplementary material for this article can be found at https://doi.org/10.1017/jog.2021.89.
Acknowledgements
This work was supported by NASA Cryosphere program award 80NSSC18K1027. We thank Winnie Chu (Georgia Institute of Technology) for providing her modeling results and valuable comments about the relationship between subglacial hydrology and ice flow. S.A.K. acknowledges support from the INTAROS GA No. 727890 funded by European Union's Horizon 2020 Research and Innovation Programme. Ice velocity maps were produced as part of the Programme for Monitoring of the Greenland Ice Sheet (PROMICE) using Copernicus Sentinel-1 SAR images distributed by ESA, and were provided by the Geological Survey of Denmark and Greenland (GEUS) at http://www.promice.dk. We thank Helen Fricker (Scientific Editor) and two anonymous reviewers for extensive and thorough comments that helped to substantially improve the paper.


 Open access