





Introduction
Subacute ruminal acidosis (SARA) is characterized by a sustained decrease in rumen pH and represents an important metabolic challenge in ruminant livestock production. The prevalence of SARA is a matter of concern, with field studies in the United States indicating that it affects between 19 and 40% of cattle herds (Humer et al. Reference Humer, Petri and Aschenbach2018). The repercussions of this pH imbalance are multifaceted, decreasing fiber digestion and feed intake, disrupting the rumen microbial ecosystem, compromising the integrity of the rumen wall, and ultimately influencing the overall performance and well-being of the animals (Zhang et al. Reference Zhang, Li and Ma2023). The primary cause of SARA is the ingestion by ruminants of large amounts of highly fermentable carbohydrates, particularly rapidly degradable starch (Li et al. Reference Li, Yang and Cao2014). This leads to rapid production of volatile fatty acids (VFA), which surpasses the animal’s capacity for absorption and buffering, gradually decreasing pH (Enemark Reference Enemark2008). SARA is caused by high concentrations of VFA and occurs even in animals gradually adapted to high-concentrate diets. In contrast, acute (lactic) acidosis is caused by severe lactate accumulation, leading to rumen pH dropping below 5.0, and being potentially fatal if not promptly treated. Acute acidosis occurs when ruminants are abruptly offered highly fermentable diets without a gradual transition for adapting the rumen microbiota to utilize lactate (Minuti et al. Reference Minuti, Ahmed, Trevisi, Piccioli-Cappelli, Bertoni, Jahan and Bani2014). Given the subtle clinical manifestations of SARA, it is valuable to identify animals prone to SARA when offered highly fermentable diets.
A prolonged period of relatively low rumen pH caused by high VFA concentration can also hinder the production of the VFA themselves, leading to the accumulation of fermentation intermediates, which typically do not accumulate in the rumen. Lactate is an intermediate organic acid in the non-randomizing pathway of propionate production which accumulates in the rumen of ruminants affected by SARA (Danscher et al. Reference Danscher, Li and Andersen2015). Lactic acid has a pK approximately one unit lower than VFA and it is thus a stronger acid, although accumulation of lactic acid occurring with SARA is considerably more moderate than with lactic acidosis. In the rumen, lactate is mainly produced from pyruvate reduction, with lactic dehydrogenase playing a pivotal role in the process. We hypothesized that the relative abundance of the gene encoding for lactic dehydrogenase (ldh) can predict the risks of individual animals to develop SARA when they are offered highly fermentable diets.
The aim of this study was to investigate whether the relative abundance of ldh in the rumen can serve as a biomarker for predicting the susceptibility of individual lambs to SARA. To do this, we initially screened 121 Hu lambs for their predicted bacterial ldh abundance in their rumen estimated from a PICRUST approach based on a 16S rRNA gene meta-taxonomic analysis (Douglas et al. Reference Douglas, Maffei and Zaneveld2020). Subsequently, we performed rumen cannulation on the six lambs with the highest and the lowest ldh abundance in the rumen and fed them a starch-rich diet. We then compared the selected lambs regarding their rumen ldh abundance as determined by metagenomics, rumen pH, and VFA and lactate concentrations, to examine the hypothesis that ldh abundance is positively associated with SARA proneness.
Materials and methods
The ethics application was approved by the Animal Care and Use Committee of Lanzhou University, Lanzhou, China (approval number CPAST-2023-LI-3).
Identification of LLDH and HLDH lambs
A total of 121 10-month-old male Hu lambs (BM = 41.0 ± 3.80 kg, mean ± SD) from a same barn of a commercial sheep farm (Zhongtian Sheep Industry, Wuwei, China) were screened for ldh abundance in the rumen. Lambs were raised in a sheepfold adhering to the standardized finishing management process of the company. Briefly, lambs were fed a pelleted total mixed ration (TMR) (33% corn, 20% corn germ meal, 25% corn stover, 10% corn hull, 5% cotton seed meal, 4% soybean meal, 1.5% limestone, 0.50% NaCl, 0.50% slow-releasing urea, 0.50% premix; 14.0% CP, 19.0% starch, 38.5% NDF; the premix provided per kg dry matter (DM) of the diet: 25 mg Fe, 40 mg Mn, 40 mg Zn, 8 mg Cu, 0.3 mg I, 0.1 mg Co, 1000 IU VA, 150 IU VD, 20 IU VE) twice daily at 08:00 and 14:00, allowing for at least 15% refusals, and had free access to clean water. Feed offered and rejected was weighted and dried to determine DM intake. Before the morning feeding, approximately 100 mL of rumen content was collected from each lamb using an oral stomach tube inserted through the esophagus. The initial 30 mL of rumen content was discarded to prevent saliva contamination. Microbial DNA from rumen content was extracted using a method described by Ma et al. (Reference Ma, Zhang and Wang2020). The V3-V4 region of the bacterial 16S rRNA gene was amplified by PCR using primers 338F (5′-ACTCCTACGGGAGGCAGCA-3′) and 806R (5′-GGACTACHVGGGTWTCTAAT-3′) (Takahashi et al. Reference Takahashi, Tomita and Nishioka2014), and the resulting amplicon library was sequenced on an Illumina HiSeq 2500 platform by Tsingke Biotech Co., Ltd., Beijing, China. Subsequent taxonomic annotation was conducted based on a zero–radius operational taxonomic unit (ZOTU) method, as detailed in Ma et al. (Reference Ma, Zhang and Wang2020). Picrust2 was then used to predict the gene composition by the ZOTUs with default settings (Douglas et al. Reference Douglas, Maffei and Zaneveld2020). Based on the abundance of ldh gene, six lambs each with the lowest and the highest rumen ldh gene abundance were selected as LLDH and HLDH lambs, respectively.
Rumen cannulation, measurement of rumen pH, and VFA profile
Both LLDH and HLDH lambs were individually housed in separate pens (1.8 m × 1.3 m × 1 m) with a bamboo-spaced floor. The surgical procedures of rumen cannulation and postoperative care were conducted following the protocol described by Cao et al. (Reference Cao, Zhu and Li2021). In brief, the rumen cannulation procedure involved making a 4 cm incision through the skin and rumen wall after thorough disinfection. The rumen was carefully exteriorized using gastric forceps and stabilized with additional forceps to prevent retraction. A silicone cannula (RC-4S, Anscitech Co., Ltd., Wuhan, China) was then inserted through the incision, positioning it to create a secure interface between the rumen and skin layers. The final step involved suturing around the cannula’s neck with a purse-string technique to ensure proper fixation and prevent leakage, completing the surgical installation. During the 25-day post-surgery period, the selected lambs were provided with the same commercial pelleted TMR that they were fed prior to surgery, but at only 50% of the amount they ate before surgery, administered twice daily in equal doses at 08:00 and 14:00. Starting from day 26 after surgery, once all lambs had fully recovered, their diet was incrementally shifted over a 10-day period to a barley-rich pelleted TMR (15% corn stover, 16% corn bran, 44% wheat, 4% molasses, 8% soybean meal, 11% rice bran and hull, 0.50% limestone, 0.50% NaCl, 0.50% slow-releasing urea, 0.50% premix; 17.1% crude protein, 41.6% neutral detergent fiber, 25.5% starch; the premix provided per kg DM of the diet: 25 mg Fe, 40 mg Mn, 40 mg Zn, 8 mg Cu, 0.3 mg I, 0.1 mg Co, 1000 IU VA, 150 IU VD, 20 IU VE). The transition began with a blend of 25% the new diet and 75% existing diet for the first 2 days. The transition continued by gradually increasing to 50% new diet for the next 3 days and then to 75% for the subsequent 3 days. The final 2 days of the transition period concluded with the lambs being fed the 100% new diet.
After feeding this barley-rich pelleted TMR ad libitum for 15 days, rumen pH was monitored continuously for 48 h using pH probes inserted through the cannula, following the method described by Wang et al. (Reference Wang, Li and Zhang2023). On day 16, about 50 g rumen contents were collected through the cannula at 0, 2.5, 6, 9, and 12 h post-morning feeding (Fig. 1). Rumen contents were strained through four layers of gauze and acidified with 25% metaphosphoric acid (w/v) at a ratio of 1:9 (v/v) and stored at −20°C for subsequent VFA analysis. Additionally, approximately 10 mL of rumen fluid samples were snap-frozen in liquid nitrogen and stored at −80°C for further microbiological analysis.
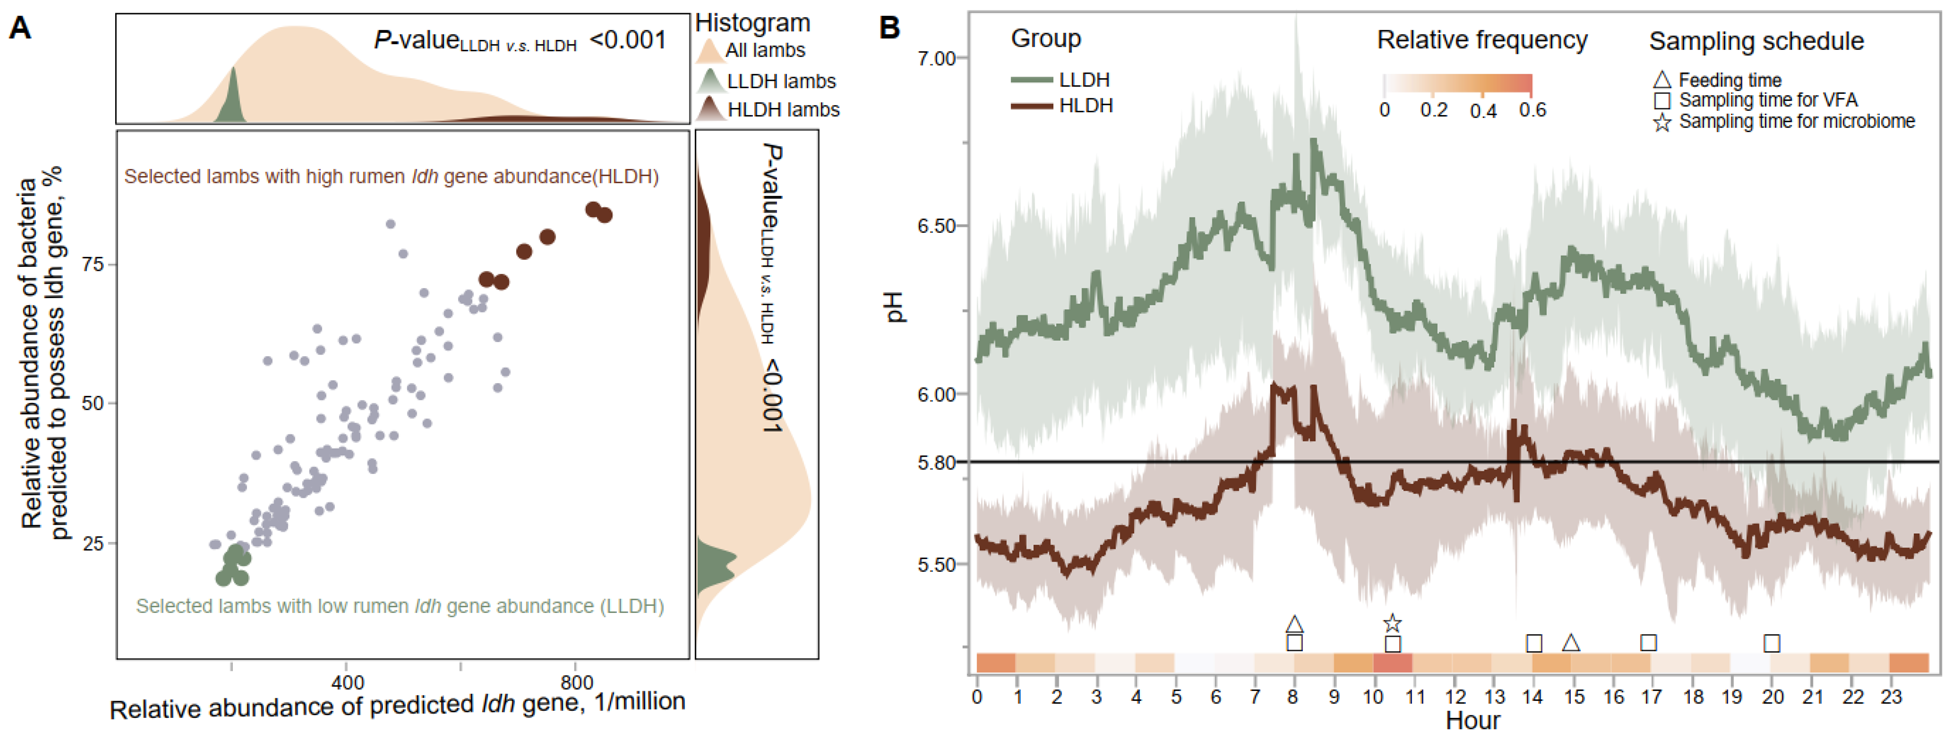
Low (LLDH) and high (HLDH) ldh gene abundance in the rumen of lambs selected based on 16S rRNA gene amplicon sequencing. (A) A scatter plot was generated to display the selection of lambs with high and low ldh gene in the rumen based on the predicted presence of the ldh gene and bacteria possessing the ldh gene. (B) Rumen pH dynamic throughout the day in LLDH and HLDH lambs. Error bands represent the 95% confidence intervals. The relative frequency, which represents the selection probabilities of time points in predicting the area under the pH curve where pH < 5.8, was calculated using the random frog method.
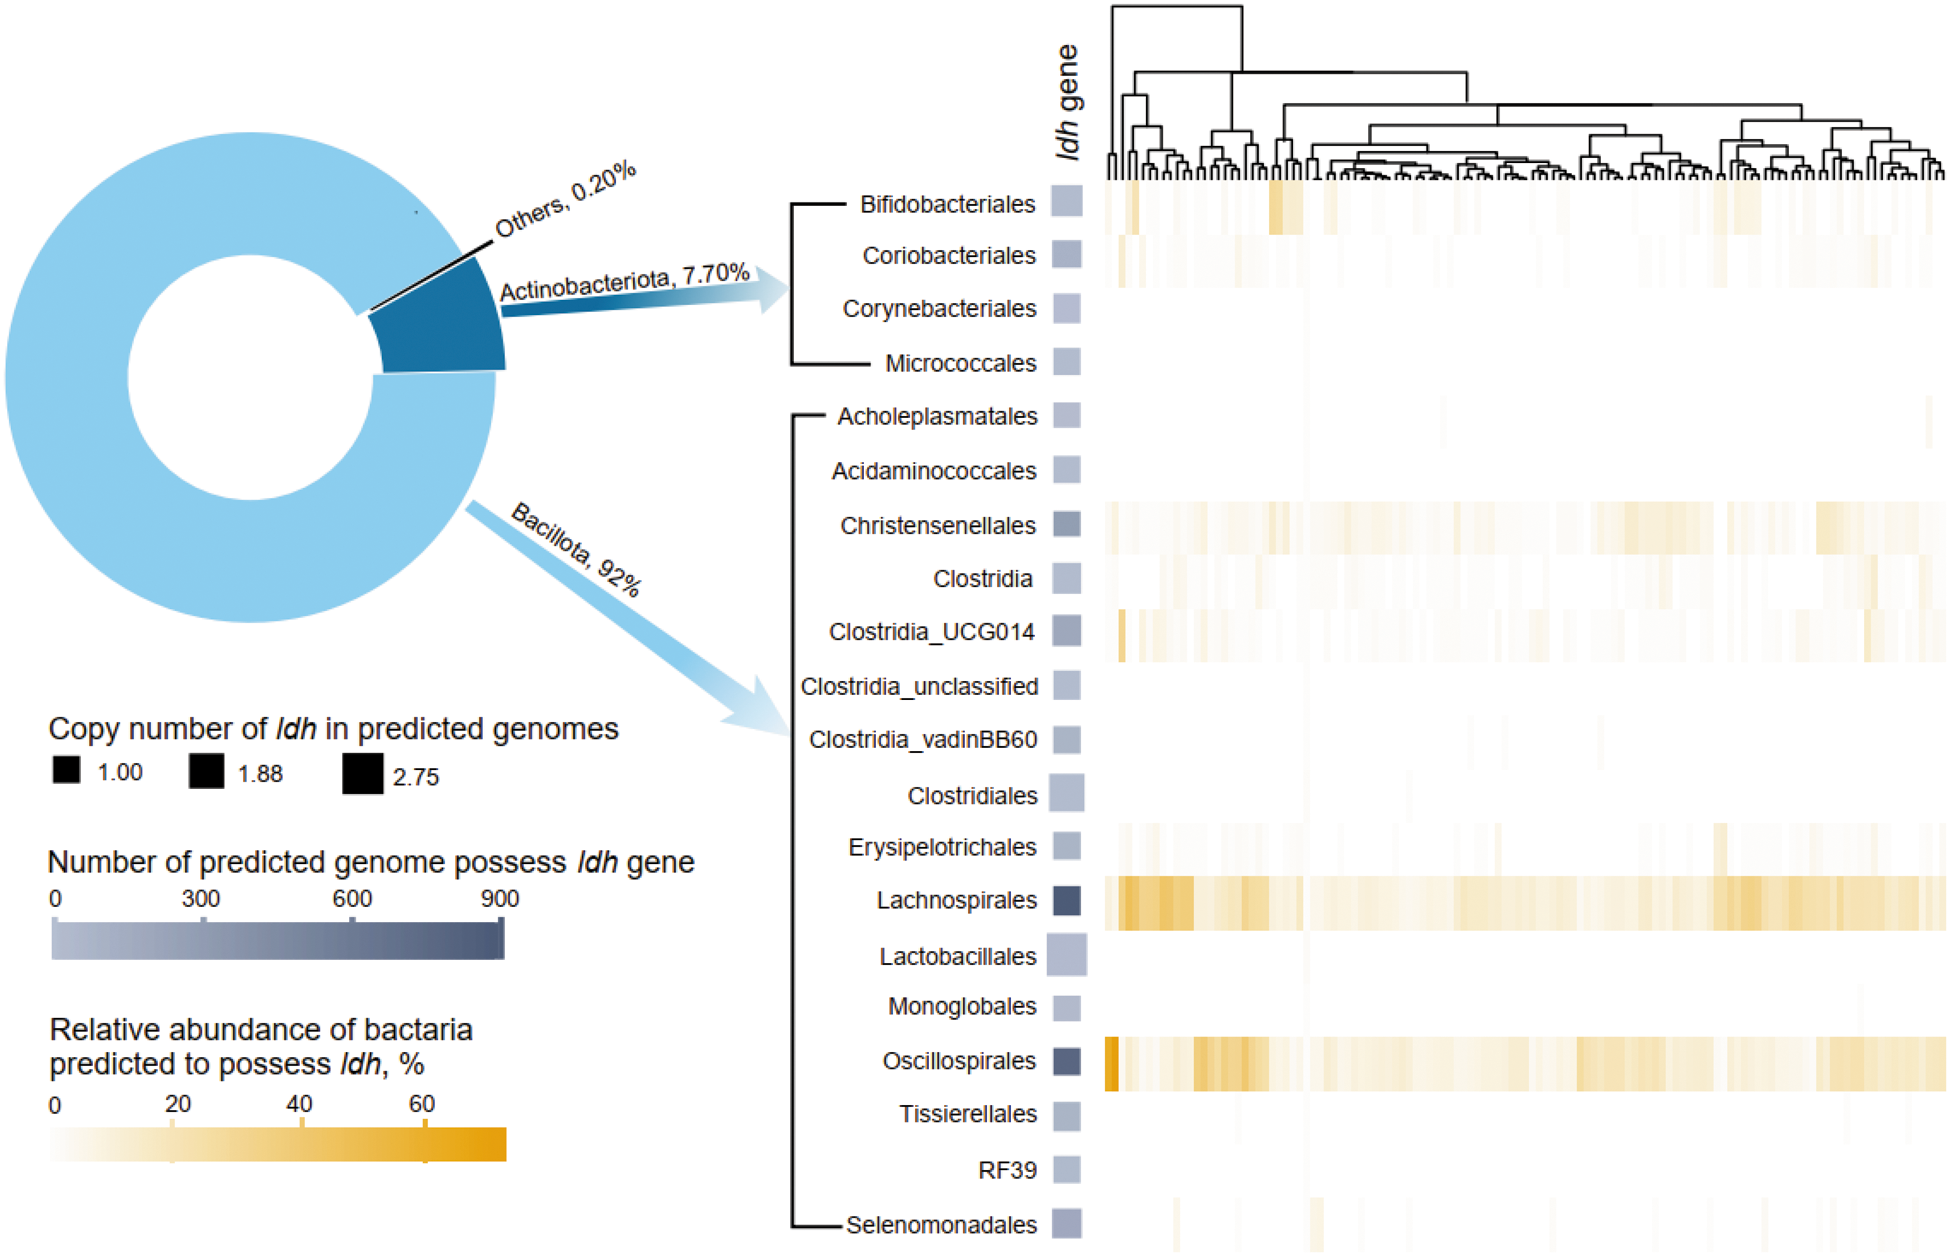
Figure 1 Long description
The image consists of two main components: a pie chart and a heatmap. The pie chart illustrates the distribution of the ldh gene among different bacterial groups. Bacillota accounts for 92 percent, Actinobacteriota for 7.70 percent and Others for 0.20 percent. The heatmap displays the abundance of the ldh gene across various bacterial orders, including Bifidobacteriales, Coriobacteriales, Corynebacteriales, Micrococcales, Acholeplasmatales, Acidaminococcales, Christensenellales, Clostridiales and others. The heatmap is accompanied by a dendrogram showing hierarchical clustering. The legend indicates the copy number of ldh in predicted genomes, ranging from 1.00 to 2.75 and the number of predicted genomes possessing the ldh gene, ranging from 0 to 900. Additionally, the relative abundance of bacteria predicted to possess ldh is shown as a percentage, ranging from 0 to 60 percent.
Samples used for VFA determination were thawed at room temperature and centrifuged at 10,000 × g for 10 min to obtain the supernatant. After filtration through 0.45 μm filters (Seap Technology Co., Ltd., Guangzhou, China), the VFA concentration was measured using a gas chromatography (TRACE 1300, Thermo Fisher Scientific, Waltham, USA), using the method by Liang et al. (Reference Liang, Li and Li2017).
Selection of the optimal time point for metabolomic and metagenomic analysis
We choose the sampling time for metagenomic and metabolomic analysis based on the variables that exhibited the highest relative frequency in predicting the area of the pH curve where pH < 5.8. To identify the best time points for downstream metabolomic and metagenomic analysis of rumen contents, we employed a novel method called random frog from the auswahl package of Python, using the default settings (https://github.com/LSX-UniWue/auswahl, accessed on January 5, 2023). Random frog is an innovative technique for variable selection in conjunction with partial least squares regression (Li et al. Reference Li, Xu and Liang2012). This method operates iteratively and provides for each variable a selection probability, referred to as the relative frequency. The relative frequency is calculated by dividing the frequencies by the total number of iterations. The frequency of each variable is determined using the framework of reversible jump Markov chain Monte Carlo within the random frog method.
Measurement of non-VFA organic acids using targeted metabolomics
Ten non-VFA organic acids including lactate, pyruvate, succinate, malate, fumarate, ketoglutarate, oxaloacetate, citrate, and isocitrate were measured using targeted metabolomics with an ultra-high performance liquid chromatography coupled to tandem mass spectrometry system (UHPLC-TSQ Altis, Thermo Scientific Co., Gladbeck, Germany). The standard solutions of individual organic acids (ZZ Standards Co., Ltd., Shanghai, China) were prepared in an organic acid-free matrix to produce a series of organic acid calibrators, with isotope standards compounded for use as internal standards. The stock and working solutions were stored at −20°C. Organic acids were extracted from the samples using 80% methanol, followed by derivatization at 40°C for 40 min. Separation was carried out on a Waters HSS T3 column (2.1 × 150 mm) at 40°C, using a mobile phase consisting of 0.1% formic acid in water (solvent A) and acetonitrile (solvent B) delivered at a flow rate of 0.40 mL/min. The solvent gradient ranged from initially 40% solvent B for 1 min, 40–60% solvent B for 3.5 min, 60–75% solvent B for 8.5 min, 75–100% solvent B for 11.5 min, and 100–60% solvent B for 16 min. The mass spectrometer operated in positive/negative multiple reaction monitoring mode, with specific parameters including IonSpray voltage (3500 V/−2500 V), sheath gas (35 psi), ion source temperature (350°C), auxiliary gas (60 psi), and collision gas (1.5 psi). The targeted metabolomic analysis was conducted by Biozeron Technology Co., Ltd., Shanghai, China.
Analysis of rumen metagenomes
We prepared paired-end libraries of total microbial DNA (0.1 μg) using the TruSeq DNA PCR-Free Library Preparation Kit (Illumina, Foster, USA). Subsequently, the sequencing was conducted on an Illumina HiSeq 3000 platform by Biozeron Technology Co., Ltd., Shanghai, China.
All software mentioned in this study was used with default settings, unless otherwise specified. The metagenomic analysis workflow for this study can be found at https://github.com/sleepvet/MicrobialDiversity/. The raw sequences underwent quality control using Trimmomatic v0.36 (Bolger et al. Reference Bolger, Lohse and Usadel2014), which included trimming the sequencing adapter and filtering out sequences with a quality score below 20 bp. Sequences containing unknown bases were also eliminated, along with short sequences with a length of less than 75 bp after the quality control step. Additionally, the short sequences of the host were removed using bowtie2 (Langmead and Salzberg Reference Langmead and Salzberg2012) against the Ovis aries genome with the NCBI genome assembly ID of 1549124 (https://www.ncbi.nlm.nih.gov/genome/83?genome_assembly_id=1549124, accessed on January 15, 2023).
We used MEGAHIT v1.2.9 (Li et al. Reference Li, Liu and Luo2015) to conduct separate de novo assembly for each sample with a minimum contig size of 500 bp and to perform de novo co-assembly for pooled samples of each treatment with a minimum contig size of 1000 bp. The contigs were utilized for microbial gene identification using Prodigal v2.6.3 (Hyatt et al. Reference Hyatt, Chen and Locascio2010). Subsequently, a non-redundant gene set was generated with CD-HIT v4.8.1 (Godzik Reference Godzik2006). We utilized kraken2 v2.1.2 (Wood and Salzberg Reference Wood and Salzberg2014) to annotate the taxonomic information of gene sequences against the nr genome database (https://github.com/BenLangmead/aws-indexes, accessed on 3 July 2022). Additionally, short sequences were mapped back to the Silva 138 rRNA database (Elmar et al. Reference Elmar, Christian and Katrin2007) for taxonomic profiling.
Gene abundance was estimated by the short sequences mapped using GEM v3.6.1 (Ashish et al. Reference Ashish, Dewan and Ambite2015) normalized using the TPM method (Mortazavi et al. Reference Mortazavi, Williams and Mccue2008). The TPM method normalizes to the sum of one million, considering both the reference genome length and the mapped short sequence count. This process allows for the estimation and normalization of the relative abundance levels of the genes based on the mapped short sequences.
Genes were subjected to annotation against several databases to elucidate their functions. The KEGG Orthology (KO) was identified using the kofamscan v1.3.0 (https://github.com/takaram/kofam_scan, accessed on 3 July 2022). To identify carbohydrate-active enzymes (CAZys), the hmmer v3.2.1 (Yu et al. Reference Yu, Lee and Kim2012) was utilized to search the CAZy database (Nguyen et al. Reference Nguyen, Freund and Kasanjian2018). The relative abundances of KO and CAZys were derived from the relative abundances of the genes.
The assembly contigs were binned using the MetaBAT v2 (Kang et al. Reference Kang, Li and Kirton2019). The metagenome-assembled genomes (MAGs) were dereplicated with dRep v2.0 (Olm et al. Reference Olm, Brown and Brooks2017), ensuring that only those with completeness greater than 80% and contamination less than 10% were selected for further taxonomic annotation against GTDB v214 (Chaumeil et al. Reference Chaumeil, Mussig and Hugenholtz2019).
Statistical analyses
Rumen concentrations of VFA and non-VFA organic acids were compared between HLDG and LLDH groups using t-tests. As most of the data from metagenomics did not follow a normal distribution, we employed the DESeq2 method for statistical analysis, which is commonly used in omics analysis and is based on negative binomial generalized linear models (Love et al. Reference Love, Huber and Anders2014). An independent hypothesis weighting method was used for the adjustment of DESeq2 results (Ignatiadis et al. Reference Ignatiadis, Klaus and Zaugg2016). The intergroup differences in overall microbial composition were evaluated using the adonis2 function in the vegan package (Dixon Reference Dixon2003), based on the Bray–Curtis dissimilarity matrix (Bray and Curtis Reference Bray and Curtis1957), with 9999 permutations set. All statistical analyses were conducted in R v4.2.2 (https://www.r-project.org/). A level of P ≤ 0.05 was set to indicate significant differences, while 0.05 < P ≤ 0.10 was considered indicative of a tendency.
Results
Selection for lambs with divergent bacterial ldh abundance in rumen based on the PICRUST approach
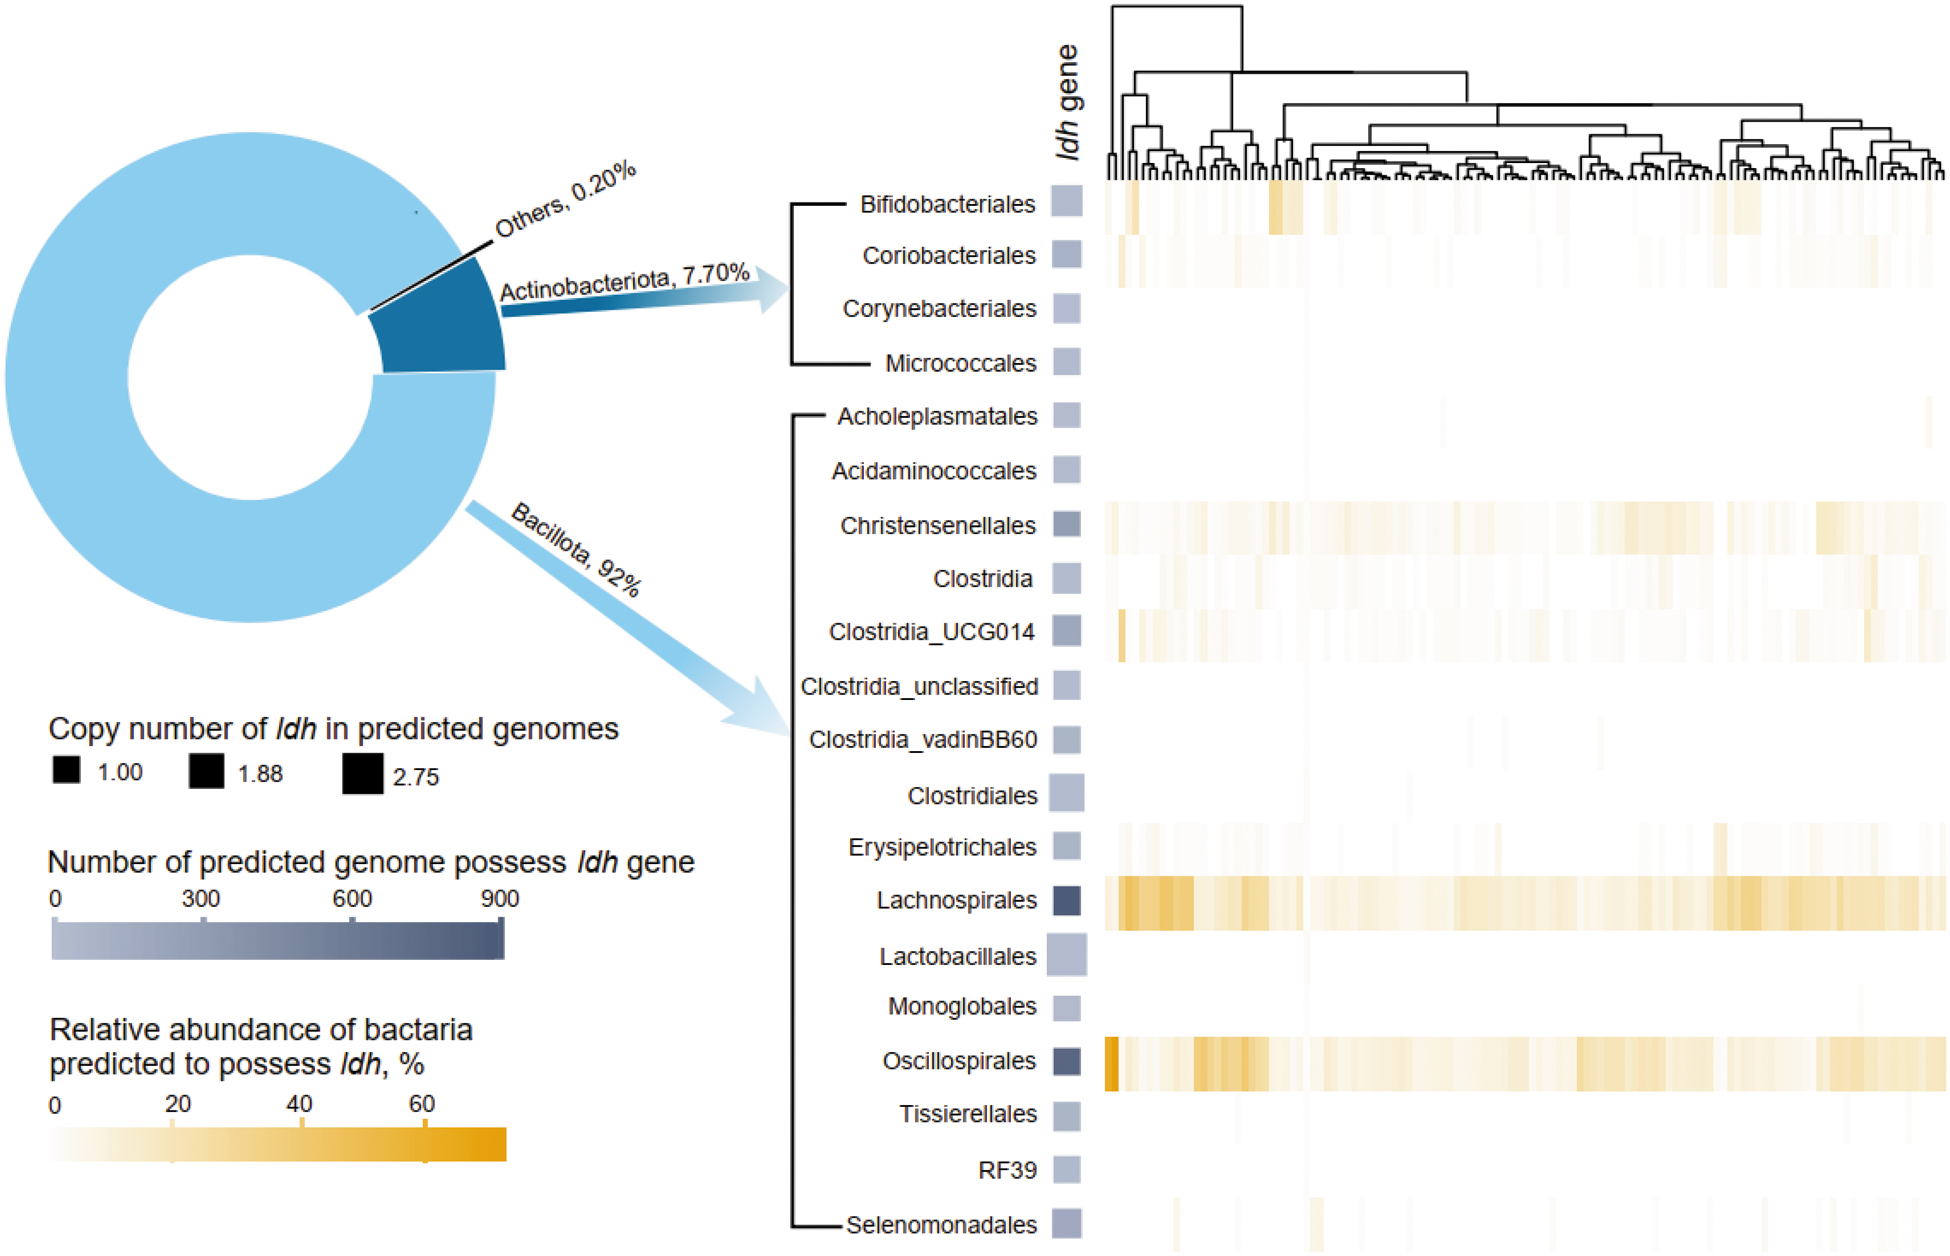
After quality control, a total of 5,796,612 16S rRNA gene amplicon sequences were obtained from the 121 initial lambs, averaging 47,905 sequences per lamb (Table S1). Following denoising clustering, 6470 ZOTUs were identified, with 3114 predicted to contain the ldh gene, primarily distributed within Bacillota (92.0%) and Actinobacteriota (7.70%) (Fig. 2). The bacterial orders Lachnospirales and Oscillospirales exhibited the highest copy numbers of the ldh gene in the predicted bacterial genomes. Predominant ldh-containing bacteria were identified as Lachnospirales, Oscillospirales, Cristesenellales, Clostridia_UCG014, and Bifidobacteriales at the order level.
High and low bacterial ldh gene abundance in the rumen of lambs selected based on 16S rRNA gene amplicon sequencing. Pie chart representing the distribution of ldh gene primarily in the genomes of Bacillota and Actinobacteriota, as predicted by Picrust2. The heatmap depicts the relative abundance of orders of Firmicutes and Actinobacteriota predicted to have ldh gene across all 121 lambs. The lambs were clustered based on the distribution of bacteria predicted to containing ldh gene.
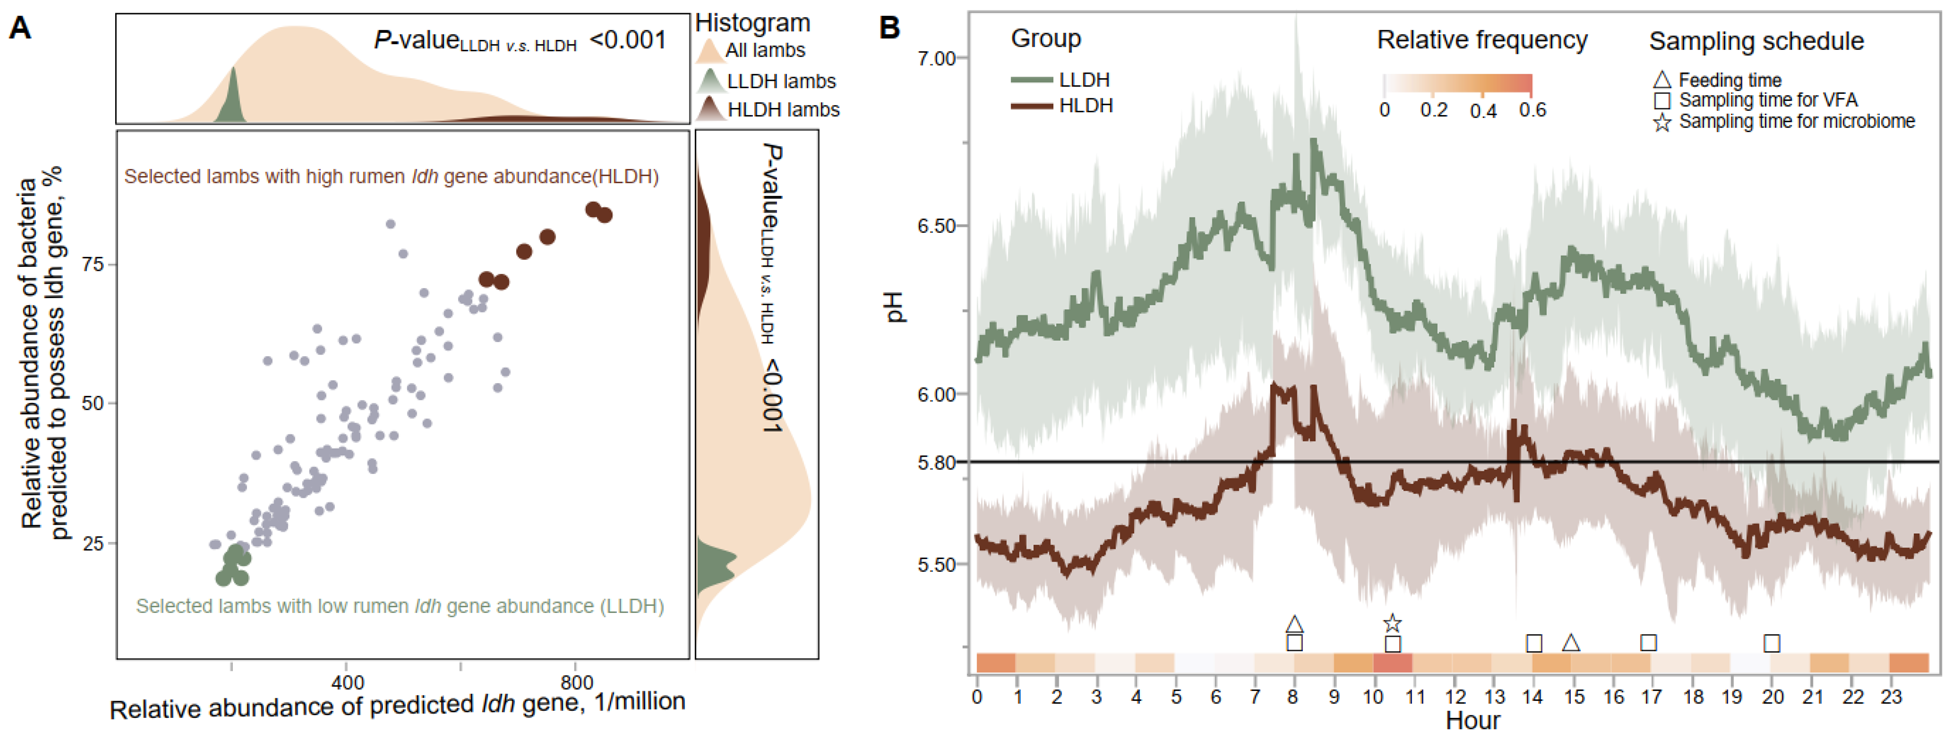
Figure 2 Long description
The image consists of two graphs labeled A and B. Graph A is a scatter plot with a histogram overlay. The horizontal axis represents the relative abundance of the predicted ldh gene, ranging from 0 to 1 million. The vertical axis shows the relative abundance of bacteria predicted to possess the ldh gene, in percentage. Data points are plotted for selected lambs with high and low rumen ldh gene abundance, labeled as HLDH and LLDH, respectively. The histogram above and to the right of the scatter plot shows the distribution of all lambs, LLDH lambs and HLDH lambs. P-values are indicated as less than 0.001. Graph B is a line graph displaying pH levels over a 24-hour period. The horizontal axis represents the hour of the day from 0 to 23. The vertical axis shows pH levels ranging from 5.0 to 7.0. Two lines represent LLDH and HLDH groups, with relative frequency indicated by shading. Sampling schedules are marked with symbols for feeding time, sampling time for VFA and sampling time for microbiome. The graph shows fluctuations in pH levels throughout the day for both groups.
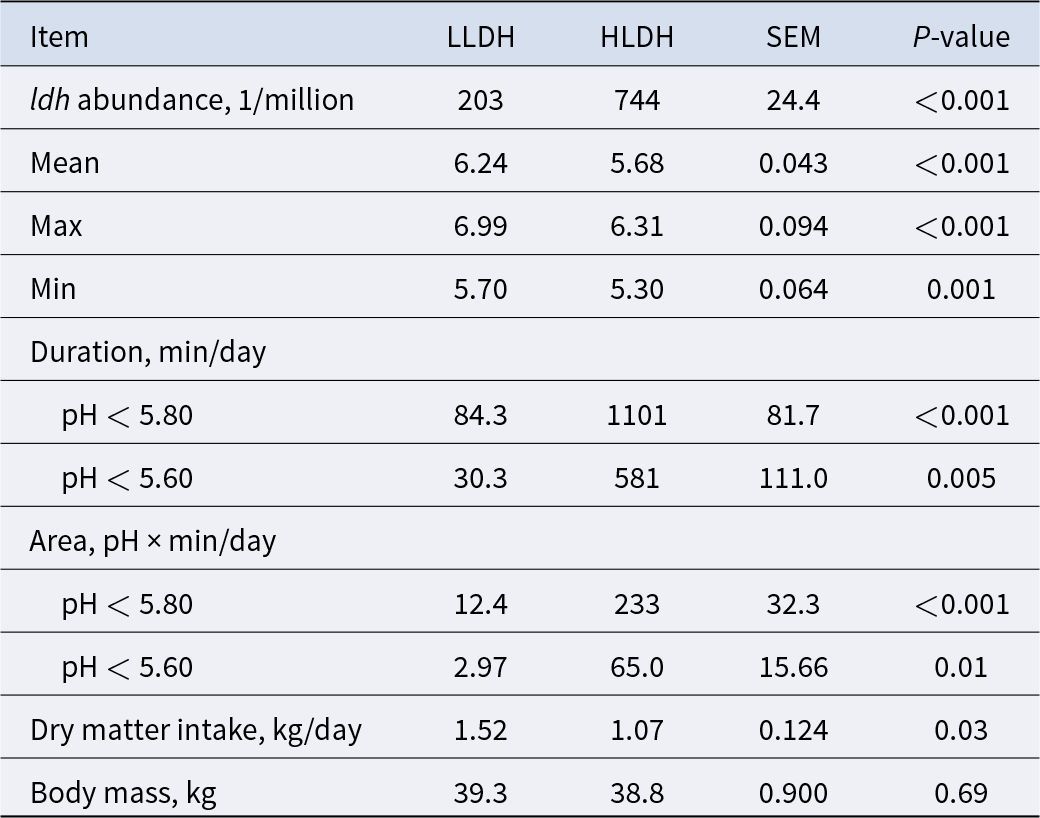
We selected the bottom and the top six lambs based on the predicted relative abundance of the ldh gene as LLDH and HLDH lambs, respectively (P < 0.001, Table 1 and Fig. 1A). Principal coordinate analysis revealed differences between the two groups in the bacterial community composition (P < 0.001, Fig. S1), with the LLDH lambs being closer to the majority of individuals, while the HLDH lambs deviated more from the majority.
Rumen pH and dry matter intake in lambs with low (LLDH) and high (HLDH) rumen bacterial ldh gene abundance (n = 6)
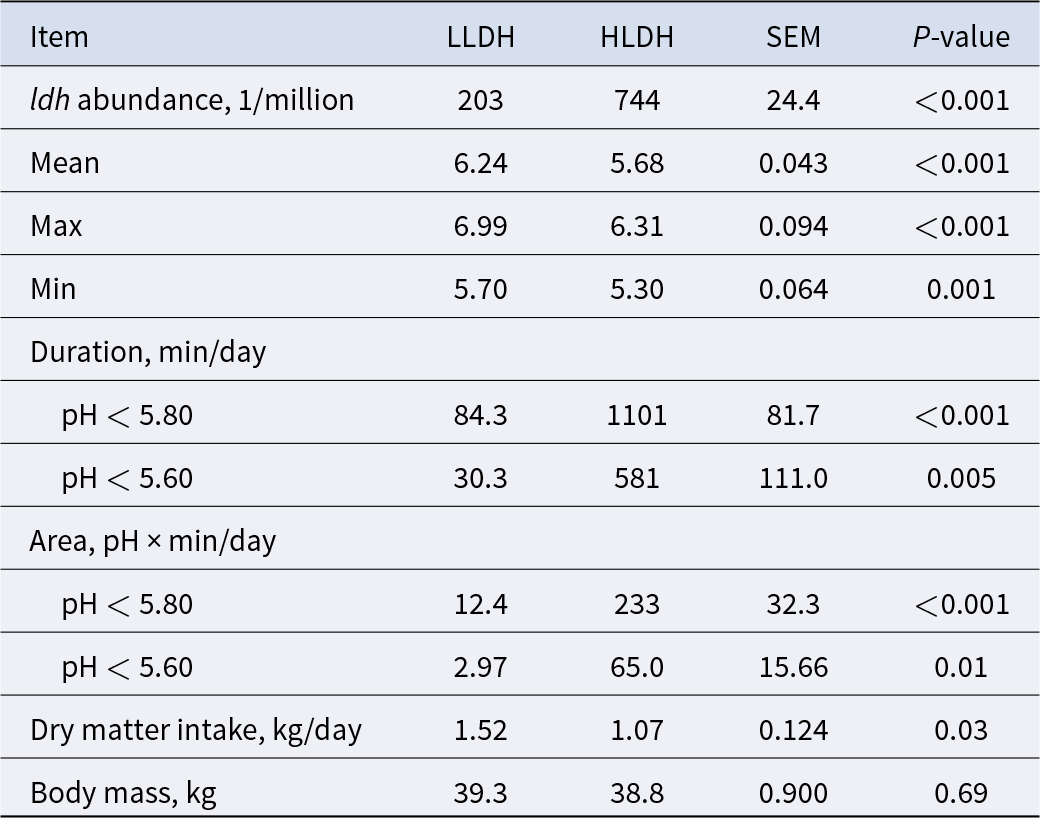
Table 1 Long description
Rumen pH and dry matter intake are intended to be reported for two groups of lambs classified by low versus high rumen bacterial ldh gene abundance, with six lambs per group. The purpose is to compare acidity in the rumen and feed intake between these two ldh abundance categories. No numeric entries, units, summary statistics, or variability measures are included in the provided table content, so differences between groups cannot be determined. If the full table includes means and spread, interpret group differences cautiously given the small sample size per group.
Fermentation variables of lambs with divergent bacterial ldh abundance in rumen
Continuous monitoring of rumen pH over 48 h revealed differences between the two groups in rumen pH expressed as mean, max, and min (P ≤ 0.01, Table 1 and Fig. 1B). The rumen pH of HLDH lambs exhibited an average duration of pH < 5.8 of 1101 min/day, compared to 84.3 min/day for the rumen pH of LLDH lambs. Additionally, HLDH lambs had a 29.6% lower DM intake compared to LLDH lambs (P = 0.03).
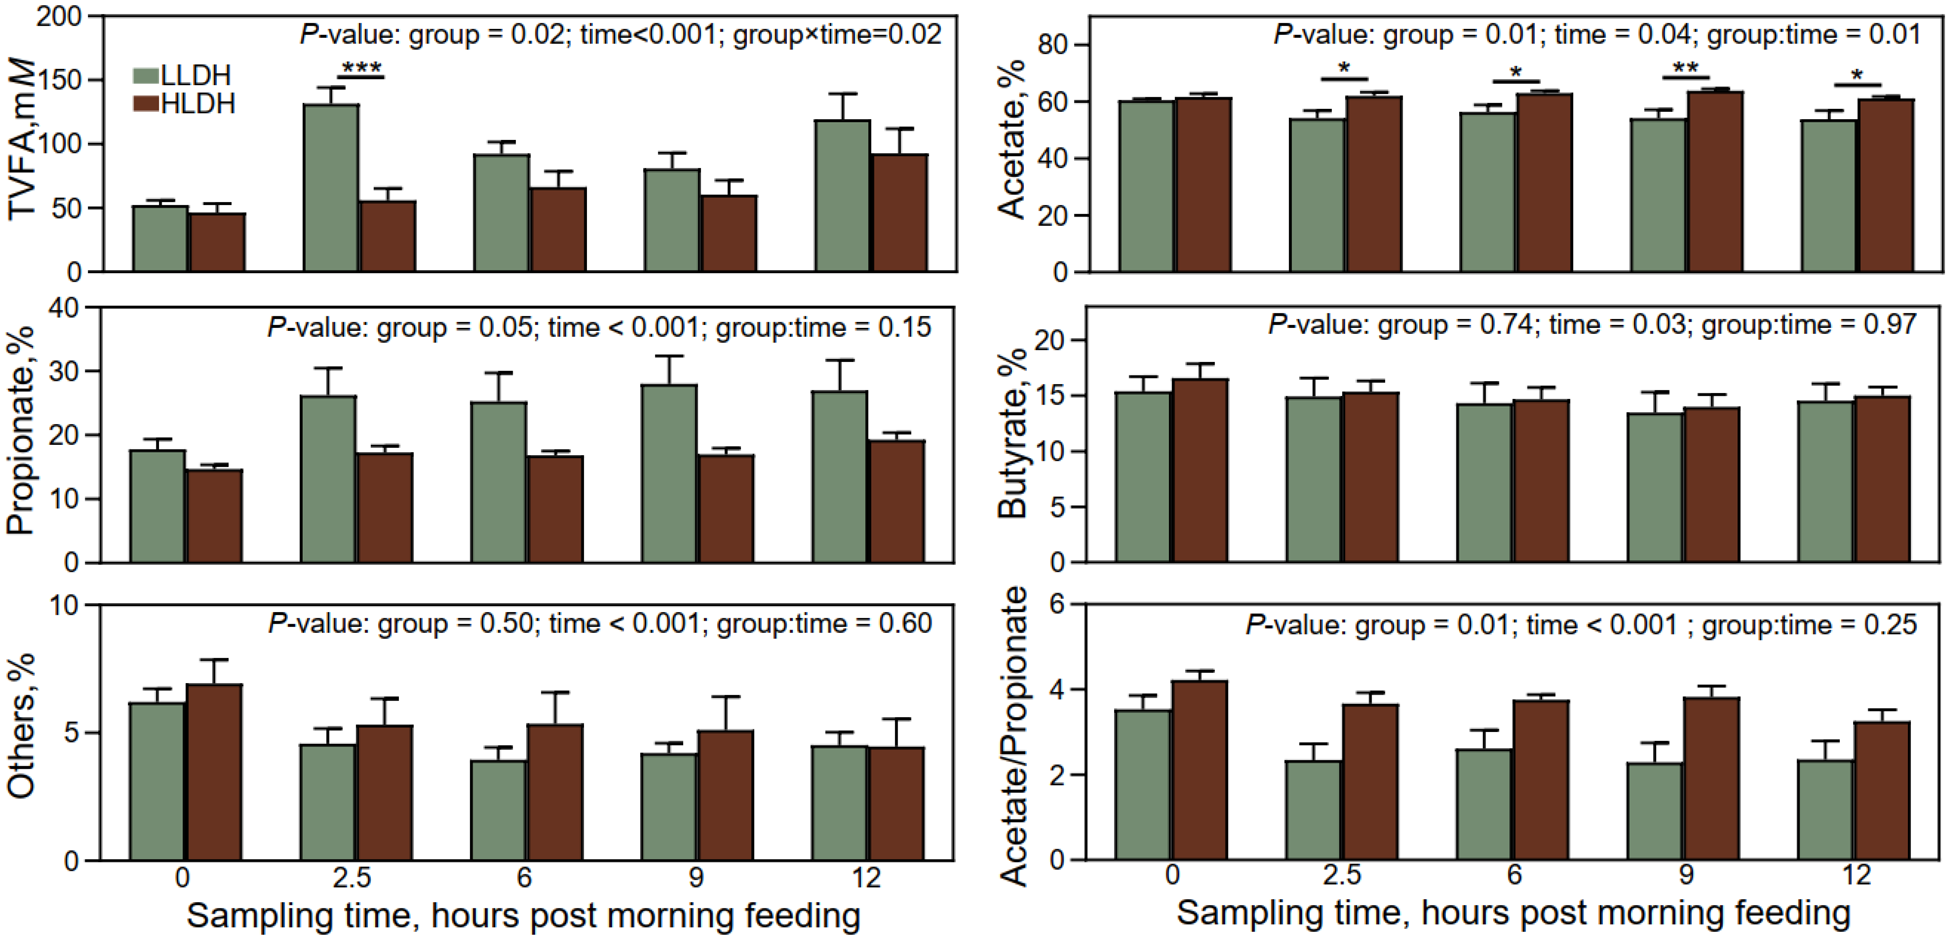
Lambs’ group and time of sampling interacted on TVFA concentration and molar percentage of acetate (P ≤ 0.02, Fig. 3). The concentration of TVFA was lower in the rumen of HLDH lambs compared to LLDH lambs at 2.5 h post-morning feeding (P = 0.02) but at no other time points (P ≥ 0.12). The molar proportion of acetate was higher in the rumen of HLDH lambs at 2.5, 6, 9, and 12 h post-morning feeding (P ≤ 0.04), although no statistically significant difference was observed immediately before feeding (P = 0.35). The acetate to propionate ratio was higher (P = 0.01) in the rumen of HLDH lambs compared to LLDH lambs.
Volatile fatty acids profile at different sampling times in the rumen of lambs with low (LLDH) and high (HLDH) ldh gene. Error bars represent SE. *0.01 < P ≤ 0.05, **0.001 < P ≤ 0.01, ***P < 0.001.
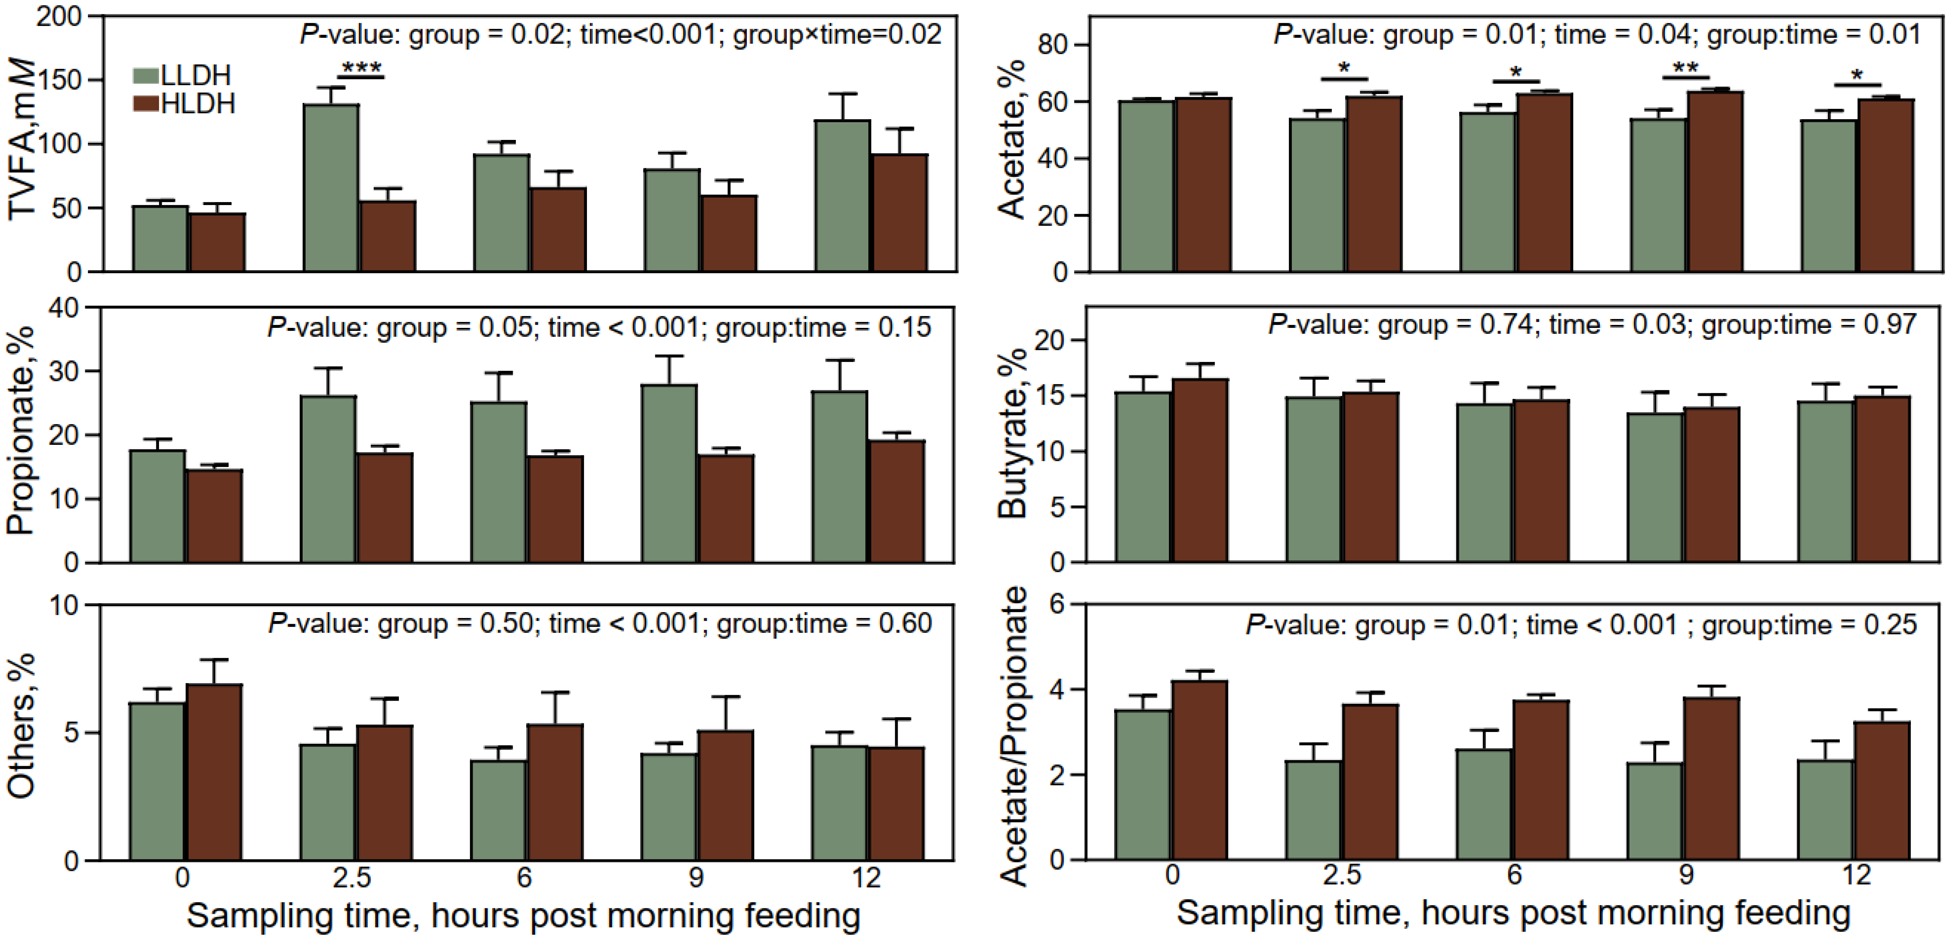
Figure 3 Long description
Image A consists of six bar graphs arranged in three rows and two columns, each comparing two groups labeled LLDH and HLDH across sampling times. Top-left graph text: “P-value: group = 0.02; time<0.001; group×time=0.02”. Vertical axis label: “TVFA,mM”. Vertical axis range: 0 to 200. Horizontal axis categories: 0, 2.5, 6, 9, 12. Bars (LLDH, HLDH) by sampling time: 0 (about 50, about 45); 2.5 (about 130, about 55) with “asterisk asterisk asterisk” above; 6 (about 95, about 70); 9 (about 85, about 60); 12 (about 120, about 95). Top-right graph text: “P-value: group = 0.01; time = 0.04; group:time = 0.01”. Vertical axis label: “Acetate,%”. Vertical axis range: 0 to 80. Horizontal axis categories: 0, 2.5, 6, 9, 12. Bars (LLDH, HLDH) by sampling time: 0 (about 60, about 61); 2.5 (about 55, about 62) with “asterisk” above; 6 (about 56, about 64) with “asterisk” above; 9 (about 55, about 65) with “asterisk asterisk” above; 12 (about 54, about 61) with “asterisk” above. Middle-left graph text: “P-value: group = 0.05; time < 0.001; group:time = 0.15”. Vertical axis label: “Propionate,%”. Vertical axis range: 0 to 40. Horizontal axis categories: 0, 2.5, 6, 9, 12. Bars (LLDH, HLDH) by sampling time: 0 (about 18, about 15); 2.5 (about 27, about 18); 6 (about 26, about 17); 9 (about 29, about 17); 12 (about 28, about 20). Middle-right graph text: “P-value: group = 0.74; time = 0.03; group:time = 0.97”. Vertical axis label: “Butyrate,%”. Vertical axis range: 0 to 20. Horizontal axis categories: 0, 2.5, 6, 9, 12. Bars (LLDH, HLDH) by sampling time: 0 (about 15, about 16); 2.5 (about 15, about 15); 6 (about 14, about 14); 9 (about 13, about 14); 12 (about 14, about 15). Bottom-left graph text: “P-value: group = 0.50; time < 0.001; group:time = 0.60”. Vertical axis label: “Others,%”. Vertical axis range: 0 to 10. Horizontal axis label: “Sampling time, hours post morning feeding”. Horizontal axis categories: 0, 2.5, 6, 9, 12. Bars (LLDH, HLDH) by sampling time: 0 (about 6, about 7); 2.5 (about 4.5, about 5.5); 6 (about 4, about 5.5); 9 (about 4, about 5); 12 (about 4.5, about 4.5). Bottom-right graph text: “P-value: group = 0.01; time < 0.001; group:time = 0.25”. Vertical axis label: “Acetate/Propionate”. Vertical axis range: 0 to 6. Horizontal axis label: “Sampling time, hours post morning feeding”. Horizontal axis categories: 0, 2.5, 6, 9, 12. Bars (LLDH, HLDH) by sampling time: 0 (about 3.5, about 4.2); 2.5 (about 2.3, about 3.7); 6 (about 2.6, about 3.8); 9 (about 2.2, about 3.9); 12 (about 2.4, about 3.3).
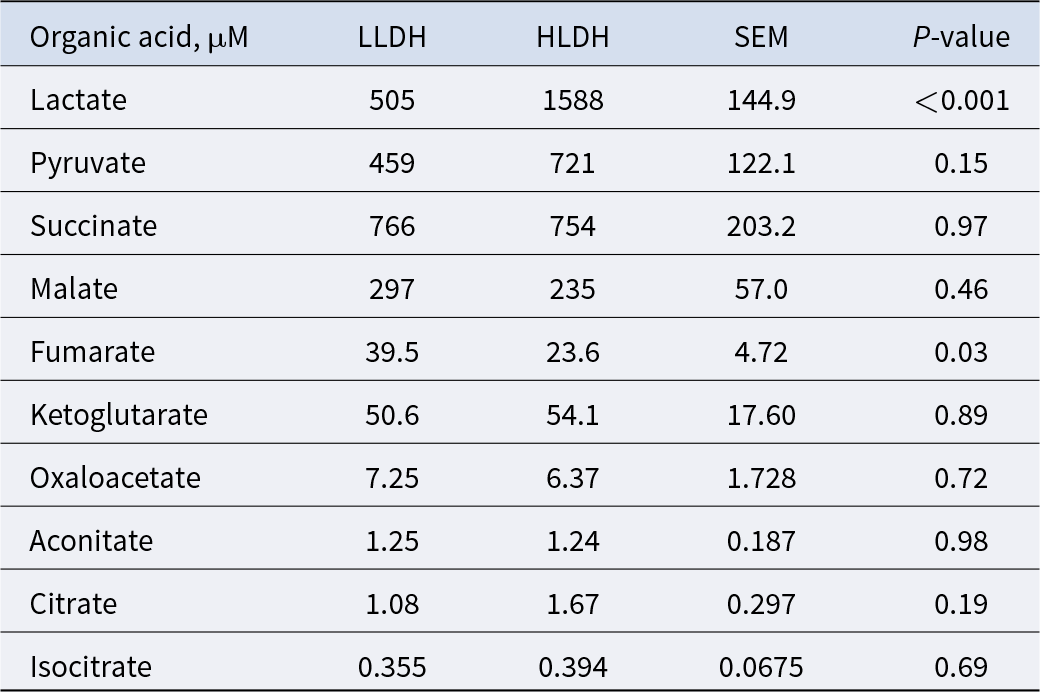
Lactate concentration in the rumen of HLDH lambs was 214% higher than the rumen of the LLDH lambs (P < 0.001, Table 2). The concentration of fumarate was lower in the rumen of HLDH lambs than in the rumen of LLDH lambs (P = 0.03). The remaining eight non-VFA organic acids showed no statistically significant intergroup differences (P ≥ 0.15).
Concentrations of rumen non-VFA organic acids in rumen of lambs with low (LLDH) and high (HLDH) ldh gene abundance (n = 6)
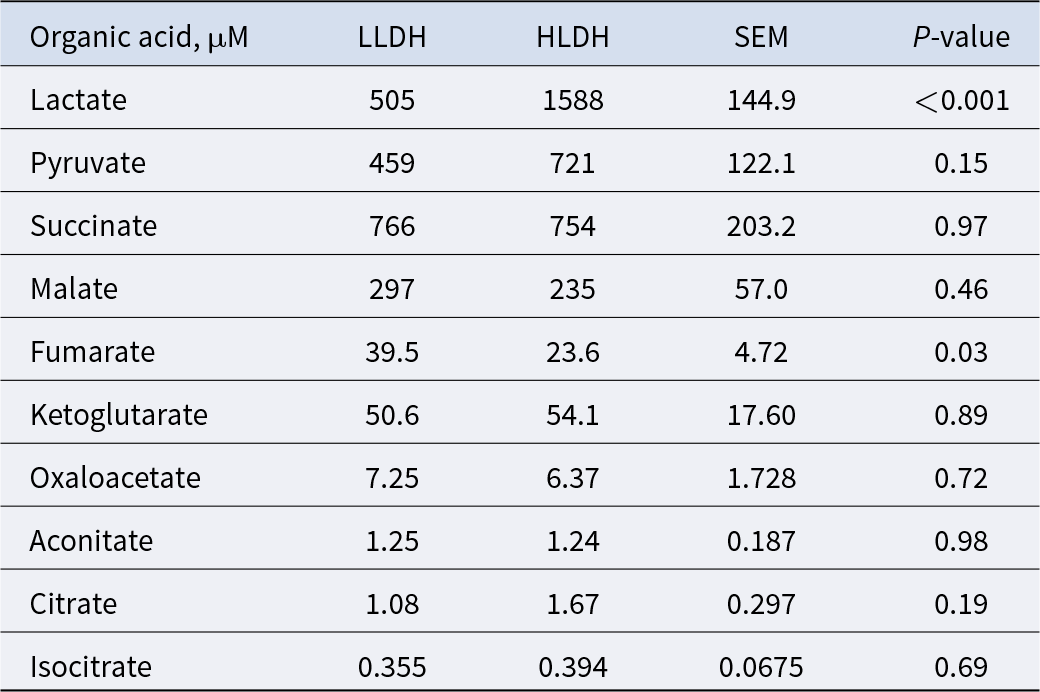
Table 2 Long description
Rumen non-VFA organic acid concentrations are intended to be reported for two lamb groups defined by low versus high ldh gene abundance, with six animals per group. The table would normally list each organic acid and provide group values to support side-by-side comparison. No numeric entries or acid names are included in the provided table data, so specific concentrations, variability, and between-group differences cannot be summarized. Because the underlying values are missing, no trend, ranking of acids, or interpretation about effects of ldh abundance can be confirmed from this table.
Metagenomic composition of lambs with divergent bacterial ldh abundance in the rumen
After quality control of metagenomic sequencing, a total of 515,770,238 short sequences were obtained, with an average of 42,980,853 short sequences per sample. The average number of short sequences obtained per sample in LLDH lambs was 50,913,323 and tended to be higher than the 35,048,383 short sequences per sample observed in the HLDH lambs (P = 0.055, Table S2).
After annotating the short sequences with taxonomic labels against the Silva v138 rRNA database, a total of 1,521,307 short sequences were labeled, representing 0.29% of the total number of short sequences (Table S2). There was a trend toward 28.8% less rRNA gene sequences in rumen of HLDH lambs compared to LLDH lambs (P = 0.09, Table S2).
The taxonomic results of the rRNA gene sequences are presented in the Additional File 1. At the domain level, Eukaryota abundance in the rumen of HLDH lambs was higher than that in LLDH lambs, while total Bacteria in the rumen of HLDH lambs was less abundant compared to LLDH lambs (P ≤ 0.05), and total archaea abundance was statistically similar between both groups (P = 0.93). At the genus level, six taxa exhibited intergroup differences (P ≤ 0.05), while eight taxa showed trends of intergroup differences (0.05 < P ≤ 0.10). Specifically, Lactobacillus tended to be lower in the rumen of HLDH lambs compared to LLDH lambs (P = 0.10).
A total of 5,554,039 genes were obtained from the metagenomic sequences, with 93.9% of the short sequences mapped to these genes (Table S2). Among these, 2,279,015 genes were annotated to 7248 KEGG orthologs. The results of the KEGG orthology analysis are presented in Additional File 2. None of the eight pathways at KEGG level 1 exhibited statistically intergroup differences (P ≥ 0.12). At KEGG level 2, five pathways had intergroup differences (P ≤ 0.02, Fig. S2 A). Relative abundance of genes of carbohydrate metabolism was lower in the rumen of HLDH lambs than in the rumen of LLDH lambs (P = 0.01). Specifically, at level 3 of carbohydrate metabolism, the fructose and mannose metabolism pathway and the glyoxylate and dicarboxylate metabolism pathway were lower in the rumen of HLDH lambs compared to LLDH lambs (P ≤ 0.04). The primary contributors to the carbohydrate metabolism pathways in the rumen were Bacteroidota (43.4%), Bacillota (17.2%), Pesudomonadota (13.8%), and Actinomycetota (6.19%, Fig. S2 B).
The CAZy family analysis results are presented in Additional File 3. It was observed that the glycoside hydrolase (GH) family tended to be lower, while the GT family tended to be higher in the rumen of HLDH lambs compared to that of LLDH lambs (P ≤ 0.07, Fig. S2 C). The primary contributors to the GH family in the rumen were Bacteroidota (17.3%), Bacillota (17.2%), Pesudomonadota (16.5%), and Actinomycetota (16.1%, Fig. S2 D).
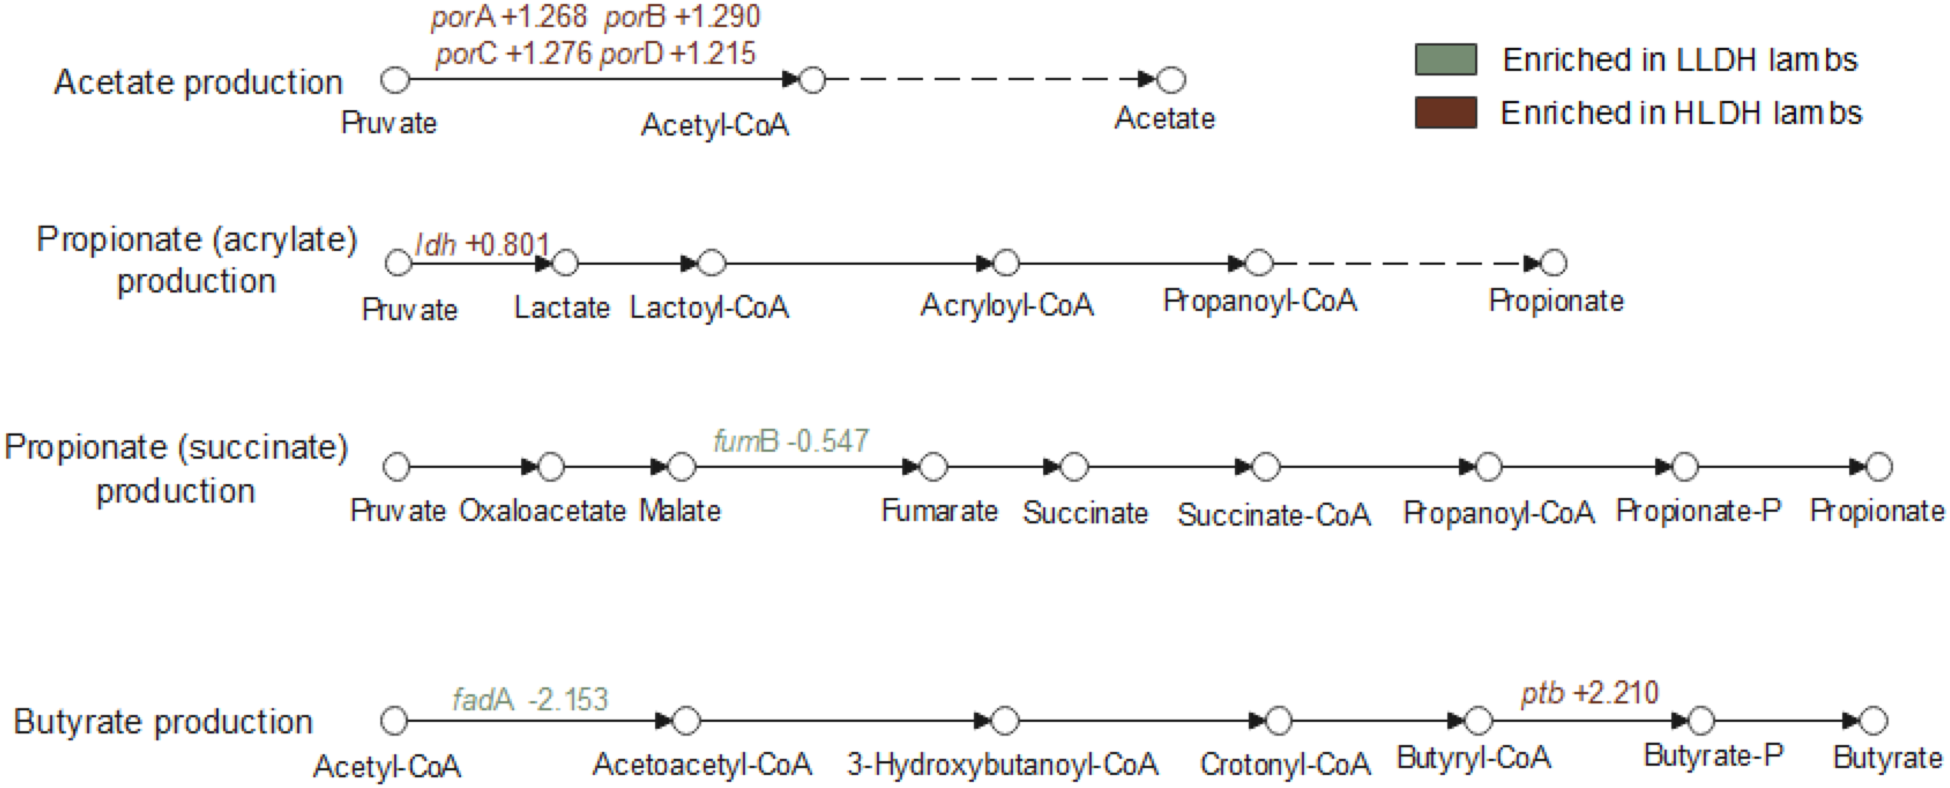
The genes involved in the production of major VFA are presented in Additional File 4 and Fig. S3. In the acetate production pathway, the genes encoding for pyruvate ferredoxin oxidoreductase (porA, porB, porC, and porD; Fig. 4) had a greater relative abundance in the rumen of HLDH lambs (P ≤ 0.001). The ldh gene was higher in the rumen of HLDH lambs compared to LLDH lambs (P = 0.01). No statistically significant differences between the groups were observed in the relative abundance of genes responsible for the conversion of lactate to propionate in the acrylate (or non-randomizing) pathway (P ≥ 0.12). In the propionate succinate (or randomizing) production pathway, the gene encoding for fumarate hydratase subunit beta (fumB) tended toward a lower relative abundance in HLDH lambs (P = 0.07). The gene encoding for acetyl-CoA acyltransferase (fadA), involved in the butyrate production pathway, was found to be less abundant in HLDH lambs (P = 0.04), while gene encoding for phosphate butyryltransferase (ptb) was more abundant in HLDH lambs (P = 0.04).
Genes involved in bacterial pathways of lactate metabolism and major volatile fatty acid production in the rumen of lambs with low (LLDH) and high (HLDH) ldh gene abundance. Significant intergroup gene variations are indicated in the figure, with the numerical values representing log2(HLDH/LLDH).
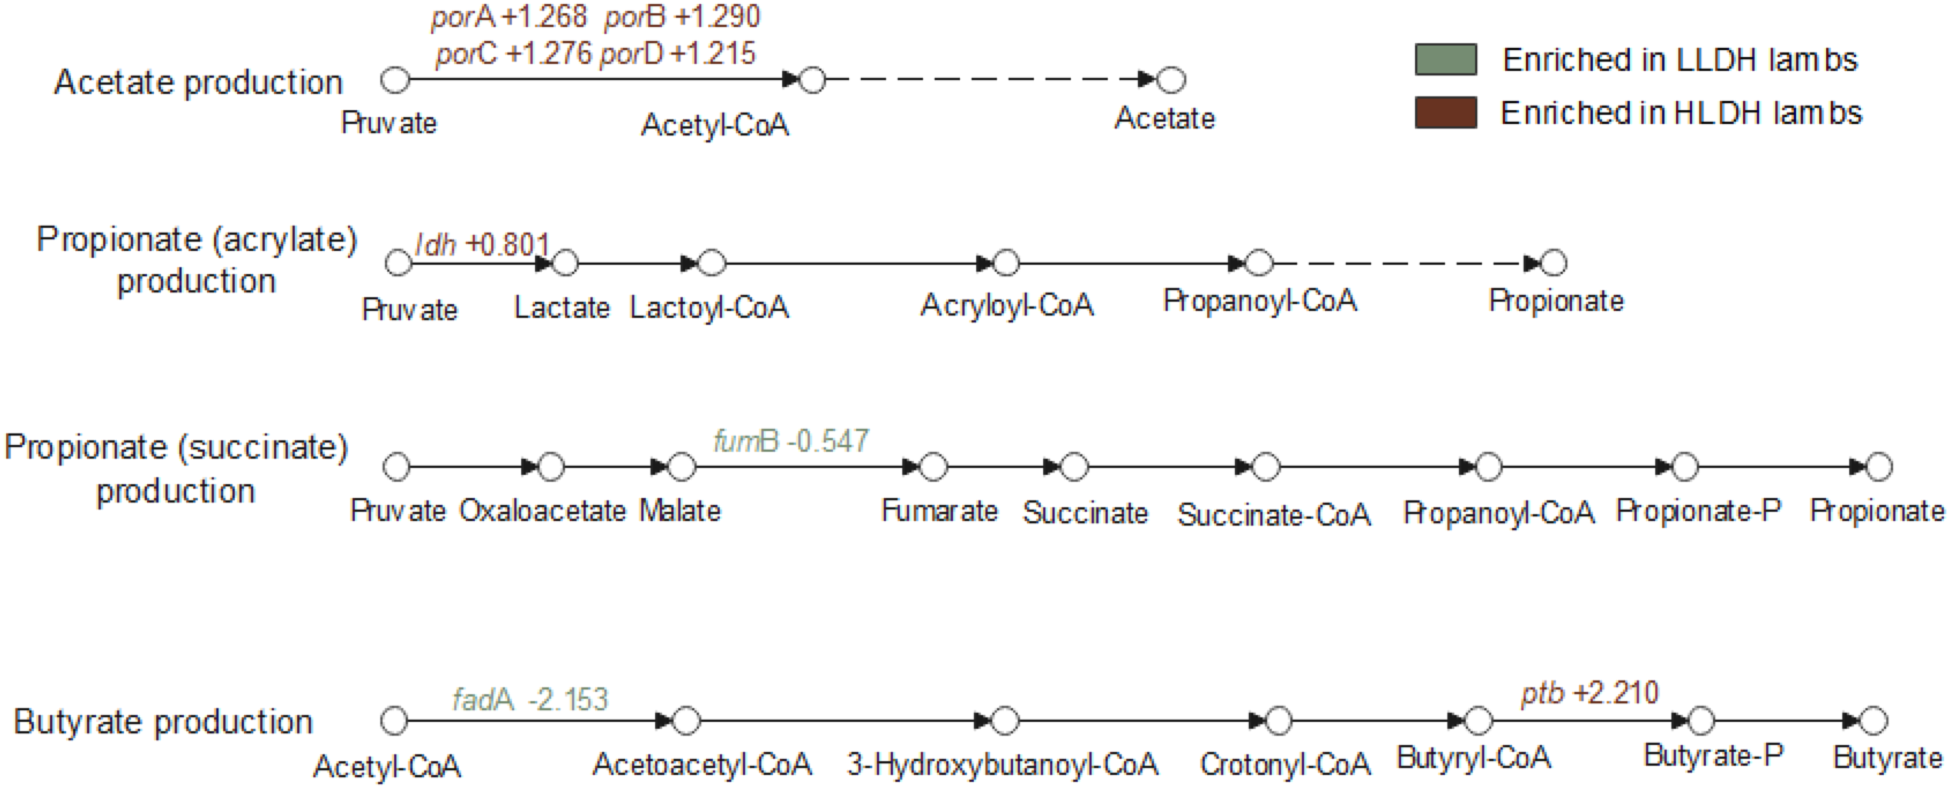
Figure 4 Long description
Pathways for volatile fatty acid production in lambs, highlighting acetate, propionate and butyrate production. The acetate production pathway starts with pyruvate converting to acetyl-CoA and then to acetate, with genes porA, porB, porC and porD enriched in HLDH lambs. The propionate (acrylate) pathway involves pyruvate converting to lactate, lactoyl-CoA, acryloyl-CoA, propanoyl-CoA and finally propionate, with the ldh gene enriched in HLDH lambs. The propionate (succinate) pathway includes pyruvate converting to oxaloacetate, malate, fumarate, succinate, succinate-CoA, propanoyl-CoA, propionate-P and propionate, with the fumB gene less abundant in HLDH lambs. The butyrate production pathway starts with acetyl-CoA converting to acetoacetyl-CoA, 3-hydroxybutanoyl-CoA, crotonyl-CoA, butyryl-CoA, butyrate-P and butyrate, with the fadA gene less abundant and the ptb gene more abundant in HLDH lambs. The diagram uses color coding to indicate gene enrichment in LLDH and HLDH lambs.
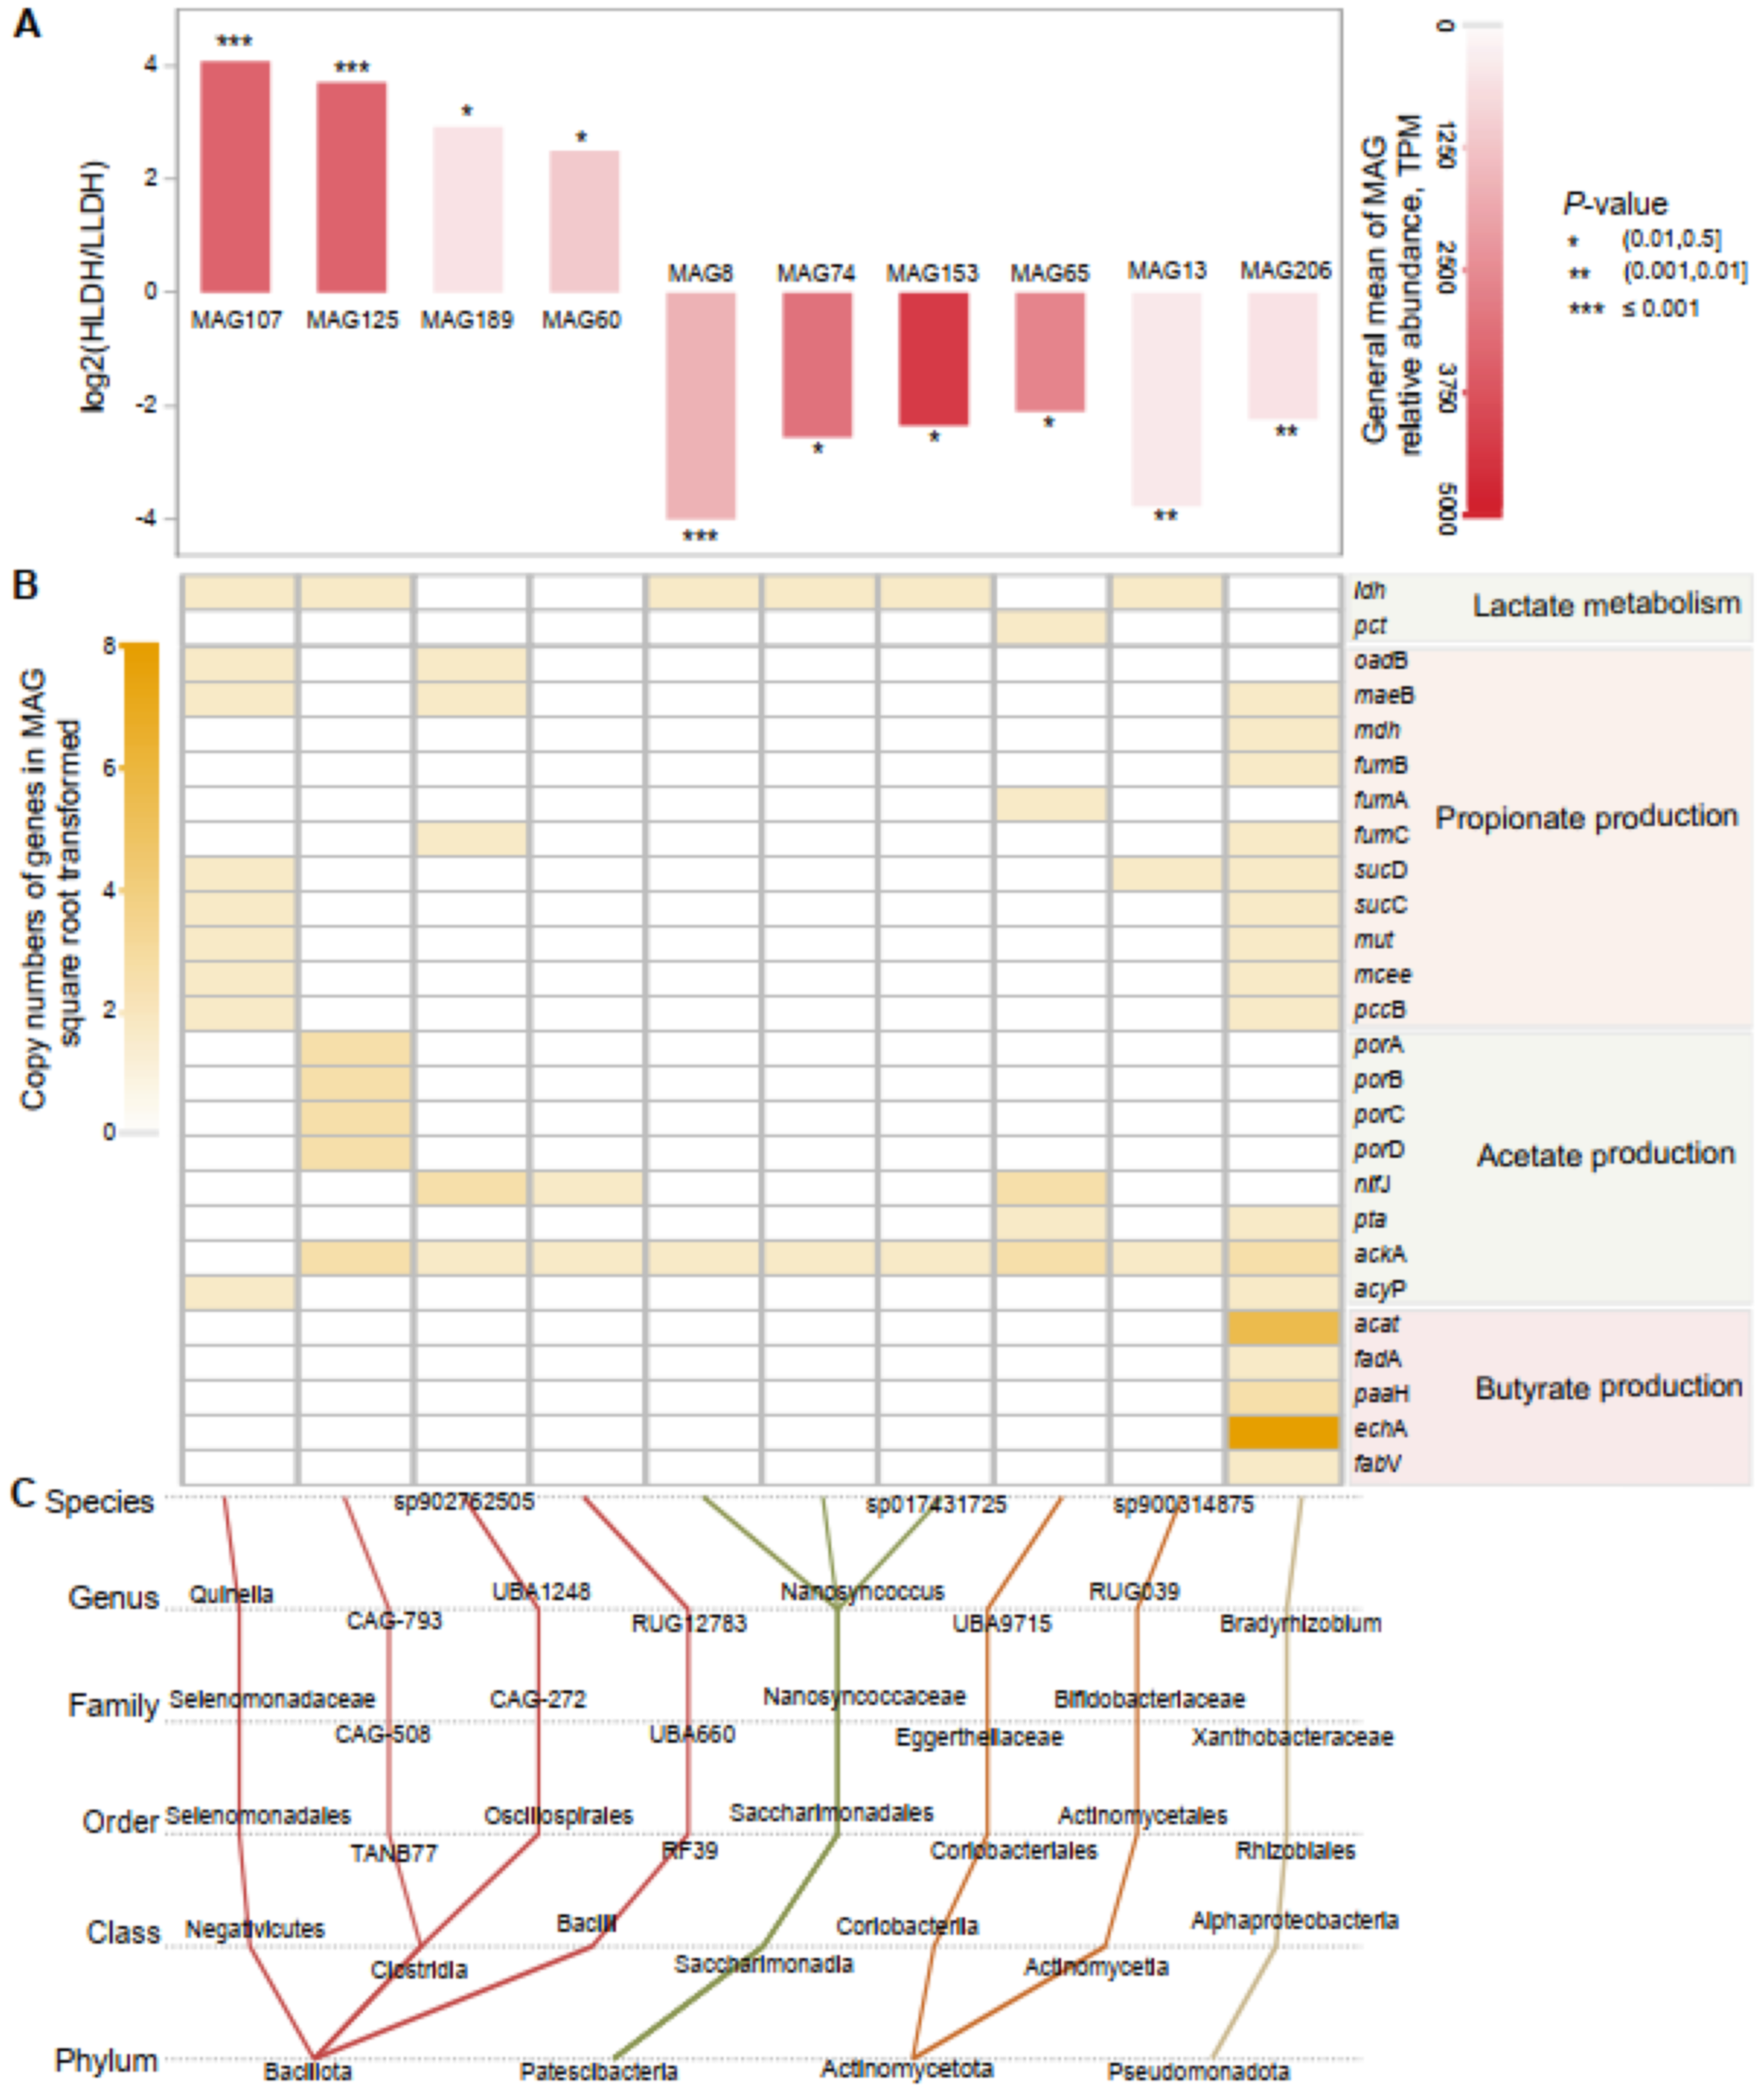
A total of 227 bacterial MAGs were obtained through binning (Additional File 5). Among these, 10 MAGs demonstrated intergroup differences (P ≤ 0.05, Fig. 5). Four MAGs belonging to the phylum Bacillota were more abundant in the rumen of HLDH lambs. Two of these MAGs, belonging to the genus Quinella and the putative genus CAG-793, possessed the ldh gene. Additionally, MAG125 from the putative genus CAG-793 harbored genes porA, porB, porC, and porD involved in acetate production. Meanwhile, the six MAGs that were less abundant in the rumen of HLDH lambs were affiliated with the phyla Patescibacteria (3), Actinomycetota (2), and Pseudomonadota (1). The MAG206 from the Pseudomonadota phylum possessed nine genes associated with propionate production.
Metagenome-assembled genomes (MAGs) in the rumen of lambs. (A) Comparison of the relative abundances of MAGs between LLDH lambs and HLDH lambs. (B) Distribution of genes related to lactate metabolism and major VFA production in the affected MAGs. (C) Taxonomic annotation information of the affected prokaryotic MAGs.
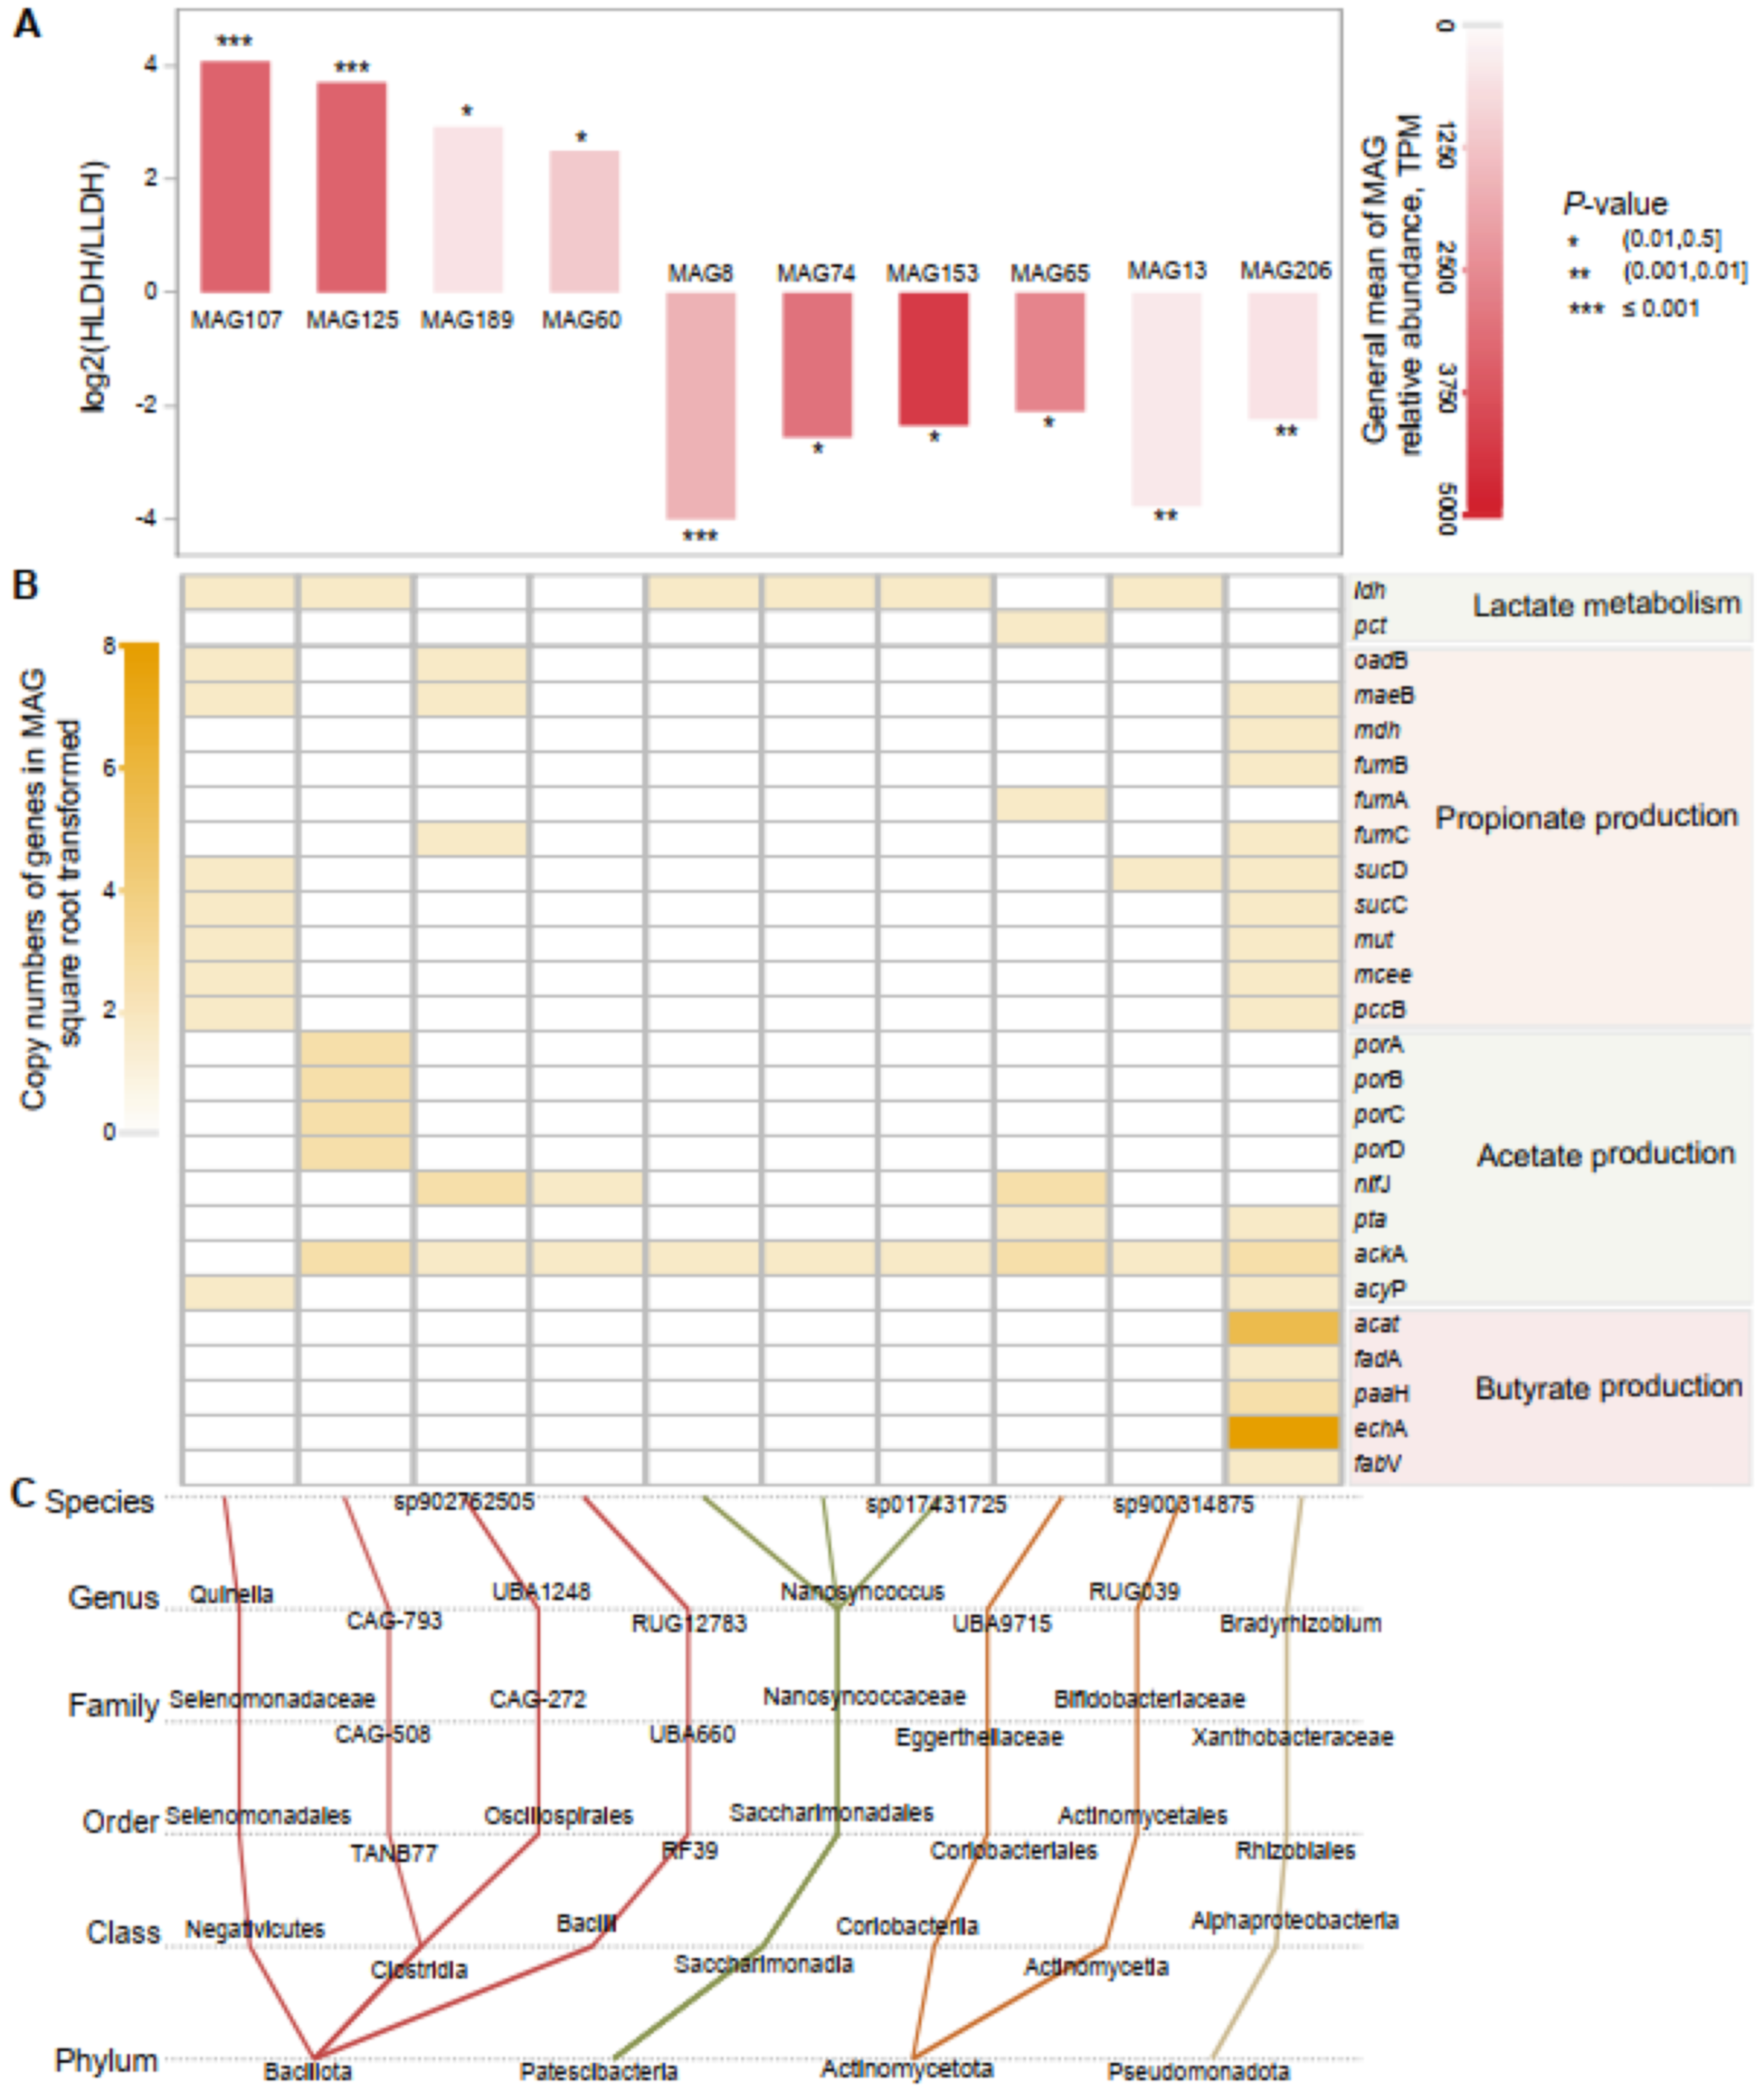
Figure 5 Long description
Three sections are presented: A, B and C. Section A shows a bar graph comparing the relative abundances of MAGs between LLDH and HLDH lambs, with MAG107, MAG125, MAG189 and MAG60 having positive log2 values and MAG8, MAG74, MAG153, MAG65, MAG13 and MAG206 having negative values. P-values are indicated by asterisks. Section B displays a heatmap of gene copy numbers related to lactate metabolism, propionate production, acetate production and butyrate production. Genes listed include ldh, pct, oadB, maeB, mdh, fumB, fumA, fumC, sucD, sucC, mut, mcee, pccB, porA, porB, porC, porD, nifJ, pta, ackA, acyP, acat, fadA, paaH, echA and fabV. Section C illustrates taxonomic annotation information of affected prokaryotic MAGs, showing connections between species, genus, family, order, class and phylum. Notable genera include Quinella and CAG-793, with phyla Bacillota, Patescibacteria, Actinomycetota and Pseudomonadota represented.
Discussion
The rumen metabolic disorder of animals experiencing SARA has been widely investigated, and its causes, symptoms, and consequences are well described and understood (Nikvand et al. Reference Nikvand, Nouri and Gharibi2023). However, identifying possible rumen biomarkers that could predict the susceptibility of individual animals to develop SARA remains a key focus and major challenge. A SARA biomarker could identify individuals susceptible to develop SARA, aiding in early intervention to mitigate or even prevent the occurrence of SARA through offering susceptible animals less fermentable diets. The main finding of this work is that two groups of lambs could be differentiated in their proneness to develop SARA based on the rumen relative abundance of the ldh gene.
Among 538 bacterial strains isolated from the rumen in the Hungate1000 project, 48.8% were found to have the ability to produce lactate (Seshadri et al. Reference Seshadri, Leahy and Attwood2018). Expanding upon this finding, we employed the PICRUST approach to analyze 6470 predicted bacterial genomes derived from rumen samples. Remarkably, our results showed that 48.5% of these predicted genomes harbored the ldh gene responsible for lactate production, aligning very closely with the culture-based findings (Seshadri et al. Reference Seshadri, Leahy and Attwood2018). Lactobacillales and Bifidobacteriales, specifically Lactobacillus and Bifidobacterium, are understood to be the primary producers of lactate in the gastrointestinal tract of human (Belenguer et al. Reference Belenguer, Duncan and Holtrop2007; Ma et al. Reference Ma, Yao and Shen2021). However, our investigation using metagenomics revealed different most abundant lactate producers in the rumen, predominantly belonging to the orders Lachnospirales and Oscillospirales. This finding indicates that relying solely on Lactobacillales to characterize rumen lactate-producing capacity in ruminants may be insufficient.
Key rumen indicators strongly support that the observed metabolic disturbances of HLDH lambs were SARA rather than lactic acidosis. Rumen lactate concentration in HLDH lambs was substantially lower than that observed in typical cases of rumen lactic acidosis, which could be attributed to the gradual adaptation to the barley-rich diet, thereby minimizing the risk of a sudden, excessive production of lactate (Pinto et al. Reference Pinto, Bertoldi and Felizari2020). The rumen pH noted in HLDH lambs, including the minimum pH and the duration and area under the curve of pH values below the critical thresholds for SARA, aligned with the proposed SARA thresholds of pH below 5.6 for more than 180 min/day (Gozho et al. Reference Gozho, Krause and Plaizier2006), or below pH 5.8 for more than 315 min/day (Zebeli et al. Reference Zebeli, Dijkstra and Tafaj2008), rather than the lactic acidosis threshold of a minimal ruminal pH < 5.0 (Counotte and Prins Reference Counotte and Prins1978).
We employed the random frog method (Li et al. Reference Li, Xu and Liang2012) to select rumen samples collected 2.5 h post-morning feeding as those that best represented the individual SARA risk for subsequent metagenomic analysis. The metagenomics results revealed a higher ldh abundance in the rumen of HLDH lambs, thus confirming the previous predictions from the PICRUST approach previously used to screen the larger initial population of 121 lambs. Previous studies reported that the increase in Streptococcus bovis in high-starch-induced SARA individuals led to elevated rumen lactate concentration (Russell and Hino Reference Russell and Hino1985; Russell and Robinson Reference Russell and Robinson1984). However, our study found no intergroup differences in the relative abundance of Streptococcus spp., suggesting that Streptococcus spp. not always be the main bacterium responsible for increased lactate in the rumen. Bacillota was identified as the primary contributor to the increased abundance of ldh in the rumen of HLDH lambs, aligning with the PICRUST approach results based on amplicons. A previous study also found that Bacillota was enriched in the rumens of SARA-susceptible sheep (Zhang et al. Reference Zhang, Li and Ma2023). MAG analysis identified MAG107, an uncultured bacterium within phylum Bacillota, belonging to the genus Quinella, as a genome possessing the ldh gene with greater relative abundance in HLDH lambs. The relative abundance of this genus has been reported to increase in the rumen of animals fed high-molasses or small particle grain, both of which are a cause of SARA (Andres et al. Reference Andres, Jaramillo and Mateo2019). No strains of Quinella have been axenically cultivated to date. Metagenomic analysis of the encoded proteins indicates that lactate and propionate formation via succinate pathway are major fermentation pathways of Quinella (Kumar et al. Reference Kumar, Altermann and Leahy2022). Highly enriched experiments have demonstrated that Quinella spp. produces lactate but is unable to degrade lactate or can do it at extremely slow rates (Krumholz et al. Reference Krumholz, Bryant and Brulla1993), a result consistent with our metagenomic findings. Another uncultured bacterium, MAG125, possessing the ldh gene and having a greater relative abundance in the rumen of HLDL lambs, belongs to the putative genus CAG-793|class Clostridia|phylum Bacillota. Our metagenomic analysis suggests that MAG125 lacks the ability to convert lactate to propionate or butyrate. The absence of these traits in these two Bacillota uncultured bacteria corresponds well with the observed accumulation of lactate in the rumen of HLDH lambs.
We observed less bacterial diversity in the rumen of HLDH lambs, which is consistent with the lower ruminal pH and reduced feed intake observed in HLDH lambs, as both factors can lead to a decrease in microbial diversity (Li et al. Reference Li, Xi and Wang2020). Archaea in the rumen are the primary consumers of dihydrogen during fermentation and are sensitive to low rumen pH (Janssen Reference Janssen2010). However, the relative abundance of archaea in the rumen of HLDH lambs did not change compared to LLDH lambs, while the relative abundance of bacteria decreased. Thus, under the conditions of the present study, the decrease in rumen pH had a greater impact on the bacterial community than on archaeal one. Similarly, Hook et al. (Reference Hook, Steele and Northwood2011) reported that high-concentrate feeding did not affect the abundance of the rumen archaea.
In terms of functional composition, the KEGG carbohydrate metabolism pathways and GH family had a lower relative abundance in the rumen of HLDH lambs. This finding contrasts with a previous finding in cows with SARA induced by a high-starch diet, which had increased carbohydrate metabolism pathways and GH family in their rumen (Zhang et al. Reference Zhang, Liu and Jiang2020). The increase in GH family abundance associated with carbohydrate degradation in the rumen of high-starch-induced SARA animals in that study may have been a bacterial response to the increase in starch levels and rate of fermentation rather than a result of decreased rumen pH. With similar starch levels, the abundance of the GH family in the rumen of goats induced SARA with a high dietary rumen-degradable starch diet was decreased (Shen et al. Reference Shen, Zheng and Chen2020), agreeing with the results of the present study. Additionally, previous research using fluorescence quantitative techniques reported a reduction in structural carbohydrate degraders in the rumen of SARA-susceptible sheep, particularly Fibrobacter succinogenes, associated with fiber degradation (Zhang et al. Reference Zhang, Li and Ma2023).
Our results showing a fermentation pattern favoring acetate production over propionate in the rumen of HLDH lambs contradict the outcomes of high-starch-induced SARA, which induces a shift from acetate to propionate (Jia et al. Reference Jia, Wang and Ni2014; Zhang et al. Reference Zhang, Li and Ma2022). However, in the present study, all HLDH and LLDH animals received the same diet, so that the differences in rumen fermentation resulted from the susceptibility of individual animals to develop SARA rather than from a change toward a high-concentrate diet. It is noteworthy that dietary starch itself promotes propionate fermentation (Janssen Reference Janssen2010). Therefore, the characteristic fermentation pattern observed in high-starch-induced SARA animals may be attributed to the type of fermentable substrate rather than inherent fermentation traits of SARA ruminants. Similarly to our findings, sheep exhibiting the most rapid declines in rumen pH following a single dose of oral glucose also demonstrated a higher molar proportion of acetate (Penner et al. Reference Penner, Aschenbach and Gäbel2009).
The reaction catalyzing the oxidative decarboxylation of pyruvate to acetyl-CoA through ferredoxin reduction is part of the main pathway of acetate production in the rumen, and the relative abundance of genes encoding the subunits of pyruvate:ferredoxin oxidoreductase (POR; i.e., porA, porB, porC, porD) was all upregulated in the rumen of HLDH lambs, consistent with the higher acetate molar percentage in their rumens. Lipopolysaccharide (LPS) infusion linearly increased the acetate to propionate ratio in the rumen (Jing et al. Reference Jing, Zhang and Liu2014). Gram-negative bacteria that die in the rumen of animals with SARA release toxic LPS, which slows rumen passage rate (Lohuis et al. Reference Lohuis, Verheijden and Burvenich1988), resulting in longer retention time of digesta in the rumen, which favors more acetate production from fibrous carbohydrates that are degraded relatively slowly.
In the rumen, lactate is primarily utilized for propionate production via the acrylate pathway (Mickdam et al. Reference Mickdam, Khiaosa-Ard and Metzler-Zebeli2017; Wagner et al. Reference Wagner, Wenner and Plank2018). Our metagenomic analysis did not reveal any intergroup differences in genes related to lactate conversion to propionate, suggesting that the capacity of the rumen bacterial community to metabolize lactate to propionate was not affected by the increased lactate concentration in the rumen of HLDH lambs. On the other hand, pyruvate metabolism to propionate via succinate pathway was decreased in the rumen of HLDH, as indicated by the decreased relative abundance of fumB, which is involved in the conversion of malate to fumarate.
Conclusions
Our results suggest that the relative abundance of ldh can be a potential predictor for the risk of developing SARA when ruminants are offered highly fermentable diets. While previous culture-based studies primarily implicated Streptococcus bovis in lactate production in SARA, our metagenomic analysis revealed a broader and more diverse range of lactate-producing bacteria in the acidotic rumen, primarily belonging to the orders Lachnospirales and Oscillospirales (phylum Bacillota). This finding challenges the long-standing concept of Streptococcus bovis being the primary lactate producer in the SARA-affected rumen and highlights the limitations of culture-dependent methods at capturing the full complexity of rumen microbial lactate metabolism, as such methods often fail to isolate and characterize uncultured microbial taxa that are functionally important in the rumen ecosystem. Notably, the Lachnospirales and Oscillospirales identified in this study as key lactate producers are core members of the rumen bacterial community associated with carbohydrate fermentation, and their elevated ldh abundance in HLDH lambs suggests that their metabolic activity can be important in lactate production and SARA development.
Supplementary material
The supplementary material for this article can be found at https://doi.org/10.1017/anr.2026.10040.
Data availability statement
The 16S rRNA gene amplicon sequences and metagenomic raw sequences, as well as metagenome-assembled genome (MAG) sequences, have been deposited at the China National Center for Bioinformation (https://ngdc.cncb.ac.cn/) under the bioProject of PRJCA023504. Additional files can be found at the following doi link: 10.6084/m9.figshare.28787216.
Acknowledgements
This study was supported by the National Natural Science Foundation of China (32302686), the Science and Technology Planning Project of Gansu Province (25CXNH006), and the Tianchi Talent Introduction Program of Xinjiang Uygur Autonomous Regions.
Author contributions
Zhiyuan Ma: Conceptualization, writing – original draft, writing – review and editing, visualization, software, and funding acquisition; Zhian Zhang: Methodology, formal analysis, investigation, validation, and data curation; Fei Li and Zhaocai Zhang: Conceptualization, resources, supervision, and funding acquisition; Li Wang, Tianxi Zhang, and Fang Luo: Methodology, investigation, and data curation; Emilio Ungerfeld, Ting Liu, Min Wang, and Xiumin Zhang: Formal analysis, data curation, and writing – review and editing.
Conflicts of interest
The authors declare no conflict of interest.


 Open access

