

1. Introduction
The General Theory was written in 1936 as a response to the human tragedy caused by the Great Depression, with Keynes prescribing a number of measures that governments should undertake to provide economic stability (Sangkuhl Reference Sangkuhl2015). Keynes’ burden was to undermine what he termed the ‘classical dichotomy’ and the ‘classical model’ in which permanent unemployment is not possible (Evans-Pritchard Reference Evans-Pritchard1985) and where money was a veil, playing no role in determining output and employment (Johnson et al. Reference Johnson, Ley and Cate2001). Additionally, he introduced the Keynesian expenditure-based model (Ferguson Reference Ferguson2013). Keynes and Say held similar views on several key issues, such as the possibility of aggregate-demand deficiency, the role of money in the economy and government intervention (Béraud and Numa Reference Béraud and Numa2019). Keynes propounded that the level of employment in the short run is dependent on the aggregate effective demand of products and services (Keynes, Reference Keynes1936), which is a theory in contrast to the monetarist theory, suggesting that full employment and price stability are not conflicting policy objectives (Friedman Reference Friedman1968).
In the new Keynesian model, the connection between the unemployment rate and the inflation rate is driven by the Phillips curve (Farmer and Nicolò Reference Farmer and Nicolò2018). The Phillips curve approach examines the relationship between inflation and unemployment (Phillips 1958), with some studies having confirmed the relationship between inflation and unemployment in Greece (Dritsaki and Dritsaki Reference Dritsaki and Dritsaki2012) and in other countries too (Bildirici and Sonustun Reference Bildirici and Sonustun2018). According to research, the relationship between unemployment and inflation is negative and significant in the euro area. Furthermore, nominal wage growth responds strongly to unemployment across labour markets in the monetary union, since one unit increase in the unemployment rate reduces nominal wages by 0.3% (Levy Reference Levy2019), with the impact of the output gap on core inflation being significant, but not large (Montoya and Döhring Reference Montoya and Döhring2011). Research supports that a permanent increase in money growth leads to a permanent increase in the inflation rate and a permanent decrease in the level of unemployment (Graham and Snower Reference Graham and Snower2002; Coibion et al. Reference Coibion, Gorodnichenko and Ulate2019).
It has been argued that the same relationship between inflation and unemployment applies also between wages and unemployment (Wage Phillips Curve). Nominal wage growth and unemployment are negatively correlated (Galí Reference Galí2011), even though some economists support the decline in Phillips curve slope coefficient and the shrinking role of lagged price inflation in the determination of wage inflation (Galì and Gambetti, Reference Galì and Gambetti2018). Other economists support that only inflation correlates with unemployment, whereas wages do not (Bierens and Broersma Reference Bierens and Broersma1993). It is supported that there is a response of interest rates to announcements of unexpected changes in the unemployment rate, with the natural rate of unemployment being at 5.9% (Prag Reference Prag1994). Finally, Samuelson and Solow offer a trade-off view but are very sceptical about the long-run stability of the curve (Schwarzer Reference Schwarzer2013).
Well-anchored expectations have contributed to enhancing the effectiveness of monetary policy and assist the economic recovery (ECB 2011). It is supported that combining inflation forecasts from many models yields more accurate forecasts than those of any specific model (Altavilla and Ciccarelli Reference Altavilla and Ciccarelli2007), while there is evidence of a high degree of dispersion across models (Altavilla and Ciccarelli Reference Altavilla and Ciccarelli2009). On the other hand, measures such as one-off moves in labour market slack are unlikely to be predictive of changes in trend inflation (Cecchetti et al. Reference Cecchetti, Feroli, Hooper, Kashyap and Schoenholtz2017). Moreover, Blanchard supports that inflation expectations have become steadily more anchored (Blanchard Reference Blanchard2016), and in emerging markets they have become more strongly anchored over time (Sousa and Yetman Reference Sousa and Yetman2016). Finally, first-hand empirical evidence suggests that inflation expectations of households and firms affect their actions but the underlying mechanisms remain unclear, especially for firms (Coibion et al. Reference Coibion, Gorodnichenko, Kumar and Pedemonte2020).
The breakdown of the Phillips curve occurred in the mid-1970s, when the predicted negative relation between inflation and unemployment turned out to be utterly wrong (Gordon Reference Gordon2013), with different interpretations having been expressed about the function of the curve (Gordon Reference Gordon2010) and many economists pinpointing the failures of the Phillips curve (Hebert Reference Hebert1981). Furthermore, it has been argued that the wage and price adjustments in Greece were similar to those in Germany, Australia and Latvia (Belke and Gros Reference Belke and Gros2018), which means that the classical model works effectively. In other words, some economists support that there is only one rate of unemployment compatible with steady inflation – a ‘natural rate’ (Tobin Reference Tobin, Estrin and Marin1995) – as well as that the relation between inflation and unemployment could be more than coincidental (Friedman Reference Friedman1977), with a strict inflation policy not having a large impact on the unemployment volatility (Campolmi and Gnocchi Reference Campolmi and Gnocchi2016), whereas other economists support that that there is no clear long-run trade-off between inflation and the unemployment rate (Benati Reference Benati2015) and that the Phillips curve relationship has weakened, with the curve becoming flatter (Occhino Reference Occhino2019). Finally, it is mentioned that the Phillips curve slope is heterogeneous across countries and the slope has not changed significantly since the global financial crisis (Hindrayanto et al. Reference Hindrayanto, Samarina and Stanga2019).
This article is structured as follows: Section 2 discusses the modern literature about the Phillips curve, while Section 3 investigates the economic policy in Greece during the crisis. Section 4 presents the methodology used while the subsequent section describes the data and makes the estimations. Section 6 presents the empirical results and, finally, Section 7 offers some concluding remarks.
2. Modern Literature about the Phillips Curve
Recent research shows that fluctuations in core inflation could be explained by expected inflation, the output gap and the pass-through of movements in headline inflation (Ball and Mazumder Reference Ball and Mazumder2020), while many economists and organizations support that the Phillips Curve has flattened or even disappeared (Dotsey et al. Reference Dotsey, Fujita and Star2017; IMF 2013). More specifically, economists support that the flattening is evident in the baseline ‘structural’ new-Keynesian Phillips curve (Kuttner and Robinson Reference Kuttner and Robinson2010), while results do not lend support to the view that the flattening of the Phillips curve is due to globalization (Gaiotti Reference Gaiotti2010).
In addition, researchers support that inflation expectations have been fully ‘shock-anchored’ since the 1980s (Ball and Mazumder Reference Ball and Mazumder2011). In other words, they support that the effect of unemployment on inflation, for a given level of expected inflation, decreased until the early 1990s (Blanchard et al. Reference Blanchard, Cerutti and Summers2015), but the US Phillips curve is alive (Gordon Reference Gordon2013).
Furthermore, economists suggest that a simple rule with an explicit inflation goal could serve as a useful benchmark for avoiding the recurrence of the Great Inflation (Levin and Taylor Reference Levin and Taylor2013).
In addition, a group of economists support that inflation follows a seemingly exogenous process, unrelated to measures of slack (Stock and Watson Reference Stock and Watson2007; Forbes et al. Reference Forbes, Kirkham and Theodoridis2017) while NAIRU forecasts are not accurate (Atkeson and Ohanian Reference Atkeson and Ohanian2001). In the same way, a recent study supports that a large set of Phillips curve models cannot account for the weakness in underlying inflation between mid-2017 and 2019 (ECB 2019).
Regarding the ECB, it adopted a package of mutually reinforcing monetary policy measures during the crisis, such as pushing the policy rate into negative territory, forward guidance on the future policy path, asset purchase programmes (APPs), targeted longer-term refinancing operations (TLTROs), and quantitative easing (QE), in order to boost the European economy’s growth (Lane Reference Lane2019) and reduce unemployment, although these monetary measures led to a low economic recovery (Vamvakidis Reference Vamvakidis, Thomakos, Monokroussos and Nikolopoulos2015), with the monetary policy effectiveness being dependent on countries’ financial, fiscal and market structure (Filiz Baştürk Reference Filiz Baştürk2013). In addition, economists support that more research is needed on the transmission of negative rates and their financial stability repercussions (Beyer et al. Reference Beyer, Cœuré and Mendicino2017). Monetary easing policy measures, such as the QE, help countries to meet their debt service obligations, but were not adopted in a timely manner, thus they had limited effects on inflation, GDP and sovereign spreads (Driffill Reference Driffill2016). Moreover, the ECB could take on the crucial role as a lender of last resort in order to reduce the economic fragility of the eurozone (De Grauwe Reference De Grauwe2012) and place equal emphasis on the inflation objective compared with the financial stability objective (De Grauwe and Gros Reference De Grauwe and Gros2009), since the contractionary monetary policy followed by the ECB ignited the economic crisis (Jensen Reference Jensen2016). Furthermore, there was a deviation between the monetary policy goals and the developments in prices, interest rates and economic growth (Rodríguez et al. Reference Rodríguez, Campello, Varela-Candamio and Pateiro-López2016). Finally, enhanced forms of forward guidance, which comprise negative policy rates, a large asset purchase programme and targeted long-term loans to banks, could help the EMU to halt persistent disinflation in the post-crisis era (Rostagno et al. Reference Rostagno, Altavilla, Carboni, Lemke, Motto, Guilhe and Yiangou2019), while unconventional monetary policy measures are effective in mitigating the downside risks to price stability (Ciccarelli and Osbat Reference Ciccarelli and Osbat2017).
3. The Economic Policy in Greece during the Crisis
The fiscal policy followed by Greece over the economic crisis years was restrictive (Monokroussos Reference Monokroussos2015; Papadamou and Tzivinikos Reference Papadamou and Tzivinikos2017), resulting in a widening recession and a rise in unemployment (Gechert and Rannenberg Reference Gechert and Rannenberg2015), since high debt levels reduced the government’s ability to use public expenditure in order to stabilize the economy (Papadimos Reference Papadimos2011), for this reason was called on to provide assistance to the financial sector (Caruso et al. Reference Caruso, Reichlin and Ricco2019). The banking crisis and the increase in non-performing-loans (NPLs), in turn, had additional negative effects on unemployment and inflation (Mazreku et al. Reference Mazreku, Morina, Misiri, Spiteri and Grima2018).
A primary goal of the EAPs was fostering price competitiveness, through an improved current account balance (Hazakis Reference Hazakis2017) and lower unit labour costs (Ioannides and Pissarides Reference Ioannides and Pissarides2015), and balancing twin deficits (Gibson et al. Reference Gibson, Hall and Tavlas2012), without any emphasis being placed on the non-wage cost, which is a crucial international trade factor (Athanasoglou and Bardakas Reference Athanasoglou and Bardakas2010). According to the perspective of the EAPs, the Greek economy’s problem was mainly a supply-side problem and, as a result, the promoted reforms focused on wage-cost reduction measures and structural changes in the labour relations and the product and service market (Bruno Reference Bruno1982). Price competitiveness was considered a key goal for achieving economic progress and improving balance of payment (Bobeica et al. Reference Bobeica, Christodoulopoulou and Tkačevs2016). Added to that, Greece faced deflation during the crisis, which put additional pressure on unemployment (Anastasatos and Stamatiou Reference Anastasatos and Stamatiou2014; Karanasos et al. Reference Karanasos, Koutroumpis, Hatgioannides, Karanassou and Sala2017). In addition, it is argued that some reforms set conflicting objectives, which increases unemployment (Liargovas and Psychalis Reference Liargovas and Psychalis2019) and underlined the existence of a Wage Phillips Curve (Orlandi et al. Reference Orlandi, Roeger and Thum-Thyse2018).
By contrast, the related literature argues that both the current account balance (Collignon and Esposito Reference Collignon and Esposito2013) and unit labour costs (Felipe and Kumar Reference Felipe and Kumar2011) are not competitiveness indicators. Moreover, during a recession period, a business-cycle related domestic demand increase may have a bigger contribution to economic growth than an emphasis on the current account balance improvement (Comunale and Hesse Reference Comunale and Hesse2014), whereas the adoption of austerity measures may lead to a slower economic growth (Bianchi et al. Reference Bianchi, Comin, Kung, Kind and Matusche2019). Furthermore, it is noted that Greek enterprises tried to address the demand reduction problem through wage cuts (Kosma et al. Reference Kosma, Papapetrou, Pavlou, Tsochatzi and Zioutou2017), with the internal devaluation not leading to a competitiveness boost (Passas and Pierros Reference Passas and Pierros2017), since the EAPs do not produce permanent results in terms of promoting exports (Noorbakhsh and Paloni Reference Noorbakhsh and Paloni1998).
Additionally, both supply and demand problems appear in the case of the Greek economy. The supply problems have been present since 1981, whereas the demand problems were caused later by the austerity and wage cuts (Ioannides and Pissarides Reference Ioannides and Pissarides2015).
Finally, Greece seems to keep a stable relationship with debt crises, having gone bankrupt four times since 1829 (Reinhart and Rogoff Reference Reinhart and Rogoff2011), in addition Greece held the least successful of the euro periphery fiscal devaluation programmes (Petroulakis Reference Petroulakis2017).
4. Methodology
Descriptive statistics, ordinary least squares (OLS) and VAR analysis are employed to examine the relationships between unemployment, as an independent variable, and inflation, as an independent variable, so as to answer the research question. Descriptive statistics are employed to offer an overview and illustrate the development of the indicators and relationships under examination. Regression analysis is employed to examine the correlation between the variables under examination in the group of countries, Greece, Spain, France, Italy, Germany and Portugal. The correlation coefficient between the variables reflects the degree of linear relationship between two variables. The ordinary least squares method is employed to examine the relationships between the variables under examination, monitoring whether independent variables affect dependent variables. VAR analysis was employed for forecasting systems of interrelated time series, as causality tests refers to the ability of one variable to predict or cause the other (Asteriou and Hall Reference Asteriou and Hall2006). Finally, all these tools offer a complete overview of the variables under examination.
5. Data and Estimations
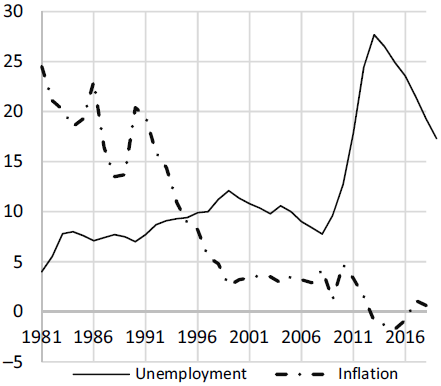
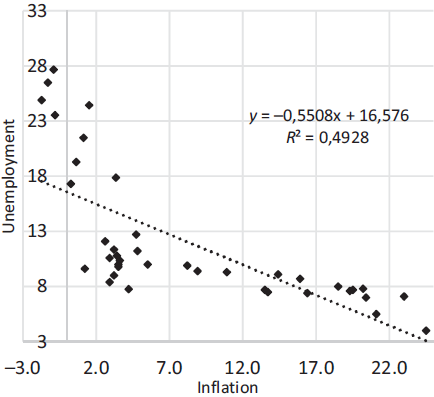
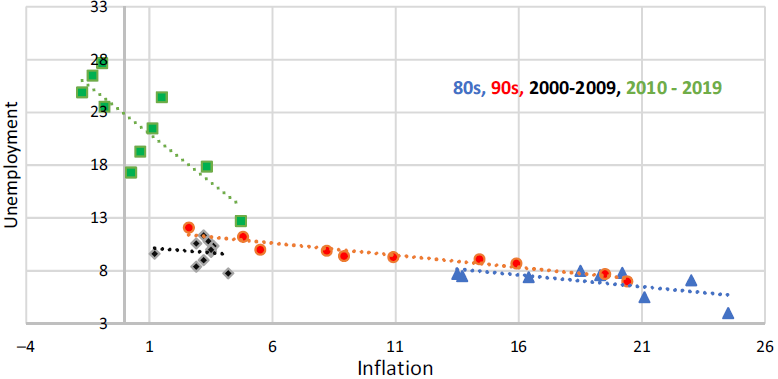
Figure 1 shows that there was a dramatic inflation fall during crisis from 5% to –1.5%, and, respectively, an unemployment increase, from 7% to 27%. Furthermore, Figure 2 shows inflation is negatively correlated with unemployment (Mastromatteo and Rossi Reference Mastromatteo and Rossi2015), since a decrease in inflation appears to be associated with an increase in unemployment (Frangakis Reference Frangakis2015), with the correlation coefficient being –0.83 and the equation expressing the relationship between these two variables being: y = –0.55x + 16.57, i.e. an increase in inflation by 1 percentage point decreases unemployment by 0.55 percentage points. Based on Figure 3, in Greece, the Phillips curve kept flattening during the 1980s, 1990s and 2000s; however, during the last decade its slope steepened sharply, without confirming the Phillips curve hypothesis. Likewise, a negative correlation between inflation and unemployment is also observed in France, Spain, Portugal and Italy, as illustrated in Figure 4, with the exception of Germany which features an almost flat curve.
Unemployment rate and inflation rate.
Source: Bank of Greece
Unemployment rate and inflation rate in Greece.
Source: OECD
Unemployment rate and inflation rate in Greece during in 1980s, 1990s, 2000s and 2010s (to view this figure in colour please see the online version of this journal).
Source: OECD
Unemployment rate and inflation rate in Greece, Spain, Portugal, Germany, Italy and France (to view this figure in colour please see the online version of this journal).
Source: OECD

Table 1 shows that a negative correlation coefficient between inflation and unemployment does not only appear in the case of Greece, but also in the cases of France, Italy, Portugal, Spain and Austria. Moreover, inflation appears to affect unemployment more severely in Spain, with other studies reaching similar conclusions (Hindrayanto et al. Reference Hindrayanto, Samarina and Stanga2019). On the other hand, it seems that inflation is not really correlated to unemployment in Germany.
Unemployment and inflation correlation and the linear equation.

Table 2 illustrates the relationship between the dependent variable (i.e. unemployment), and the independent variables (i.e. inflation, unit labour cost, current account balance and long-term borrowing rate). According to the regression, an increase in inflation by 1 basis point decreases unemployment by 1.14 percentage points, which confirms the negative correlation between unemployment and inflation. On the other hand, an increase of the current account balance by 1 basis point increases unemployment by 0.67 percentage points, while an increase in the unit labour cost by 1 percentage point decreases unemployment by 0.35 percentage points. The inverse relationship between Current Account Balance and Unit Labour Cost to unemployment, compared with prevailing literature (Salop and Spitäller Reference Salop and Spitäller1980; Rebitzer Reference Rebitzer1988; Britton Reference Britton1989), is explained by the economic model previously applied in Greece and other Southern European countries, as the constant twin deficits in state budget and current account balance restricted competitiveness, which led to increased unit labour cost, while jobs were linked to consuming and government spending (Busch et al. Reference Busch, Grömling and Matthes2011). Finally, an increase in the long-term borrowing rate by 1 percentage point increases unemployment by 0.35 percentage points. This relation is also confirmed by the literature (Bierens and Broersma Reference Bierens and Broersma1993; Feldmann Reference Feldmann2013).
Multivariate regression for Greece.

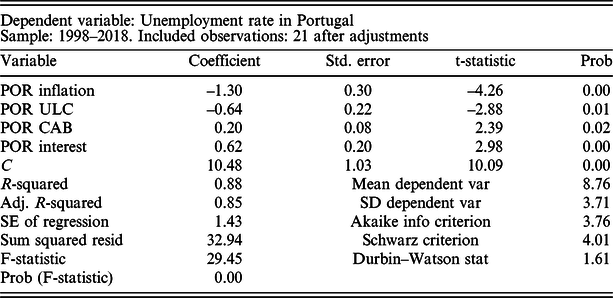
The negative correlation between unemployment and inflation is also confirmed by the multivariate regressions performed for Italy, Spain, Portugal and Germany, which produced similar results as for Greece for all indicators, as illustrated in multivariate Tables 3 to 6.
Multivariate regression for Portugal.

Multivariate regression for Spain.
Multivariate regression for Italy.

Multivariate regression for Germany.

Contrary to the above, Table 7 shows that during 2004–2018, unemployment in Greece was slightly affected by past inflation values, while – apart from the model’s internal factors – other external factors significantly affect the unemployment rate. Therefore, based on VAR Analysis 1, one can conclude that there is a positive, yet weak, relationship between unemployment and past inflation values. In addition, VAR Analyses 2 and 3, which study two different time periods in Greece, reveal a positive relationship between unemployment and past inflation values, for most values, although inflation does not significantly affect unemployment, while in both cases numerous external factors, besides inflation, affect unemployment. It is noted that the remaining variables have the same trend in Multivariate VAR as in Multivariate Regression, while inflation is the only variable differentiating between Multivariate Regression and Multivariate VAR.
Vector autoregression estimates.

6. Results
During the financial crisis, inflation fell while unemployment increased. The results indicate that there is a negative correlation between inflation and unemployment, since an inflation decrease leads to an unemployment increase, thus confirming the Phillips curve hypothesis in Greece, as part of literature supports (Dritsaki and Dritsaki Reference Dritsaki and Dritsaki2012; Dritsakis and Stamatiou Reference Dritsakis and Stamatiou2016; Juselius and Dimelis Reference Juselius and Dimelis2018), while the slope of the curve has substantially flattened. It is noted that the negative correlation between unemployment and inflation is also documented in other EMU countries, both by literature and empirical evidence. Furthermore, in Greece, results show that dependence of unemployment on inflation has decreased compared with past years. The negative correlation between unemployment and inflation is further documented by the Multivariate Regression, as an increase in inflation by 1% seems to decrease unemployment by 1.14 percentage points, while similar results are produced for other EMU countries too. On the contrary, the VAR analysis indicates that an increase in inflations tends to cause an increase in unemployment. This relationship was consistent in different time periods (1987–1999 and 2006–2019). Consequently, despite Multivariate Regressions and Descriptive Statistics Analysis indicating a negative correlation between unemployment and inflation, and in certain cases a strong negative correlation, confirming the Phillips Curve hypothesis, VAR Analysis indicates that past inflation values tend to be positively correlated to unemployment, therefore confirming classical economists.
7. Conclusion
The conclusions drawn are not clear. On the one hand, there are some findings that confirm the Keynesian theory, and more specifically the true application of the Phillips curve on the relationship between inflation and unemployment, since a decrease in inflation leads to an increase in unemployment. Therefore, what is confirmed in the current article is the views of that part of the literature holding that there is no clear prevalence of Keynesians over Classicals, or vice versa, with both schools of economic thought being live and co-examined (Dumenil and Levy Reference Dumenil and Levy1997; Chaudhry et al. Reference Chaudhry, Faridi and Gul2014). However, inflation can only explain a small fraction of unemployment, as new factors affecting unemployment have arisen and there is evidence confirming the negative relationship between unemployment and inflation. In conclusion, because of the ECB’s monetary policy, inflation tends to have less and less impact on unemployment, but without cancelling out the Phillips Curve hypothesis. In the future, more detailed analysis could be done. For example, an impulse response shock analysis could be carried out in order to examine the effect of inflation on unemployment.
About the Authors
Panagiotis Liargovas is Jean Monnet Professor in ‘European Integration and Policies’ at the University of the Peloponnese as well as Head of the Centre of Planning and Economic Research (KEPE). Furthermore, he was Head of the Parliamentary Budget Office at the Hellenic Parliament. He received his BA degree from the University of Athens and his MA and PhD degrees in Economics from Clark University, Worcester, MA, USA. He has been a Fulbright Scholar, a Bakalas Foundation Scholar, a Teaching Assistant Scholar (Clark University) and a European Commission trainee (Brussels). He has taught in many Universities including Clark University, Bologna University, and the Universities of: Athens, Patras and Crete. His research agenda is highly interdisciplinary, combining economics, banking and finance, social issues and management, and it focuses mainly on two regions: the European Union and Southeast Europe (including Greece).
Marios Psychalis holds a PhD in Economics from the University of Peloponnese, Department of Economics, while he holds an MA and an MSc from the University of Athens and Athens University of Economics and Business, and he has a Bachelor’s Degree from the University of Athens. He graduated from the National School of Public Administration, and has work experience in both private and public sectors. His academic interests are at the fields of macroeconomics, public debt, EMU integration and economic policy. He has published papers related to fiscal policy in the EMU and public budgetary frameworks.


 Open access