

Introduction
In the USA, Salmonella is estimated to be the leading cause of annual illnesses, hospitalisations, deaths and monetised losses due to foodborne bacterial pathogens [Reference Scallan1, Reference Minor2]. Despite the introduction of food safety measures intended to reduce the incidence of foodborne salmonellosis, the reported overall incidence of Salmonella infection in the USA exhibited year-to-year variation but did not decline between 1996 and 2013 [Reference Powell3]. However, temporal and spatial patterns vary among Salmonella serotypes, and different serotypes may be more frequently associated with different animal reservoirs and food commodities [Reference Andino and Hanning4–Reference Jackson7].
The Foodborne Diseases Active Surveillance Network (FoodNet) is a collaboration among the Centers for Diseases Control and Prevention (CDC), ten state health departments, the US Department of Agriculture's Food Safety and Inspection Service (USDA-FSIS) and the Food and Drug Administration (FDA). FoodNet conducts active, population-based surveillance for laboratory-confirmed infections transmitted commonly through food, including Salmonella. The FoodNet surveillance area currently includes the full states of Connecticut, Georgia, Maryland, Minnesota, New Mexico, Oregon and Tennessee, and selected counties in California, Colorado and New York.
During 1996–2014, Salmonella enterica subsp. enterica serotypes Typhimurium, Enteritidis and Newport were the three most common serotypes reported by FoodNet sites. Based on the most recent data available, the reported incidence rate is highest for Enteritidis, and these principal three serotypes represent over 40% of the serotyped Salmonella strains reported [8–10]. This analysis focuses on temporal patterns in the trends of the three principal Salmonella serotypes and extends methodologically on previous work by examining both annual trends and seasonal variation in reported incidence.
Methods
Data
The analysis includes the FoodNet data for serotypes Typhimurium, Enteritidis and Newport during 1996–2014. Case counts (number of reported laboratory-confirmed infections) and surveillance area population data were obtained from the CDC FoodNet program for each serotype by year, month and site. Since it was established in 1996, FoodNet has included the states of Minnesota and Oregon and selected counties in California, Connecticut and Georgia. During 1997–2004, the FoodNet surveillance area expanded to include the entire states of Connecticut, Georgia, Maryland, Minnesota, New Mexico, Oregon and Tennessee, and selected counties in California, Colorado and New York. To control for the changing geographic composition of the FoodNet surveillance area over time, this analysis is restricted to the aggregate annual and monthly data from the original five sites [Reference Bender11]. During 1996–2014, the population of the original FoodNet sites grew from 5 to 6% of the total US population.
Regression analysis
We analysed the reported Salmonella serotype incidence data using penalised cubic B-spline regression [Reference Powell3, Reference Eilers and Marx12]. B-spline regression is a semi-parametric, locally-controlled method that makes no assumptions about the statistical form of the trend [Reference de Boor13]. To address the sensitivity of B-spline regression to choices about the number and location of join-points called knots, Eilers and Marx proposed penalised B-spline regression that imposes a ‘roughness’ penalty on differences among neighbouring B-spline regression coefficients. The result is a flexible smooth curve that avoids overfitting the data, although less smoothness is imposed at domain boundaries [Reference Eilers and Marx12].
To account for the count nature of the data, we used a generalised additive model. A generalised additive model is a generalised linear (e.g., log-linear Poisson regression) model in which the linear predictor depends additively on unknown smooth functions of some covariates [Reference Eilers and Marx12, Reference Wood14]. In this analysis, the log of Salmonella serotype cases reported in a period depends linearly on smooth functions of the year (for annual data analysis) or year and month (for monthly data analysis). For the monthly analysis, the month effects estimated under the regression model are proportionally constant to the yearly estimate. To control for the increasing population size of the original surveillance sites over time, the log of the population enters the model as an offset term, and a generalised Poisson regression model allows for non-Poisson dispersion [Reference Wood14].
For the annual data analysis, consider the following generalised additive model:
 $${\rm Log(}\mu _i {\rm )} = {\rm log(}Population_i {\rm )} + \beta _0 + f\,(x_i )$$
where μ
i
= E[Count
i
]; i = 1996, …, 2014; Population
i
= population of the original 5 FoodNet sites; smooth function $ f(x_i ) = f(Year_i ) = \sum\nolimits_{j = 1}^k {B_j} (Year_i )\beta _j $
; and B
j
(x) is the B-spline basis function.
$ f(x_i ) = f(Year_i ) = \sum\nolimits_{j = 1}^k {B_j} (Year_i )\beta _j $
; and B
j
(x) is the B-spline basis function.
For the monthly data analysis, consider the following generalised additive model:
 $$ {\rm Log}(\mu _{ij} ) = {\rm log}(Population_{ij} ) + \beta _0 + f_1 (x_i ) + f_2 (x_j ) $$
where μ
ij
= E[Count
ij
]; i = 1996, …, 2014; j = 1, …, 12; Population
ij
= population of the original 5 FoodNet sites; smooth function $ f_1 (x_i ) = f_1 (Year_i ) = \mathop \sum\nolimits_{k = 1}^l B_k (Year_i )\beta _k $
; smooth function
$ f_1 (x_i ) = f_1 (Year_i ) = \mathop \sum\nolimits_{k = 1}^l B_k (Year_i )\beta _k $
; smooth function $ f_2 (x_j ) = f_2 (Month_j ) = \sum\nolimits_{k = 1}^l {B_k (Month_j )\beta _k } $
; and B
k
(x) is the B-spline basis function.
$ f_2 (x_j ) = f_2 (Month_j ) = \sum\nolimits_{k = 1}^l {B_k (Month_j )\beta _k } $
; and B
k
(x) is the B-spline basis function.
For the annual data analysis, a period in which the 95% confidence band about the estimated curve contains a line with zero slopes indicates no significant annual change. If the 95% confidence band contains a line with zero slope for 1996–2014, this would indicate no significant annual trend with only year-to-year variation during the entire period (i.e., we would not reject an intercept-only regression model). A significant annual trend may be monotonic (increasing or decreasing), non-monotonic (e.g., cyclic or inverted-U), linear or non-linear (e.g., a step function).
For the monthly data analysis, an F test of the model fit with and without month as a covariate indicates the significance (with approximate P-values) of seasonality. Analyses of the monthly data input on a calendar year basis suggest primary peaks in late summer for all serotypes and secondary early winter peaks for some serotypes. Therefore, the year and month covariates also were inputted on a fiscal year basis (October through September) for the monthly data analysis. This shifts the early winter period from the boundary between calendar years to a more central position within fiscal years and thus avoids the potential lack of smoothness that may be imposed at domain boundaries. Seasonal peaks identified under both calendar and fiscal year bases are considered robust to potential boundary effects (e.g., late summer does not lie on the boundary between calendar or fiscal years).
The smooth functions of the generalised additive model are obtained using a uniform cubic B-spline basis function. The B-spline basis function provides local control over the model fit. Thus, the local fit of the curve is insensitive to points far removed. The degree of smoothness is controlled by a curvature penalty term, and the smoothing penalty parameter value is estimated by the generalised cross-validation criterion. The penalised B-spline regression model was performed using a second-order difference penalty and two interior knots (two boundary knots, ten total knots), resulting in an unconstrained basis of dimension six for each smoothed covariate. However, because the degree of smoothness is controlled by the curvature penalty, the model fit is insensitive to the choice of basis dimension [Reference Eilers and Marx12, Reference Wood14]. For a cubic B-spline basis and second-order difference penalty, as the curvature penalty increases without bound, the fit approaches a simple log-linear model [Reference Eilers and Marx12]. Wood provides statistical background on generalised additive models [Reference Wood14]. Powell describes the application and estimation of the penalised cubic B-spline regression model for FoodNet data in further detail [Reference Powell3]. The analysis presented here follows the same modelling and estimation approach but has been extended to include more than one smoothed covariate (i.e. year and month) to investigate seasonal as well as annual patterns. The analysis was performed using the R mgcv package [15, Reference Wood16]. The data and computer code used in the analysis are provided as Supplementary Materials.
Results
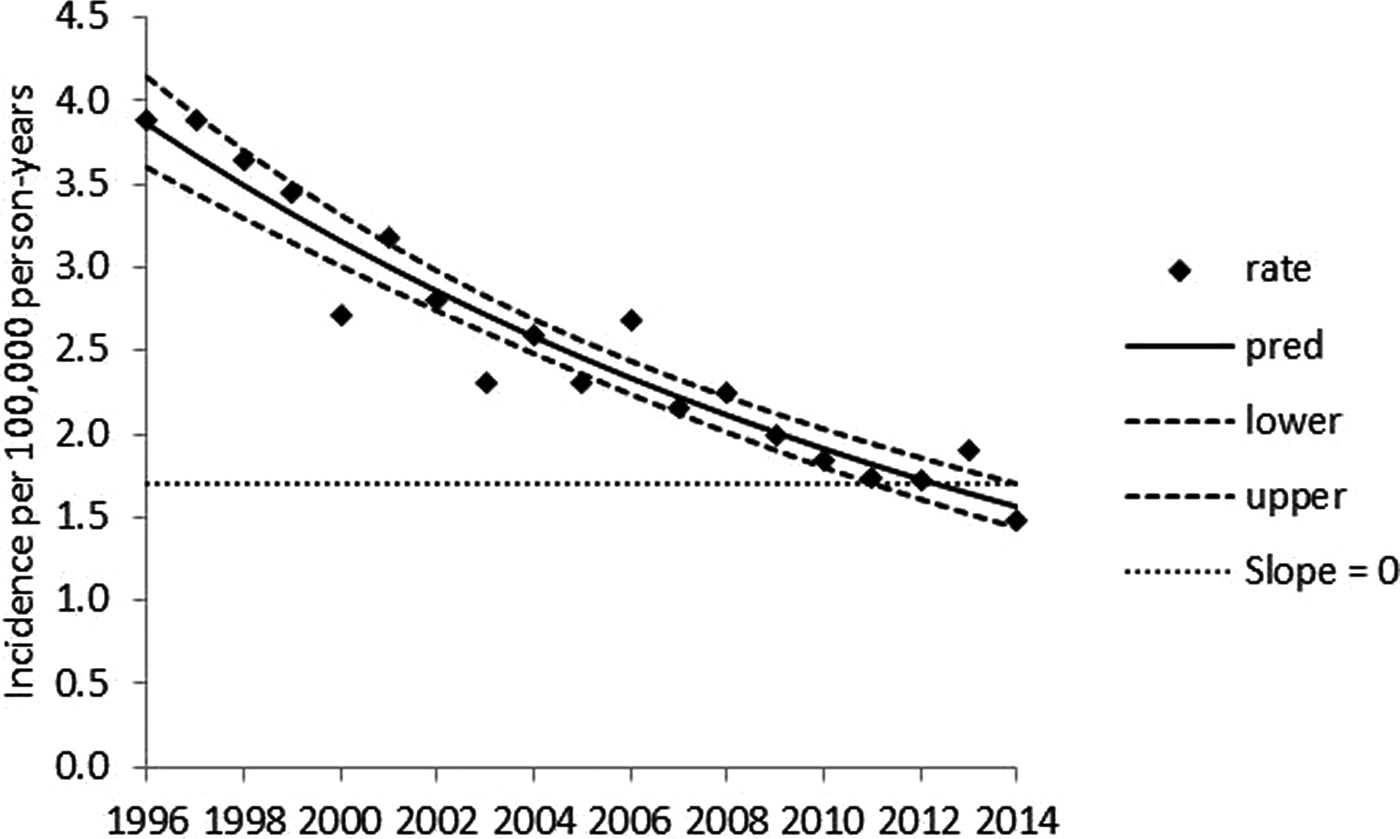
Serotype Typhimurium exhibits a significant, log-linear declining annual trend over 1996–2014 (Fig. 1) and significant seasonality (P < 0.001) marked by peaks in late summer and early winter (Fig. 2). Serotype Enteritidis exhibits a significant annual trend, with a higher incidence in later years (Fig. 3) and significant seasonality (P < 0.001) marked by a peak in late summer (Fig. 4). Serotype Newport exhibits no significant annual trend (Fig. 5) with significant seasonality (P < 0.001) marked by a peak in late summer (Fig. 6). An apparent secondary early winter peak for Newport was obtained when month and year are inputted on a calendar year basis. This peak, however, is smoothed when the covariates are inputted on a fiscal year basis. Therefore, the potential secondary early winter peak for Newport is not considered robust. To assist in the visual interpretation of the annual trend analysis results, Figures 1, 3, and 5 contain zero slope lines (indicated by slope = 0). In Figure 1 (Typhimurium), the zero slope line is at the minimum value of the upper limit of the confidence band. In Figure 3 (Enteritidis), zero slope lines are placed at the minimum value of the upper limit and at the maximum value of the lower limit of the confidence band. In Figure 5 (Newport), the zero slope line is at the minimum value of the upper limit of the confidence band. The figures for the monthly data analyses (Figs 2, 4, and 6) are presented on a calendar year basis but are based on results obtained when year and month are inputted on a fiscal year basis.
Penalised B-spline regression of annual reported serotype Typhimurium incidence per 100 000 person-years for 1996–2014. Rate = reported incidence per 100 000 person-years, pred = mean curve, lower and upper = 95% confidence band limits.
Penalised B-spline regression of monthly reported serotype Typhimurium incidence per 100 000 person-months for 1996–2014. Rate = reported incidence per 100 000 person-months, pred = mean curve, lower and upper = 95% confidence band limits.

Penalised B-spline regression of annual reported serotype Enteritidis incidence per 100 000 person-years for 1996–2014. Rate = reported incidence per 100 000 person-years, pred = mean curve, lower and upper = 95% confidence band limits.

Penalised B-spline regression of monthly reported serotype Enteritidis incidence per 100 000 person-months for 1996–2014. Rate = reported incidence per 100 000 person-months, pred = mean curve, lower and upper = 95% confidence band limits.

Penalised B-spline regression of annually reported serotype Newport incidence per 100 000 person-years for 1996–2014. Rate = reported incidence per 100 000 person-years, pred = mean curve, lower and upper = 95% confidence band limits.

Penalised B-spline regression of monthly reported serotype Newport incidence per 100 000 person-months for 1996–2014. Rate = reported incidence per 100 000 person-months, pred = mean curve, lower and upper = 95% confidence band limits.

Discussion
Although the reported incidence of illness due to all Salmonella serotypes in the USA did not exhibit a declining trend during 1996–2013 [Reference Powell3], we identified significant annual trends among the three principal Salmonella serotypes. In addition to long-term trends, Salmonella serotypes may exhibit complex seasonal patterns with multiple peaks during the year. The significant annual trend results for serotypes Typhimurium (decreasing) and Enteritidis (increasing) are consistent with previous reports [Reference Chai5, 9]. Previous reports indicated significant increases for serotype Newport; however, these were based on pairwise comparisons between the reported incidence from all sites for individual years to a 1996–1998 baseline [8, 9]. Consequently, they could not distinguish trends from year-to-year variation and did not control for the change in site composition over time.
The seasonal peaks observed in late summer for the three principal Salmonella serotypes are associated with higher ambient temperatures that would impact both food and environmental sources. The possible factors underlying the secondary early winter peak (or discontinuity of slope, strictly speaking) for serotype Typhimurium may include seasonal changes in food consumption, composition and quantity, food handling and preparation practices, and care-seeking behaviour. This complex seasonal pattern of a primary peak in summer and a secondary early winter peak is consistent with that observed for campylobacteriosis [Reference Williams17, Reference Wei, Schupbach and Held18]. Investigating seasonal patterns may be useful in studies to estimate the proportion of specific illness attributable to various sources. For example, the reported incidence of campylobacteriosis cases exhibits a strong seasonal pattern that generally precedes increases in prevalence observed in contaminated raw chicken [Reference Williams17].
It is important to underscore that this study analyses temporal patterns in the incidence of illness reported by the original FoodNet sites, which is an imperfect measure of the true incidence of foodborne illness. Reported cases of laboratory-confirmed illnesses understate the true incidence of illness due to underreporting and underdiagnoses, and the degree of adjustment required to estimate true incidence is uncertain and varies among pathogens [Reference Scallan1, Reference Jones19]. Furthermore, the available time series data may reflect changes in the reporting rate, whether resulting from changes in reporting systems, diagnostic methods or resources. The problem of uncertainty in the data is accentuated by differences in the evolution of the surveillance system among sites over time. The analysis also does not account for changes in demographics or dietary exposures in the sites over the surveillance period, nor does it seek to draw inferences about the underlying causes of the observed temporal patterns. Moreover, there is uncertainty about generalising from the original FoodNet sites to the national level, but this analysis has not attempted to quantify that uncertainty.
Distinguishing bona fide trends and patterns from random variation in disease incidence presents a challenge, particularly when the trends do not follow simple patterns (e.g., monotonic linear or log-linear) [Reference White and Granger20]. Henao describes the methods that traditionally have been used for monitoring changes in the incidence of foodborne diseases, including those caused by Salmonella serotypes, in the United States based on data reported by FoodNet [Reference Henao21]. The methods involve crude rates and pairwise comparisons between the latest reporting year and multiple reference periods using a log-linear negative binomial regression model to account for changes in population size and estimate site-to-site variation in incidence. Such analysis cannot distinguish year-to-year variation from trends, and further analysis is required to determine which changes in reported incidence represent bona fide trends. Henao suggested exploring variations of a generalised Poisson model and spline regression to analyse foodborne illness trends [Reference Henao21, Reference Henao, Crim and Hoekstra22]. Powell used penalised cubic B-spline regression methods to analyse annual trends in the reported incidence of illness due to bacterial pathogens commonly transmitted by food in the USA during 1996–2013 [Reference Powell3]. Herein, we have used penalised cubic B-spline regression in a generalised additive model framework to investigate both annual trends and seasonal variation in reported incidence.
In principle, generalised additive models provide a robust class of methods that can include a variety of continuous and categorical covariates to explain variation in disease incidence. Future studies employing the statistical methods described herein could further explore temporal patterns to identify specific periods of change (e.g., by estimating uncertainty about the first derivative of the spline over the time series) or investigate whether seasonality changes over time and to investigate the effects of geographic, demographic and other variables in addition to temporal patterns. We should also continue to explore other statistical methods for trend analyses, such as joinpoint regression analysis, change point analysis and Bayesian hierarchical time series models [Reference Kim23–Reference Berliner, Hanson and Silver25].
Supplementary material
The supplementary material for this article can be found at https://doi.org/10.1017/S0950268818000195.
Acknowledgements
Data provided by Foodborne Diseases Active Surveillance Network, CDC.
Declaration of interest
None.
Disclaimers
The opinions expressed herein are the views of the authors and do not necessarily reflect the official policy or position of the U.S. Department of Agriculture or the Centers for Disease Control and Prevention. Reference herein to any specific commercial products, process, or service by trade name, trademark, manufacturer, or otherwise, does not necessarily constitute or imply its endorsement, recommendation, or favouring by the U.S. Government.


