


Impact statement
The rapid expansion of artificial intelligence (AI) requires massive data centres that consume vast amounts of electricity and water. This study reveals that the AI infrastructure cluster in São Paulo, Brazil, consumes ~16.1 million cubic metres of water annually, equivalent to the needs of over 100,000 households. Crucially, nearly half of this water is “virtual,” lost to evaporation in the hydroelectric reservoirs that power the grid. This creates a feedback loop: AI demands more energy, stressing water supplies in a region already vulnerable to drought and climate change. This research highlights that the environmental cost of digital innovation extends beyond carbon emissions to include water security. It provides a wake-up call for policymakers and tech companies to integrate water stewardship into their sustainability strategies, ensuring that the digital revolution does not compromise freshwater access for communities and ecosystems.
Introduction
The computational revolution and its material costs
The twenty-first century is defined by the rapid integration of Artificial Intelligence (AI) into the fabric of the global economy. From the complex algorithms that power supply chains to the large language models (LLMs) and generative AI that are reshaping creative and knowledge industries, the computational appetite of these technologies is driving an unprecedented expansion of digital infrastructure. This expansion is physical, material and resource-intensive, manifesting in the construction of massive, centralized data centres. While the substantial carbon footprint associated with training and operating these models has been a subject of intense scientific and public scrutiny, the industry’s immense and equally critical consumption of freshwater remains a less visible but profound environmental externality.
Data centres require vast quantities of water for cooling their servers, a direct demand that impacts local water supplies. However, a significant indirect or “virtual” water footprint is also embedded in the electricity required to power these facilities. This is particularly true in regions dependent on water-intensive energy sources like hydropower or thermoelectric plants, creating a complex energy-water nexus where digital growth can directly exacerbate regional water stress and create new systemic vulnerabilities.
Brazil: A nexus of opportunity and vulnerability
Nowhere is this tension more acute or illustrative than in Brazil. The nation is a global leader in renewable energy, with a grid dominated by hydropower, and is home to the vast water resources of the Amazon basin. Yet, this seeming abundance masks a growing fragility. The country’s hydrological systems are under unprecedented pressure. Climate change is inducing more frequent and severe droughts, such as the historic crisis of 2021 that pushed the energy system to the brink. This is compounded by rising industrial demand and extensive deforestation in the Amazon, which disrupts the atmospheric moisture transport systems, known as “flying rivers,” essential for rainfall and climate stability across the continent. This fragility presents a direct and growing threat to Brazil’s energy security, its agricultural sector and its ability to meet the UN’s Sustainable Development Goals (SDGs), particularly SDG 6 (Clean Water and Sanitation) and SDG 7 (Affordable and Clean Energy).
It is at this fragile intersection that the global technology industry is rapidly expanding, drawn by market potential and renewable energy credentials. This new infrastructure draws immense and constant power from a national grid that is over 60% reliant on hydropower dams, many of which are located in, or are hydrologically connected to, the Amazon basin. During droughts, as reservoir levels fall, the grid’s capacity becomes unstable, forcing a national shift to more expensive, carbon-intensive and often more water-intensive thermoelectric power plants. This establishes a dangerous feedback loop: the inelastic, 24/7 operational demand of AI infrastructure places a peak strain on water and energy systems precisely when they are most vulnerable. This transforms the digital economy from a passive consumer into an active driver of water insecurity. This dynamic threatens not only urban water and energy systems but also the health of terrestrial and aquatic ecosystems (SDG 15) and national efforts to mitigate climate change (SDG 13).
Research objectives
Despite the critical importance of this issue, the regional water footprint of AI in hydrologically sensitive areas remains largely unquantified. This study aims to fill this gap by addressing the following research questions: (1) What is the total (direct and indirect) water footprint of the primary AI data centre cluster in Brazil? (2) How does this footprint stress the regional water-energy nexus, particularly under drought conditions? (3) What are the broader ecological and policy implications of this hidden water demand? To answer these questions, we apply a novel modelling framework to quantify the water footprint of AI infrastructure in Brazil, arguing that current corporate sustainability metrics, which focus primarily on carbon, fail to account for this critical impact on water security and biodiversity.
Literature review
The resource intensity of the digital economy
The notion of the “cloud” as an ethereal, weightless entity has been thoroughly debunked by scholars like Crawford (Reference Crawford2021), who highlight its physical and planetary costs. The energy consumption of data centres has been a primary focus of this research. Studies by Masanet et al. (Reference Masanet, Shehabi, Lei, Smith and Koomey2020) and Jones (Reference Jones2018) have sought to quantify the global electricity use of data infrastructure, noting the challenges of accurate measurement but agreeing on a significant and growing demand. Strubell et al. (Reference Strubell, Ganesh and McCallum2020) focused specifically on the energy and carbon costs of training large AI models, revealing the computationally intensive nature of modern deep learning. However, this body of work has predominantly focused on energy and its associated carbon emissions, often overlooking water as a critical resource vector. Recent scholarship has begun to broaden this scope. Li et al. (Reference Li, Yang, Islam and Ren2025) highlighted the urgency of “making AI less thirsty” by optimizing on-chip computations, though their focus remained primarily on hardware rather than watershed-level impacts.
The water-energy nexus and virtual water
The concept of the water-energy nexus provides the theoretical lens for this study. It describes the deep-seated interdependencies between water and energy systems: water is required to produce energy, and energy is required to treat and transport water. The concept of “virtual water,” or the water embedded in the production of goods and services, is crucial for understanding the indirect footprint of data centres. Mekonnen et al. (Reference Mekonnen, Gerbens-Leenes and Hoekstra2015) provided a foundational global assessment of the consumptive water footprint of electricity, quantifying the significant water losses, particularly from hydropower reservoir evaporation. This research allows us to connect electricity consumption in one location (a data centre) to water consumption in another (a distant dam).
Greenwashing and corporate sustainability
As environmental concerns have grown, many technology companies have pledged to power their operations with “100% renewable energy” (Cook et al., Reference Cook, Lee, Tsai, Kong, Deans, Johnson and Jardim2017). While a positive step, this claim can function as a form of “greenwashing” if it is not critically examined (Delmas and Burbano, Reference Delmas and Burbano2011). Sourcing energy from a large-scale hydropower grid in a water-stressed, biodiverse country presents a classic case. The energy is renewable, but its production has profound negative externalities on water availability and ecosystem health that are not captured in a carbon-only metric.
Identifying the research gap
This review reveals a critical research gap at the intersection of these fields. While the energy use of AI is well-documented and the water footprint of energy is understood, there is a lack of spatially explicit, integrated assessments that quantify the total water footprint of AI infrastructure in hydrologically sensitive, hydropower-dependent regions. This gap is particularly concerning as recent studies highlight the acute vulnerability of South American energy grids to climate-driven hydrological variability (Mercure et al., Reference Mercure, Paim, Bocquillon, Lindner, Salas, Martinelli, Berchin, de Andrade Guerra, Derani, de Albuquerque Junior, Ribeiro, Knobloch, Pollitt, Edwards, Holden, Foley, Schaphoff, Faraco and Vinuales2019). This study addresses this gap by using Brazil as a case study to model the direct and indirect water footprint of a major AI hub, providing a template for similar analyses globally.
Methodology
Conceptual framework
This study adapts a data-driven framework previously developed for quantifying the energy and carbon impacts of AI and reconfigures it to model water consumption as the primary output. The model is designed to differentiate between two key, interconnected impact pathways, which together constitute the total water footprint.
Direct water consumption: This is the on-site water withdrawn from local sources (e.g., municipal supplies and rivers) and consumed for cooling data centre servers. We focus on evaporative cooling systems, which are predominant in Brazil due to their high energy efficiency in tropical climates compared to air-cooled chillers. In these systems, consumption occurs as water is evaporated to dissipate heat. This is a direct measure of the facility’s impact on its immediate watershed.
Indirect (virtual) water consumption: This represents the “hidden” water consumed during the generation of the electricity used by the data centre. It is calculated based on the regional energy grid mix and the specific water intensity factors of each generation source. For example, hydropower reservoirs lose vast amounts of water to evaporation from their surfaces, and thermoelectric plants use water for their cooling cycles. This pathway links urban data centres to distant, often ecologically sensitive, watersheds.
Data acquisition and integration
To operationalize this model, we synthesized several publicly available, high-resolution datasets and utilized a defined set of inclusion criteria to construct a hybrid inventory:
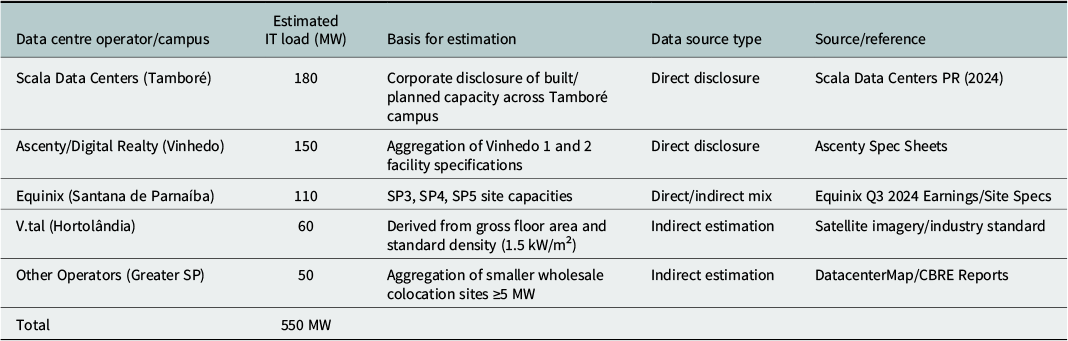
Data Centre Inventory Construction: We compiled a hybrid inventory of major data centres in Brazil, focusing on the São Paulo metropolitan region. To be included in the inventory, facilities had to meet the following criteria: (1) Operational status active as of Q4 2024; (2) Classified as hyperscale or wholesale colocation (excluding small enterprise server rooms); and (3) Estimated IT load capacity ≥5 MW. We mapped their locations using public records and estimated their operational IT load (in MW) based on a combination of industry reports, public corporate disclosures and technical specifications of the facilities. Estimation uncertainty: Where exact load data was proprietary, we applied industry-standard density estimates (1.5 kW/m2) based on facility gross floor area derived from satellite imagery. For full details based on estimation for each site, including data sources and direct versus indirect estimation methods, please refer to Appendix A.
Hydrological data: We utilized hydrological data from Brazil’s National Water Agency (Agência Nacional de Águas, ANA) to understand regional water availability. Crucially, we used watershed-level water stress indices from the World Resources Institute’s (WRI) Aqueduct platform (Hofste et al., Reference Hofste, Kuzma, Walker, Sutanudjaja, Bierkens, Kuijper, Sanchez, Van Beek, Wada, Rodríguez and Reig2019), which measures the ratio of total water withdrawals to available renewable surface water supplies, to characterize the baseline water stress in regions hosting the data centres.
Energy grid mix data: We obtained detailed, time-resolved energy generation mix data from the National Grid Operator (Operador Nacional do Sistema Elétrico, ONS). For the baseline scenario, we utilized the 5-year average (2018–2022) for the Southeast/Central-West subsystem. For the drought scenario, we utilized the specific monthly generation mix from the peak of the water crisis (September 2021).
Water intensity factors: We used established consumptive water intensity factors (in cubic metres per megawatt-hour, m3/MWh) for Brazil’s primary power sources. These were derived from a comprehensive global assessment in the peer-reviewed literature (Mekonnen et al., Reference Mekonnen, Gerbens-Leenes and Hoekstra2015), adjusted to reflect regional specificities (see section “Limitations and sensitivity of attribution”).
Quantitative model and scenario analysis
The total water footprint (WFTotal) for the data centre cluster was calculated annually as follows:
 $$ W{F}_{Total}=\left({E}_{IT}\times WU{E}_{direct}\right)+\sum_{i=1}^n\left({P}_i\times {I}_{wate{r}_i}\times {E}_{Total}\right), $$
where:
-
• E IT is the annual energy consumed by IT equipment (in kWh).
-
• WUEdirect is the direct water usage effectiveness at the facility (in m3/kWh).
-
• E Total is the total annual energy consumed by the facility (E IT × PUE).
-
• Pi is the proportion of energy from source i in the local grid mix.
-
• I wateri is the water intensity factor for energy source i (in m3/kWh).
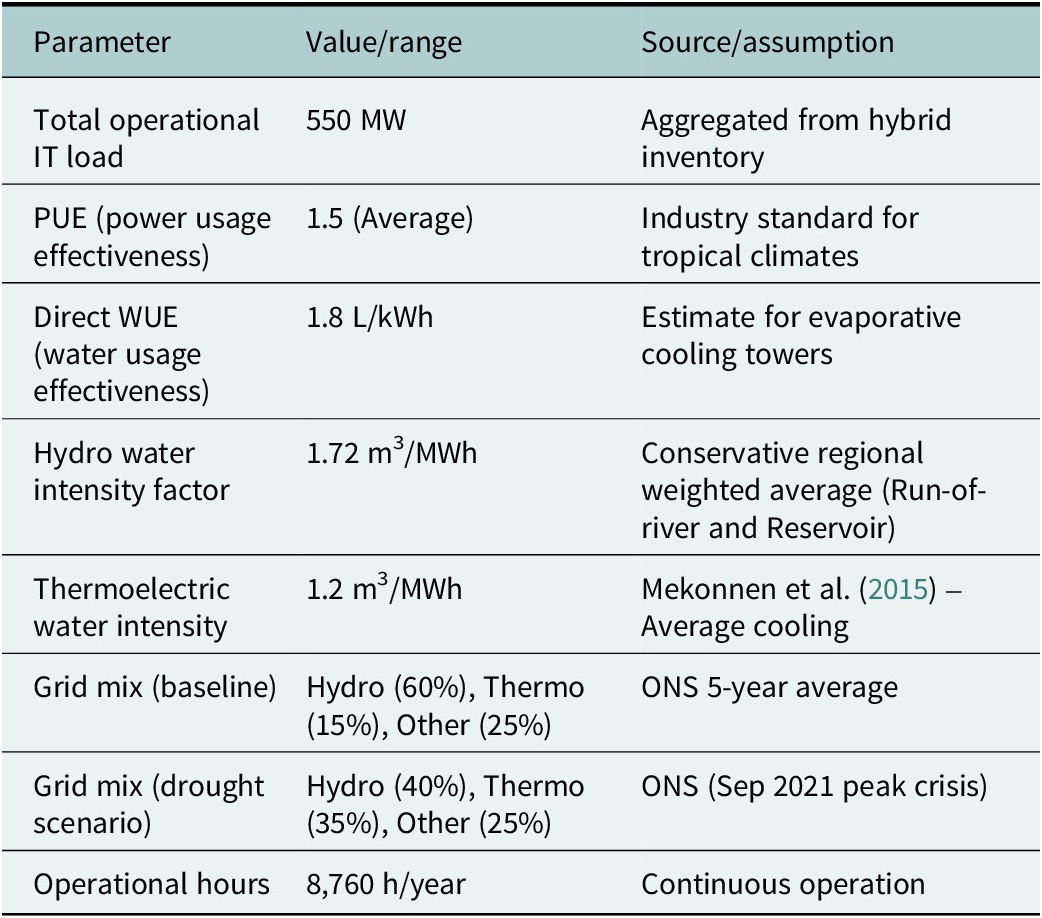
To ensure reproducibility, the key parameters used in the model are detailed in Table 1.
Model input parameters and assumptions

Worked example calculation
To ensure reproducibility and explicit unit consistency, we provide the step-by-step calculation for the baseline scenario below:
-
1) Total annual IT energy (E IT):550 MW × 8,760 h = 4,818,000 MWh = 4,818,000,000 kWh
-
2) Direct water consumption:4,818,000,000 kWh × 1.8 L/kWh = 8,672,400,000 L = 8,672,400 m3
-
3) Total facility energy (E Total):4,818,000 MWh × 1.5 (PUE) = 7,227,000 MWh
-
4) Indirect water consumption (hydropower contribution):EnergyHydro = 7,227,000 MWh × 0.60 (Grid share) = 4,336,200 MWh.WaterHydro = 4,336,200 MWh × 1.72 m3/MWh = 7,458,264 m3.Note: Minor variances in final totals (e.g., 7.44 M vs. 7.45 M) are due to the inclusion of minor grid sources (solar/wind) in the full model, which have negligible water footprints.
Limitations and sensitivity of attribution
This study relies on publicly available data, which necessitates certain assumptions. IT load and PUE values are estimates based on industry averages, as precise, real-time data are proprietary.
A critical methodological limitation lies in the attribution of evaporation to hydropower generation. There is ongoing debate regarding whether to use “Gross” evaporation (total reservoir evaporation) or “Net” evaporation (subtracting pre-dam evapotranspiration). Furthermore, the choice between “Average” (allocating evaporation to all users equally) and “Marginal” (allocating based on the additional stress of the new load) significantly impacts results. We utilized a conservative “Average” intensity factor (1.72 m3/MWh). However, we acknowledge that in a marginal analysis during drought conditions, where reservoir levels are critical, the effective water cost of drawing down the final reserves would be significantly higher. Conversely, if the load is powered primarily by run-of-river plants with minimal reservoirs, the footprint would be lower. Our selected factor represents a weighted mean attempting to balance these extremes.
Results
The São Paulo hub: A concentration of demand in a high-stress region
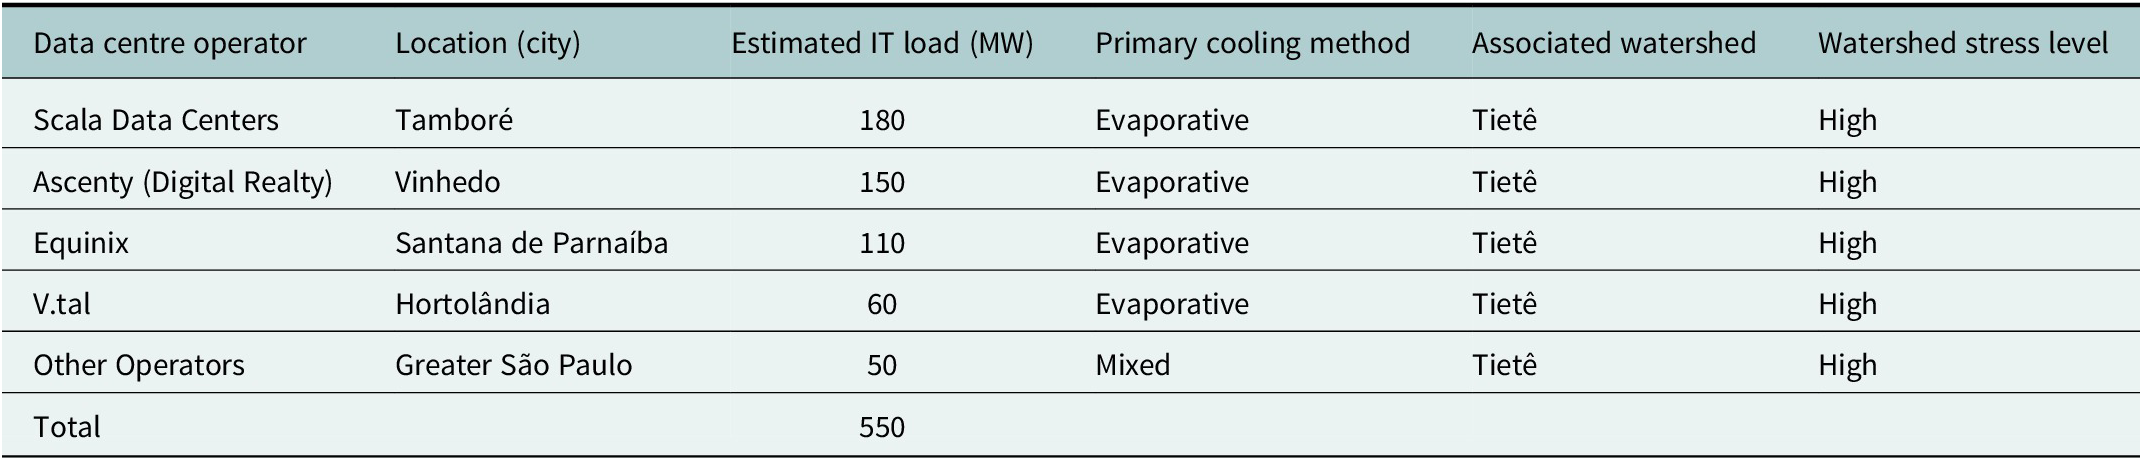
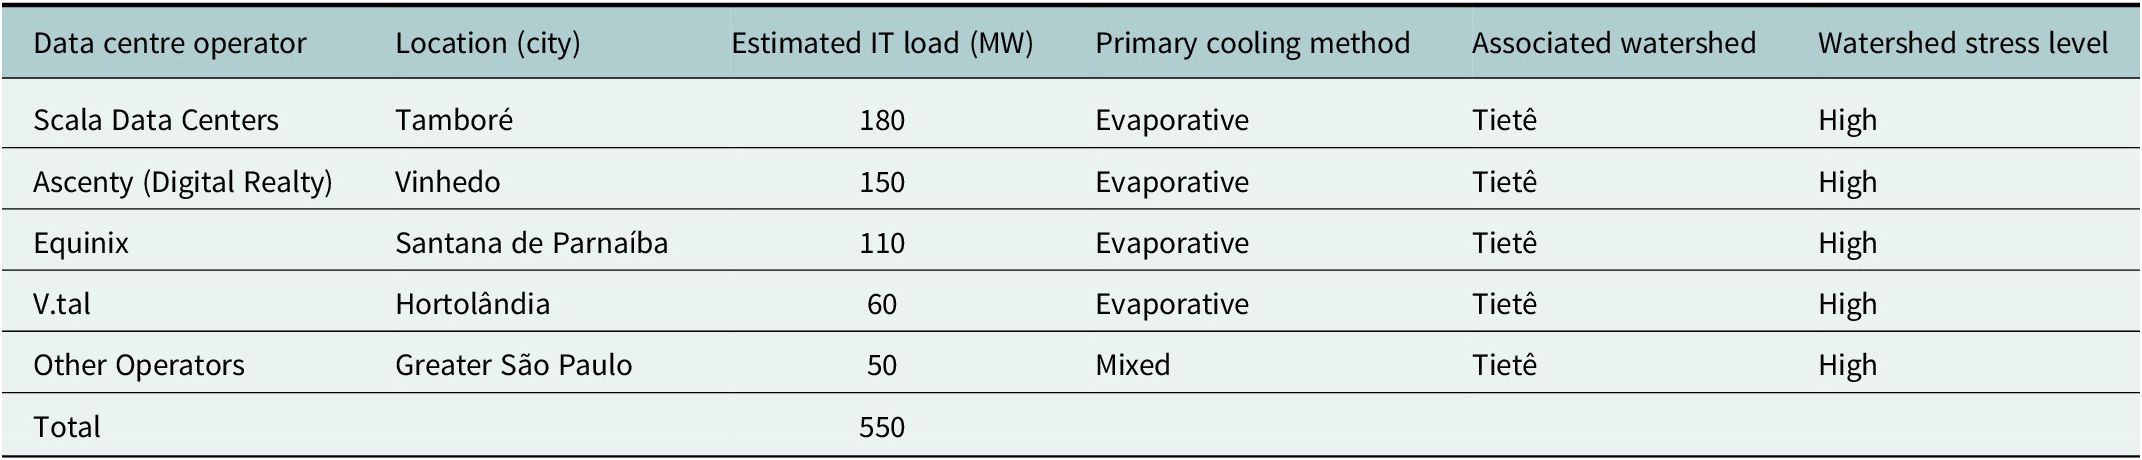
Our analysis identifies the São Paulo metropolitan area as the preeminent data centre hub in Brazil, with an estimated operational IT load of 550 MW as of late 2024. Geospatial analysis reveals this cluster is situated within the Alto Tietê watershed, a basin already classified by the ANA and WRI as experiencing high-to-critical water stress. This is the same watershed that supplies water to over 20 million people and experienced severe crises in 2014–2015, highlighting the pre-existing vulnerability of the region to new, large-scale water demands (Table 2).
Hybrid inventory of major data centres in the São Paulo region (estimated IT load derived from market intelligence and corporate disclosures)
Quantifying the total water footprint
Applying our quantitative model under normal grid conditions (average of 2018–2022), the total annual water footprint of this 550 MW cluster is 16.1 million cubic metres (16,105,260 m3). To contextualize this volume, it is equivalent to the annual water consumption of over 100,000 Brazilian households, the amount of water needed to produce over 10,000 tons of beef, or more than 6,400 Olympic-sized swimming pools.
This total is composed of:
-
• Direct water consumption (cooling): 8,658,000 m3 (53.7% of total).
-
• Indirect water consumption (energy): 7,447,260 m3 (46.3% of total).
It is important to note that this industrial footprint represents a concentrated marginal demand. Unlike distributed domestic use, this demand is geographically localized and continuous, exerting specific pressure on the Alto Tietê watershed’s reserve capacity during critical dry periods.
Note that the slight variance between the step-by-step illustrative calculation provided in section “Worked example calculation” and these final comprehensive totals is due to the inclusion of minor grid sources (such as solar and wind) in the full model, which have negligible water footprints but slightly alter the total energy ratios.
The drought multiplier effect
The results of our drought scenario analysis are stark. When modelling the 2021 grid shift, where hydropower’s contribution dropped and thermoelectric generation surged to fill the gap, the indirect water consumption for the same data centre load increased to 9,475,050 m3. This represents a 27.2% increase in the water intensity of AI operations. This surge heightens competition for scarce water resources in a region already under extreme stress, pitting the digital economy directly against residential and agricultural needs.
Sensitivity analysis
Given the reliance on estimated parameters for IT load and cooling efficiency, we performed a sensitivity analysis to test the robustness of the 16.1 million m3 estimate. We varied the water usage effectiveness (WUE) and power usage effectiveness (PUE) by ±20% to represent best-case (highly efficient) and worst-case (older infrastructure) scenarios.
Low-intensity scenario (high efficiency): Assuming a PUE of 1.2 and WUE of 1.44 L/kWh, the total water footprint decreases to ~12.5 million m3.
High-intensity scenario (low efficiency): Assuming a PUE of 1.8 and WUE of 2.16 L/kWh, the total water footprint rises to ~19.8 million m3.
Even in the conservative low-intensity scenario, the water footprint remains significant (over 12 million m3), confirming that the pressure on the São Paulo watershed is material regardless of minor variations in operational efficiency.
Hydropower attribution scenario: Because the allocation of reservoir evaporation is highly sensitive to the chosen accounting method, we tested alternative attribution factors. If a strictly run-of-river factor (e.g., 0.1 m3/MWh) were applied instead of the regional average, the indirect footprint drops significantly, bringing the total water footprint to ~9.1 million m3. Conversely, applying a marginal reservoir depletion factor (e.g., 4.0 m3/MWh) to simulate the extreme stress of drawing down final drought reserves would push the total footprint to nearly 26 million m3. This highlights that while our central estimate of 16.1 million m3 is robust, the actual environmental burden fluctuates heavily based on the specific hydrological dynamics of the supplying dams.
Discussion
The illusion of “green” hydropower
These findings reveal that the most significant environmental impact is not merely the total volume of water consumed, but its timing, location and systemic implications. The inelastic, 24/7, non-negotiable energy demand of AI infrastructure creates a peak resource strain precisely when energy and water systems are at their most vulnerable. This analysis suggests a need to reconsider the prevailing corporate sustainability narrative focused on achieving “100% renewable energy.” While commendable, sourcing energy from a drought-prone hydropower grid may risk prioritizing carbon metrics over broader ecosystem health. Existing literature links the construction and operation of large dams in Brazil to mass deforestation for reservoir creation, significant methane emissions and the disruption of aquatic ecosystems (Hönke et al., Reference Hönke, Cezne and Yang2024). While our model specifically quantifies water volume rather than direct ecological damage, these findings point to broader implications for regional biodiversity. Relying on large-scale hydropower suggests that “green” energy for AI could carry hidden ecological costs not captured in carbon-only metrics.
Environmental justice and the externalization of risk
This dynamic highlights potential implications for environmental justice. Our findings suggest that the ecological and social burden of the digital economy could be inadvertently transferred from affluent urban tech hubs to remote, rural communities in the Amazon and Cerrado biomes. The pursuit of digital progress in São Paulo relies on energy generation that contributes to ecological degradation hundreds or thousands of kilometres away, undermining the very natural systems Brazil depends upon for climate stability. We argue that current environmental impact assessments and corporate governance frameworks for digital infrastructure have a critical blind spot: they focus on the immediate locality of the data centre while completely missing the vast, upstream, indirect water and biodiversity footprint.
Systemic fragility and climate feedback loops
The Brazilian case study demonstrates how AI infrastructure can act as a “risk multiplier” in the face of climate change. Adding large, inflexible demand to a vulnerable system reduces the grid’s resilience and capacity to adapt during climate shocks like droughts. This can lead to cascading failures in the water-energy-food nexus, where electricity shortages impact water pumping for irrigation and sanitation, and water shortages impact electricity production and food security.
Global implications: A cautionary tale
Brazil is not unique. Many developing nations in Asia, Africa and Latin America are pursuing rapid digital development while facing similar hydrological and energy challenges. While this data is specific to São Paulo, the methodology serves as a template for other hydropower-dependent tech hubs, such as the Pacific Northwest (USA) or regions in Scandinavia. The Brazilian case serves as a crucial cautionary tale, highlighting the need for proactive, integrated planning to ensure that the pursuit of digital innovation does not lead to unintended and severe environmental consequences.
Conclusion and recommendations
Conclusion
This study demonstrates that the global expansion of AI is fundamentally a story about water. Our framework provides a replicable method for quantifying this footprint, revealing a significant and underappreciated strain on the critical water-energy nexus in Brazil. The “cloud” is not an ethereal concept; it is a network of physical facilities with a very material thirst, one that has profound consequences for watershed health, energy security and biodiversity. Our findings underscore the urgent need for a paradigm shift in both corporate sustainability reporting and public policy. A sustainable digital future requires moving beyond carbon-centric metrics to embrace genuine water stewardship and ecosystem-level thinking.
Policy and industry recommendations
Mandate integrated water and energy reporting: Regulators, such as Brazil’s ANA and ANEEL (National Electric Energy Agency), should collaborate to create a mandatory reporting framework for large energy users. This should require data centre operators to report both direct water use (WUE) and their indirect, grid-sourced water footprint.
Incorporate water risk into strategic planning: National and state-level economic planning must integrate digital infrastructure strategy with water and energy resource management. Siting for new data centres should be guided by comprehensive watershed health and climate vulnerability assessments.
Incentivize water-smart technologies and locations: Governments should create strong incentives for data centres that deploy water-free cooling technologies (like direct liquid cooling or air-cooled chillers) or choose to locate in regions with low water stress.
Promote “Green AI” research: Foster research and development into more computationally efficient AI models and hardware that can deliver performance with a smaller environmental (energy and water) footprint (Goralski and Tan, Reference Goralski and Tan2020).
Future projections and research directions
Looking ahead, these findings represent a conservative baseline. With projections for AI-driven data traffic in Latin America set to triple by 2030 (Cisco, 2020), the associated water footprint could escalate to over 45–50 million m3 annually in the São Paulo region alone, assuming no significant changes in cooling or energy-sourcing technology. This aligns with broader concerns about the escalating energy and material costs of artificial intelligence globally (De Vries, Reference De Vries2023). Future work should seek to apply this framework to other hydrologically vulnerable tech hubs globally and integrate economic models to quantify the externality costs of AI’s water consumption.
Open peer review
To view the open peer review materials for this article, please visit http://doi.org/10.1017/wat.2026.10020.
Data availability statement
The hydrological data used in this study are available from the Brazilian National Water Agency (ANA) at https://www.gov.br/ana. The energy data are available from the ONS Public Data Portal at https://dados.ons.org.br/.
Author contribution
G.L. conceptualized the study, performed the data analysis and wrote the manuscript.
Financial support
This research received no specific grant from any funding agency, commercial or not-for-profit sectors.
Competing interests
The authors declare none.
Ethics statement
Not applicable. This study relies entirely on publicly available, anonymized, and aggregated industrial data and does not involve human or animal subjects.
Declaration of generative AI
During the preparation of this work, the authors used Large Language Models (LLMs) to assist with language editing. All concepts, data analysis and scientific conclusions were generated and verified solely by the authors, who take full responsibility for the content of the publication.
Appendix A: Supplementary inventory data
Detailed breakdown of the hybrid inventory of major data centres in the São Paulo region, outlining the basis for IT load estimation


 Open access


Comments
No accompanying comment.