

Introduction
The decision of a majority of British citizens to vote in June 2016 to leave the European Union (EU) will have wide-ranging implications for social policy, as others in this journal issue testify. This paper focuses on one of the least frequently discussed but one of the most important: the impact of Brexit on the relative power and influence of capital on social and public policy. One of the main slogans of the Leave campaign was that the referendum offered the opportunity for the UK to ‘take back control’ from the EU. Yet, the early signs are that Brexit is dramatically empowering capital at the same time it is disempowering the state and citizens, with major implications for the welfare state. Although the details of the UK's withdrawal from the EU are still to be worked out, the referendum result has already had an impact. In the most optimistic scenario, the UK will forge new methods for attracting capital post-Brexit, navigating the forthcoming period of uncertainty and instability by transforming itself into a highly-skilled, productive and competitive business environment upon which it can rebuild its welfare state. Less positively, at least for those who favour progressive social policy outcomes, the UK will face unprecedented pressure to further liberalise its economy, its labour markets and its welfare state. The path it steers between these two scenarios will depend, to some extent, on the nature of the final deal that is eventually carved out. But much of the theory and empirical work carried out over the past thirty years, coupled with observations of the current constellation of economic and political power, would suggest that the second scenario is likely to be closer to reality. This paper traces the complex relationship between the competition for capital investment, the relative power of different businesses and the implications of these relationships for social policy. It goes on to examine how the UK has pursued private corporate investment, both in previous years compared with other economies and during the months since the referendum, asking what this tells us about the relative power of capital and the likely impact of this on the UK's welfare state in future. It argues that the unique way in which the UK has attracted investment from transnational corporations in particular during the past three decades places it in a more challenging position than it would otherwise have faced. Lastly, it considers several possible outlooks for British social policy in the post-Brexit period.
Asymmetrical dependence on private capital investment: implications for the welfare state
The European Union is a social and political union but, first and foremost, it is a trading bloc within which countries compete for market share and private investment within a framework of common principles relating to minimum regulatory measures in various areas. The way in which they do so varies between states, but also has implications for the distribution of power, especially between business and other actors, the social contract, working conditions and the shape and form of welfare states. The major threat of Brexit is that it effectively tears up the UK's established ‘contract’ with capital which will have to be renegotiated and, in all likelihood, with compensatory measures. The problem is that this previous contract was based on a particular set of policies that are incredibly ‘sticky’ upwards, especially in the areas of regulations and taxation, meaning that it is far easier to reduce either one than increase them. Moreover, the very nature of the UK's competitiveness model places the UK government, smaller businesses, citizens and trade unions in a particularly weak position vis-à-vis big business and the other remaining EU countries.
Governments and citizens in capitalist economies depend on the ability of nation states to capture and retain private business investment. The collective investments of businesses are major determinants of production levels, consumption, employment, economic growth and tax revenues within capitalist economies (Gough, Reference Gough1979; Gill and Law, Reference Gill and Law1989: 475–99; Lindblom, Reference Lindblom1977; Winters, Reference Winters1996; Offe and Ronge, Reference Offe, Ronge and Offe1984). Foreign direct investment (FDI) also tends to bring higher levels of productivity and pays higher wages (Dhingra et al., Reference Dhingra, Ottaviano, Sampson and Van Reenen2016). Whilst politicians may answer ultimately to citizens in devising their own investment strategies, for all their importance business investment decisions are private decisions, taken by owners and company CEOs after calculating any potential returns: governments are dependent on private business investment, but they cannot compel private businesses to invest.
Herein lies the essence of the structural power of capital thesis (for a more detailed discussion see Block, Reference Block1977: 6–28; Farnsworth, Reference Farnsworth2004; Ward, Reference Ward1986). Power is described here as ‘structural’ because it relies not upon the actions of businesses (lobbying and related activities) but the potential economic harms that result if governments fail to create the right conditions for businesses to prosper and invest. Business investment decisions – actual, planned or abandoned – are continually communicated to governments through lobbying, the financial press, business surveys, and aggregated financial data which, along with investment decisions, operate as ‘signalling devices’ that shape policy responses (Vogel, Reference Vogel1989). For their part, businesses are only too aware of the importance of their investment and frequently utilise the threat of ‘exit’ through their ‘voice’ to extract a better deal (Hirschman, Reference Hirschman1990), in addition to pushing for new initiatives that reduce the costs and/or risks associated with any investment they make. Thus, structural power exists alongside agency power which is exercised through lobbying and other forms of direct pressure. Indeed, structural power shapes the context within which agents act and therefore underpins, constrains or shapes agency.
The variability of business power
To argue that private business investment has important, long-lasting effects on growth, tax revenues, jobs and incomes – and that this fact can persuade governments and workers to operate in the interests of businesses – is not the same as arguing that policy will always reflect business needs and interests. Not only does business power vary, but certain demands or needs of business can be highly compatible with higher skill levels, more healthy workers, better infrastructure and even higher wages (if they are either subsidised by the state or they help to increase demand across the economy for higher-value goods) (see, for instance, Mares, Reference Mares2001; Swenson, Reference Swenson2002). Much depends on the particular business in question and even more depends on the particular business model of the business in question. As the literature on various capitalisms illustrates (Esping-Andersen, Reference Esping-Andersen1990; Hall and Soskice, Reference Hall and Soskice2001; Hicks and Kenworthy, Reference Hicks and Kenworthy2003: 27–61; Witt and Jackson, Reference Witt and Jackson2016: 778–806), different nations have different histories, traditions, regulatory environments, governance arrangements and institutions – all of which help to mould and steer policy making in different ways. Within various national contexts, governments juggle the specific demands, interests and needs of economic and non-economic actors, and the welfare state plays a particularly important role in this in managing conflicting interests and balancing economic and social needs. Hall and Soskice (Reference Hall and Soskice2001) note that different models of capitalism achieve this in different ways: liberal market economies (such as the UK) do so through competitive markets, adversarial labour relations and private market-based decisions; coordinated market economies (including most across the rest of the EU) do so through state-mediated markets, collective agreements and more strategic cooperation between economic interests (Hall and Soskice, Reference Hall and Soskice2001). Hall and Soskice, in fact, over-estimate the extent to which businesses are ‘un-coordinated’ within liberal market economies – governments within liberal economies provide a great deal of support to private businesses, in certain instances, greater support than is provided in coordinated economies (Farnsworth, Reference Farnsworth2012; Le Roy, Reference Le Roy2005; Thomas, Reference Thomas2000) – but it remains the case that the UK and similar economies tend to compete more vigorously on the basis of labour market flexibility, lower regulations and lower (corporate) tax rates. And businesses bargain with states in different ways across different states (Thomas, Reference Thomas2000).
Much depends on what businesses want and need from different states, what attracts them to particular spaces and what options they effectively have. Whilst the direct effects on governments and citizens may be the same in the short term, the reasons that lie behind a decision to relocate investment are likely to prove more important to the direction of policy. If a business invests elsewhere because it needs or wants to access raw materials or exceptionally cheap-labour (such as is available only in developing economies), it is likely to present less of a ‘signal’ to governments that they need to change tack. If they are simply expanding in other locations, governments may not be concerned at all. But if they are switching investment from one location to another and a current host economy is able to genuinely compete for lost investment, governments will tend to act.
Also important is the relative mobility of capital (not all businesses are equally mobile), the extent to which nations depend upon, or value, particular forms of investment, and the relative power of rival interests, in particular trade unions. All of these factors depend, in turn, on the way in which states compete for and induce business investments, and it is to this latter issue that the following sections turn.
Investment within various capitalisms: a note on methodology
The following sections of the paper piece together empirical evidence on national competition strategies for investment, with a comparative focus on eight countries: Sweden, France, Germany, Canada, Japan, Ireland, Italy and the UK. These countries make up a good cross-section of various capitalisms (Hall and Soskice, Reference Hall and Soskice2001) that include key countries that fall within each of Esping-Andersen's ‘Three Worlds’ typology and are a representative sample against which to compare and contrast the UK's investment model.
Each of these economies have in place dedicated government departments that are charged with coordinating national strategies to induce existing companies to invest within their borders. Such departments effectively advertise their national ‘offer’ and aim to convince international capital that theirs is the best space in which to locate their business. Not only are they a part of key government departments, they also work closely with the most senior members of government in liaising with various businesses. It is usual for the various websites and promotional materials to include statements from prime ministers or presidents in order to add weight to the inducements and other policy promises on offer.
Regarding methods, this paper examines some of the key documents that have detailed the inducements offered to potential investors in recent years, primarily within the UK, with examples from elsewhere in order to provide comparative context, alongside statements from companies and the largest business associations that featured in the media and in government inquiries between July 2016 and March 2017. They were selected on the basis that they represented the most authoritative statement regarding investment climate produced by national ‘invest-in’ bureaus (e.g. Invest-In-Britain, Invest-in-France – just about every country has an equivalent institution) that are situated within government departments, and have the key remit of selling national investment environments to businesses. The documents that were finally selected were those that were the most recently produced and offered the most detailed and comprehensive ‘sales pitch’ to investors, as opposed to general reports or research papers. Such documents tended to also be the most detailed and high-profile documents available on the relevant ‘invest-in’ websites. The documents were then coded using QDA Miner, a content analysis package. Documents were examined through an iterative process which identified and coded the key incentives offered to investors by each country. In each case, the search and coding was extended to the other countries in the sample. Next, a search was carried out of key adjectives (lowest, highest, best, most competitive etc) in order both to locate any remaining incentives, and to capture the key features that are identified by the country in question that they feel gives them a competitive edge.
In addition to this qualitative exercise, a quantitative text analysis tool within QDA Miner – WordStat – was applied to the texts. This was used to: 1) identify keywords according to their frequency; 2) gauge the strength of their association with other keywords; 3) plot the pattern of relationships between keywords and the individual countries. The value of this particular method is that it reduces the role of researcher from having to actively select and code particular words and/or phrases, with the attendant scope for error and bias. A cross-tabular analysis was then run to measure the strength of association between keywords and countries, and the relative closeness between these keywords and the country cases. The final step was to plot these results in a two-dimensional visualisation.
The UK's competitive strategy in context
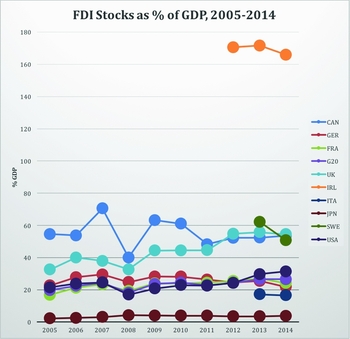
Earlier sections have argued that the extent to which businesses, either head companies or subsidiaries, are mobile is important to how corporate power is exercised. As one of the earliest economies to liberalise, and as an economy that has competed vigorously to attract mobile capital, the UK has become relatively highly dependent on foreign direct investment (compared with other countries) looking to take advantage of the particular policy mix on offer. This is illustrated in Figure 1, which reveals the level of foreign direct investment (FDI) stocks within a range of OECD economies for which data over the period was available. Ireland is by far the most exposed to foreign capital (and it has deliberately carved out a strategy to attract such investment through, for example, its introduction of the lowest rate of corporation tax in the OECD (see OECD, 2016a)). The UK has not only increased its relative dependence on such capital in recent years, it has managed to secure the second-highest level of inward investment in the EU. It has twice the average G20 level of FDI-funded capital investment. Japan, at the lowest extreme, has historically had high levels of outward FDI (to other countries) but low levels of inward FDI (ibid.). Perhaps most importantly, given the overarching focus on Brexit in this Special Issue of the journal, half of all FDI into the UK comes from other members of the EU (Dhingra et al., Reference Dhingra, Ottaviano, Sampson and Van Reenen2016) and much of it is attracted to the UK because it provides favourable and unfettered access to EU markets.
FDI Stocks as % of GDP, 2005–2014
Drilling down into the UK data is even more revealing. Data on the composition of the British economy, released in 2014 by the Office for National Statistics (ONS, 2014), revealed that whilst just 1 per cent of businesses registered in the UK were foreign-owned, these companies contributed 29 per cent of gross UK value added (which measures income generated by a company minus the costs of goods and services used to create income). By origin of ownership, the largest single economy that contributed most in terms of value added was the US (at 11 per cent). But this was matched by companies originating from the EU. Investment from France, Germany, the Netherlands and Spain make up almost 9 per cent of total value added. By continent, over half were owned by European businesses (excluding the UK) with one-third owned by North and South American companies. These data highlight how heavily dependent on inward investment and relatively mobile transnational companies the UK has become on account of the particular advantages, incentives and inducements it offers. As already noted with reference to Dhingra et al. (Reference Dhingra, Ottaviano, Sampson and Van Reenen2016), many of these companies have their base in EU economies and made their investment choice based on what the UK offers compared with other EU nations. Others are companies that have invested in the UK on the basis of what it offers, including easy access to EU markets.
Competing for capital the British way
The UK is a pioneer of contemporary practices employed to compete for capital. From the early 1990s, the UK began to put in place more aggressive methods to compete, not only for capital located outside the EU that wanted better and cheaper access to expanding markets, but it openly attempted to poach businesses from more expensive parts of the EU, especially Germany. In 1994, the UK government placed an advertisement in the German business press imploring businesses to relocate to the UK in order to take advantage of its more favourable business environment. An expanded version of the language used in that advertisement was outlined in Reference Eggar1994 by the Minister for Energy and Industry, Tim Eggar, in the House of Commons:
We have a pro-business environment that is unequalled in Europe. . . We have a transport infrastructure that provides fast and easy access to the rest of Europe . . . the English language . . . [and] the best available combination of a skilled and flexible workforce, with lower production costs than our neighbours. By coming to Britain, inward investors get access to the single European market without the costs of the Social Chapter. . . UK non-wage labour costs are below those of nearly all other European Union countries. . . Inward investors also know that they can negotiate single and non-union agreements with an adaptable workforce that is ready to learn new skills and willing to work flexible hours . . . . The UK strike rate has been below the EU average for each of the last nine yearsFootnote 1 .
These early attempts to lay down the UK's ‘offer’ to capital highlight the importance of social policy and labour market policy, alongside more traditional grants and subsidies, as potential draws to businesses. They came to define its approach to investment ever since, forging a very particular contract with capital. Ten years on, the sales pitch had been more carefully honed and the newly formed ‘Invest in Britain Bureau’ had begun producing glossy pamphlets peppered with supporting data to back-up the claims being made. This is what the DTI wrote in 2004:
[The UK offers] Fast, easy access to the EU single market . . . a highly skilled, flexible, English-speaking workforce, and an environment which allows business to prosper. . . Britain's integrated transport network provides fast, low-cost delivery throughout Europe. . . The UK has 28 million skilled and adaptable workers, and high standards of education with a strong emphasis on vocational education and training. Labour market regulations in the UK, including working hours, are the most flexible in Europe, and staffing costs are highly competitive. . . It has the lowest utilities costs in the European Union, and a telecommunications industry that is one of the most advanced in the world. There are tax allowances available for companies setting up in certain areas of the UK. Plus, the UK has the lowest main corporation tax rate of any major industrialised country, and there are no additional local taxes on profits.
Note here the importance of Europe. The whole emphasis of the pitch at the time was that the UK had all the market-access advantages of anywhere else within the EU, but without the costs. Despite subsequently signing up to some of the reforms contained within the ‘social chapter’, including the working time directive, the UK continued to emphasise its competitive advantage on the basis of cost with generous allowances.
The substance of the ‘invest in Britain’ strategy hasn't changed much since. In the forward to the latest (2016) Invest in the UK report, David Cameron wrote, just weeks before the EU referendum:
if you are an overseas business wanting to drive up your profitability and increase your competitiveness, Britain is the place to be. . . [W]e are committed to making this the most open, welcoming, business- friendly country in the world . . . . . For those developing intellectual property here, we are lowering corporation tax further; to those investing in research and development, we are giving tax relief. [W]e have one of the world's leading financial centres. . . [We have] a large, highly-skilled labour force: more adults have completed higher education than anywhere else in Western Europe. . . . if you want to invest, if you want to expand, if you want great incentives and an economy that's going from strength to strength, then come to the UK – our door is firmly open for business.
On the back of promises by the UK government to further reduce corporation tax, the 2015 report again stressed the UK's tax advantages:
Labour costs in the UK are the most competitive in Western Europe, helped by low employer social security contributions. This makes the overall cost of labour lower than countries such as France, Ireland, Netherlands and Germany. Our tax incentives encourage innovation in businesses of every size.
In common with previous statements, the UK's relatively lightily regulated labour market is highlighted, although the more ambiguous ‘flexibility’ statement has given way to a clearer statement on pay and the lack of collective bargaining. Note also, the reference to low national insurance contributions in the UK. And on regulations, the UK emphasises the cost-competitive advantage that accrues to investors in the UK:
The UK [has] the least strict regulation in the EU, and the fourth lowest level within the OECD. . . . Industrial action is at an historic low . . . [N]ot all of the UK's workforce are subject to collective bargaining. Our ground-breaking approach to reducing regulatory burdens is the ‘One-In, Two-Out’ rule. Any increase in the cost of regulation requires us to save twice this amount through the removal of regulations elsewhere. This approach is saving UK businesses over £2 billion a year.
The UK's strategy for competing for capital that emerges from this is relatively clear – but an important question is how it compares with that of other nations and other types of nations.
Strategies to induce investment compared
Moving on to consider how the UK's strategy compares with those of other advanced capitalist economies, Table 1 reveals comparative coding patterns conducted on national competition strategies in 2015, outlining the top nine code categories by frequency for each of the countries. The number in brackets reveals the relative frequency of the various codes compared across different countries (so only the UK stated that it had the ‘lowest corporation tax’ and only Sweden specifically focused on Sweden's positive record in tackling corruption).
Top ten inducements: countries ordered by row totals (figures are percentages of term use)

* denotes wildcards
Together, these coding frequencies reveal much about the distinctiveness of the ways in which these countries compete for international investment. Looking across these eight economies reveals that the UK's distinctive package of incentives – its ‘unique selling points’ – include offering the ‘lowest corporation tax’, ‘low pensions costs’, and ‘low social security costs’. It also views its pensions policies as making a positive contribution to the UK's investment environment. It confirms that the UK uniquely competes for international capital by offering a package of a low-tax, low-cost, low regulatory business environment that promises help, support and protection to businesses. Germany, for example, places greater emphasis on education and training, the efficiency of its workforce and government support to businesses, including financial incentives, subsidies, infrastructure and support for R&D. France similarly emphasises its investment in R&D, training and, rather vaguely, its ‘overall competitiveness’. Italy emphasises its low labour costs, access to consumers, business friendliness, competitiveness, productivity and high quality of life. Sweden and Ireland emphasise their openness, with the former uniquely focusing on its positive industrial relations, equality and efficiency.
Drilling down into the data still further reveals more about the commonalities and uniqueness of competition strategies in different economies. Figure 2 is a correspondence graph that plots keywords according to their frequency and the strength of association between keywords (as one variable) and countries (as a second variable). Based on this measure, the UK and Sweden as lone outliers appear to have the most unique brands. On the correspondence plot, it is closest to Ireland and furthest away from Sweden at one extreme, and France and Japan on another. Canada, Germany and Italy are more centrist in the way they sell their economies to international investors.
Correspondence plot of keyword associations and distances

Policies that bind
The previous sections have illustrated the various ways in which governments compete for capital and some of the potential implications for social and public policy. It illustrates clearly, whether we look at the UK over a number of years or we look at it in comparison with other economies, that it has sold itself in the past as a relatively low-cost business environment that, as a member of the EU, offers free access to European and other markets, but is open, lightly regulated, with relatively cheap, flexible and highly skilled labour. There are huge implications for social policy: less equitable tax systems, lower wages, lower trade union representation, fewer rights at work etc. A relatively small number of policy paths become traversable in this particular policy context (Pierson, Reference Pierson1995, 447–48). The key point is that if the UK had built its investment environment in similar ways to other nations, especially Germany, France or Sweden, it would perhaps have more policy wriggle-room to bargain with businesses and the rest of the EU. If the UK had previously adopted a more coordinated market economy approach – where businesses invest in order to gain access to high-skill sets, comprehensive employer and employee-coordinated training, generous but conditional state support for long-term and sustainable (green) investment, tighter regulatory controls over employment and all underpinned by a robust and fair corporate tax system – this would have enabled it to sell itself differently to investors and in a way that is more conducive to progressive social policy going forward.
The 2008 economic crisis also remains an important backstory, not only insofar as it shaped the referendum debate and result, but because it has lasting consequences for public finances, massively increasing public debt, transforming public expenditure and constraining the available fiscal space. Brexit will add its own ‘costs’, of course, in depressing economic growth and so reducing tax revenues, as well as imposing additional costs in the form of a final ‘divorce settlement’ (Barker and Robinson, Reference Barker and Robinson2016; Giles, Reference Giles2017). All in all, the UK would still have faced pressure to compensate corporations for losses incurred as a result of Brexit, but if it hadn't already given so much away to business since the 1990s, there would have been much more fiscal and regulatory room for manoeuvre. The key questions, to which the next sections of the paper respond, is: how does the UK seek to retain existing investment and compete for new investment going forward and what implications does this have for social policy?
Facing new competition for UK capital
One of the arguments of the Leave campaign was that the rest of the EU is more heavily dependent on trade with the UK than the other way round. The key reason for this is that the UK runs a trade-deficit with the other EU countries. But this reason alone is unlikely to sway the views of the EU-27. Whilst the EU as a whole may depend heavily on achieving a positive trade deal with the UK, this is less true if we turn the focus to the individual countries that make up the EU and who will have to agree the terms of the UK's exit. In only two cases – Ireland and Cyprus – does the UK represent more than 10 per cent of total exports; in the vast majority of EU countries, including France, Italy and Spain, the UK does not even make the top three trading partners (Portes, Reference Portes2015). For Germany, France makes up 9 per cent of exports, the US 9 per cent and the UK 7 per cent (ibid.). For the remaining members of the EU, the relative dangers of not achieving a free trade arrangement with the UK may well be outweighed by the opportunities this presents for them to poach UK businesses that want to retain access to the rest of the EU. Moreover, the lack of a favourable trade deal with the UK will only increase the ability of other EU countries to attract investment from the UK – and many are already making direct appeals to UK companies with a range of new incentives on offer.
Once the dust began to settle on the referendum result, the remaining EU countries began to eye the opportunities offered by the UK's exit with echoes of the UK's previous campaigns to poach businesses from other EU countries. For some countries, including those that have tended to run a trade surplus with the UK, success in acquiring investment from the UK will help to offset the costs of Brexit and, if present trading patterns continue into the future, will help to ensure a continued trade deficit going forward. By April 2017, certain economies were already emerging as the potential winners. According to an investigation by the Financial Times in March, 2017, capital is flocking to the centre of gravity within the EU, the home of the European Central Bank (Shotter et al., Reference Shotter, Noonan and Arnold2017). Paris and Dublin are also making strong plays for London's financial firms. Ireland's head of Industrial Development stated in an interview with the Guardian in October 2016:
Our approach is very clear, we will go after every single piece of mobile [non-finalised] investment. . . Undoubtedly there are more opportunities because of Brexit [and] You can be assured that any opportunities there are, Ireland will seek to take advantage of and we will be in the fray, as will others.
Luxembourg is making a strong play for asset managers whilst Warsaw is positioning itself as a centre of outsourced back-office operations (Arnold, Reference Arnold2017). Moreover, the fact that the Brexit negotiations will lead to instability and higher risks for many companies mean that the US and China will also attract new investment from the UK (ibid.).
One further point that is important here is that the global rules governing trade will set the rules of engagement as states compete with each other. In November 2016, for instance, the EU announced that it would be setting new rules that stipulate that, in order to trade financial services freely into the EU, banks must hold substantial capital within holding companies that are located within one of the member states (Barker et al., Reference Barker, Brunsden and Arnold2016). Although similar rules have also been introduced in the US, it is the EU rules that will have the biggest potential impact on the UK, adding to the attraction of shifting investment to the EU-27. In addition, the European Commission announced in April 2017 that it is seeking to relocate two key European Union agencies, in banking and medicine, which between them employ 1000 people directly but also provide important research and development hubs to which a number of other companies are effectively tied (Boffey, Reference Boffey2017).
Against this backdrop, some businesses will be forced to shift some or all investment to the EU, meaning that the relative dependence of the UK government on remaining investments will be even more important. And, as the following sections will make clear, the UK hasn't got a lot of policy-space in this respect.
Capital empowered
To put it simply, businesses occupy a much more favourable ‘buyer's market’ position following Brexit. What is more, they are only too aware of the changed circumstances they find themselves in. Both businesses and government are calculating the ‘anticipated reactions’ of other actors (Hacker and Pierson, Reference Hacker and Pierson2002: 277–325). Having vigorously lobbied for a Remain vote, most business associations, including the Chambers of Commerce, Confederation of British Industry (CBI), Institute of Directors (IOD), the British Bankers Association and TheCityUK (representing London financial interests) have subsequently sought to emphasise the importance of putting in place measures to retain investment. As KPMG (2016) warned in 2016:
Policy makers should be really concerned about a leaching of British business abroad and should engage with business early to understand what assurances they can offer and closely monitor any shifts overseas.
Theresa May similarly argued, prior to the referendum and becoming Prime Minister, that she is all too aware of the risks:
if we were not in Europe, I think there would be firms and companies who would be looking to say do they need to develop a mainland Europe presence rather than a UK presence (cited in Hopkins and Mason, Reference Hopkins and Mason2017)
John McFarlane, head of Barclays and TheCityUK, a financial services lobby group, told the Financial Times in March, 2017, that the UK government will have to compete even more vigorously to retain investment in future:
There needs to be a tangible, compelling economic or collateral reason to be here or to do business here, rather than somewhere else, and this needs to be renewed continually (cited in Arnold, Reference Arnold2017)
Nissan provides a good early example of things to come. Aware of its strategic importance as a major employer in the North East, and as a key industry in the UK, Nissan threatened to shift investment elsewhere if it didn't extract concessions from the UK government. It was even able to galvanise the Japanese government into lobbying the UK on its behalf. The Japanese government made direct representation to the UK government in a letter (subsequently leaked to the press) pressing it to protect the interests of Japanese companies – most notably Nissan and Toyota. This was enough to earn Nissan a one-to-one appointment with the Prime Minister, the outcome of which was to encourage Nissan to announce its intention to continue to invest in the UK after assurances given to the company (see below). The specific help that Nissan requested include reductions in taxation, including import duties and a specific ‘Brexit’ deal for the automotive industry and additional support to protect and ‘compensate’ Nissan for any additional costs it would have to absorb (see below). Toyota's response was to argue that it required a similarly advantageous deal in order for it to guarantee its own future in Britain (Cox, Reference Cox2017a).
Compensating capital through cost reductions
Regardless of how the Brexit negotiations pan out over the coming years, the UK will have to locate ways of compensating businesses for broken promises and the impositions of additional costs, and a new USP to replace the promise of access to EU markets. And it will likely look to ways of cutting costs and/or increasing state support.
Regarding costs, there are two areas where public policies have direct cost implications: regulations and business taxes and, as we have already seen, the UK government has attempted to cut both in order to compete for capital in the past. The imposition of EU regulations has been much derided by British politicians, businesses and the media over many years and was one of the arguments posed by those favouring Brexit. Outside the EU, so the argument goes, the UK will be able to reduce regulations, especially on businesses, and thus increase its competitiveness. In reality, any goods traded into the EU will still have to comply with regulations regarding quality and standards. Thus, the area that the UK government will have most scope to adjust regulations is in the sphere of labour and social policy regulations, especially governing working hours, holidays, equal pay, maternity and paternity leave, trade union rights, workplace consultations over redundancies and employers’ national insurance contributions. It is also likely to face pressure to reduce the value of the ‘living’ or minimum wage.
Beyond public policy, employers will be likely to try to exert downward pressure on wages and other terms and conditions of work. The literature spells out in theoretical terms why this should be (see, for example, Offe and Ronge, Reference Offe, Ronge and Offe1984). Ultimately workers have to operate in ways that protect a company's profits. And real-life examples are everywhere; at the time of writing, for instance, workers at Tata Steel have agreed to cuts to pensions worth around 10 per cent in order to secure jobs.Footnote 2
On the question of business taxes, it is telling that one of the first things that George Osborne, the then Chancellor, did in the wake of the referendum was to signal his desire to dramatically reduce corporation tax in order to assist businesses. Philip Hammond, who subsequently took over from George Osborne, announced in the 2017 budget that corporation tax would be reduced to 17 per cent by 2020. At 20 per cent, the UK's corporation tax rate was already amongst the lowest of its major competitors. The new rate will make it the lowest of the G20 economies and third lowest in the OECD, just behind Latvia and Ireland (OECD, 2016b).
This move will shift the tax burden more squarely onto citizens and, potentially, smaller businesses that do not pay corporation tax but do pay other forms of taxation (small businesses tend to make smaller profits and thus tend to pay less in corporation tax than they do in business rates and national insurance contributions (Farnsworth and Fooks, Reference Farnsworth and Fooks2015)).
Businesses can, and are, lobbying for reductions in other areas. The British Bankers Association (BBA), for instance, has urged the UK government to cut the banking surcharges, imposed in the wake of the 2008 financial crash to both serve as a brake on financial speculation and recoup some of the costs associated with the crisis. The head of the BBA said in an interview with the Financial Times:
We understand the government's need to close the fiscal black hole, but if you want to become more attractive as a global financial centre then having a range of bank-specific taxes is not a good way to go about it. (Arnold, Reference Arnold2017)
The cost of such a move would be some £23bn between 2017 and 2020 (ibid.).
Compensating capital through corporate welfare
In addition to reducing costs, the UK government is also likely to face pressure to increase more direct forms of state support to individual businesses, through corporate welfare measures. The most important forms of corporate welfare are direct grants and subsidies to support investment, staff training, research and development activities and wage costs (Farnsworth, Reference Farnsworth2012). The EU has relatively tough rules governing such awards (O'Brien, Reference O'Brien1997): generally speaking, provision is outlawed that distorts competition between members states and/or if it gives a competitive advantage to specific firms. Thus, EU state-aid rules tend to push governments towards more measures that provide general assistance to businesses (such as active social-investment measures, e.g. training subsidies, wage subsidies, support for new businesses and support for industry within deprived areas), or which support public goods (such as public transport or public utilities) or specific industries (such as agriculture). In the absence of EU State-Aid rules, the UK government will face even greater pressure to put together corporate-welfare programmes that help to boost UK industries. To this end, Colin Lawther, Senior Vice President for Manufacturing at Nissan, explained in evidence given to the International Trade Committee that what the company was able to extract from the Prime Minister was a promise of a grant to support its planned investment (the amount was not disclosed to the Committee because of ‘commercial sensitivity’) (House of Commons, 2017). He went on to state that what the company needed was ‘a whole bundle of solutions’ that might include ‘free import duty’, and around £100m to support new investment into the UK from companies that form part of Nissan's supply chain, and he warned that: ‘Nissan [UK] will not succeed in future unless the government does something to help our supply chain’ (ibid.).
This example of Nissan is just the tip of the iceberg. The list of companies signalling their intention to shift some or all their operations to the EU-27 countries or elsewhere is growing rapidly. One of the latest to announce its intention to move to Frankfurt is Lloyds Banking Group. This follows on the back of similar announcements by Lloyds of London, Goldman Sachs, HSBC and UBS (Cox, Reference Cox2017b). Even BAE Systems appears to be signalling that it may shift investment outside the UK if the Brexit negotiations do not achieve free and easy access to the EU. What is especially interesting about Lloyds of London and BAE Systems is that they are two of the most heavily-funded of all companies on corporate welfare.Footnote 3 The CEO of HSBC warned that Brexit could trigger a ‘Jenga tower’ of job moves out of the UK which the head of the London Stock Exchange estimated could top 230,000 jobs (Martin, Reference Martin2017). Of course, such warnings form part of the political power struggle but, in this particular case, the flow of financial capital from London suggests that this is not only a genuine warning, but it is also likely to prove difficult to stem. As already noted, the EU will effectively force some companies to relocate part or all their operations to the EU-27 if they want to continue to access EU markets in the event of a ‘hard’ Brexit which takes the UK out of the single market and the customs union (which the UK government has already signalled its intention to do). And many companies will be eyeing the EU as a more favourable, predictable, stable environment in which to invest. To retain investment from such companies will prove to be incredibly difficult.
Conclusions
Brexit is conjuring up a perfect storm. Against a backdrop of: 1) one of the worst economic crises in history; 2) a period of severe public-spending constraint; 3) an investment strategy that has successfully sold the UK on the basis of low-cost access to the EU; the UK is in a uniquely vulnerable position. It has to find ways of compensating existing businesses and inducing new investment. Given the giveaways in the past, it already has relatively low corporation taxes, low regulations and low wage costs. Any further moves to divert public provision towards private corporations and away from citizens will severely undermine social policy.
There are possible ways forward. The UK could change its brand. It could seek out new ways to induce investment by investing more heavily in education and training and other areas of public and social policy that aids both citizens and businesses. It could promote longer-term investment and seek to boost productivity and engage employees in more strategic decision-making in order to smooth industrial conflict. In other words, it could emulate best practice from social democratic capitalism across the EU and turn its back on more liberal models. But this will take time, additional borrowing and a much more ‘coordinated’ state engagement in the economy. It will also mean tearing up the previous contract with capital and replacing it with a different settlement.
Present signs are not positive. If anything, the UK appears to be hardening its existing investment model. The UK government has threatened to compete even more aggressively on the basis of cost if the EU negotiations don't go its way. Meanwhile, having been empowered by Brexit, many businesses are pressing and will continue to press for more advantageous deals. And still other businesses are being enticed by new inducements offered by other governments. For larger businesses that are mobile, the EU is turning into a buyers’ market.
To go in a different direction, the UK government would have to be prepared to fill any gaps left by companies leaving the UK. It would have to be prepared to invest more heavily in order to restructure the economy away from the most mobile forms of capital (finance capital in particular) and once again emphasise industrial production. And, if there is one benefit to the UK leaving the EU it is that it may have more ability to do this because it won't be subject to relatively strict state-aid rules (although under WTO rules it won't be free to simply subsidise at will).
Such least-worse scenarios for the UK depend on the government driving in a different direction economically, politically and ideologically. But there is little cause for optimism at present. It is far more likely that corporate welfare will increase but social welfare will be squeezed. Cuts in corporation tax will likely be made up by higher taxes on citizens. Reductions in EU regulations will likely undermine health and safety at work, environmental protections and other protections regarding food and other types of consumption (see Fooks, this issue). And social expenditure, especially that which brings least benefit to businesses, is likely to continue to come under pressure. Some businesses will make significant gains as a result of Brexit. Some may suffer. In the present climate it is difficult to see any wins at all in terms of social policy and middle and low-income citizens. I hope that the negotiations over the next two years will prove me wrong!


