


1. IntroductionFootnote 1
Governments in the United States have played a powerful role in generating racial segregation (Rothstein, Reference Rothstein2017). However, since 1917, they have been prohibited from engaging in racial zoning; since 1949 they have been unable to enforce racially restrictive covenants in housing deeds; and since 1968 they have been barred from refusing to insure mortgages in neighborhoods of color. That is, governments can no longer directly generate racial segregation. Yet, even today, scholars have identified a link between government policy and segregation (Trounstine, Reference Trounstine2020). Specifically, scholars have shown that restrictive zoning (e.g., reserving some parts of a community for single-family development and others for denser, multifamily development) is correlated with racial segregation, but we lack a full understanding of why this occurs. I argue that the link between restrictive zoning and racial segregation operates through the clustering of housing costs generated by land use regulations, but only under certain conditions. I use an agent-based model to explore and define these conditions. I demonstrate that land use regulations generate racial segregation in the absence of directly discriminatory housing policies. However, I also show that land use regulations depend upon preferences for neighbors of the same race or wealth (homophily) and race-based income inequality to produce these patterns. Thus, it is America’s potent combination of racism and structural inequality that allows land use regulations to operate as a mechanism of discrimination.
I then compare the outcomes generated by the agent-based model to real-world conditions. Using a new dataset of parcel-level zoning codes, I show that at very low levels of geography (e.g., census block groups), land use regulations are associated with race and class composition. First, I demonstrate that neighborhoods zoned for single-family use and lower density have higher home values. That is, restrictive zoning does lead to the clustering of housing prices. Then I show, as the agent-based model predicts, that these more restrictively zoned neighborhoods are less diverse, wealthier, and have more homeowners than neighborhoods that are zoned more densely. While many scholars have provided evidence of the correlation between restrictive zoning and city level demographics, this work is the first to provide evidence of a correlation within cities.Footnote 2 Finally, I measure the degree to which zoning regulations are geographically clustered. I show that neighborhoods reserved for single-family homes are spatially separated within cities and between them. Collectively, these results indicate that land use regulations contribute to the maintenance of racial segregation across neighborhoods.
2. Drivers of racial segregation
Residential segregation is thought to arise and persist from three sources: the unequal distribution of wealth across racial lines, discriminatory behavior on the part of White actors in the housing market, and land use regulations. However, we still do not know whether any of these factors (wealth inequality, racial tolerance, zoning) are necessary, sufficient, or necessary and sufficient conditions to produce racial segregation patterns.
One school of thought in the segregation literature emphasizes economic differences between racial groups as a driver of segregation (Alba and Logan, Reference Alba and Logan1991; Bayer et al., Reference Bayer, McMillan and Rueben2004; Iceland and Wilkes, Reference Iceland and Wilkes2006). That is, if Black residents’ wealth and incomes are, on average, lower than White residents’ wealth and incomes, then segregation could occur because Black families may not be able to afford the same housing as White families. Another school of thought emphasizes racial preferences, particularly among White residents (Charles, Reference Charles2003). Scholars have shown that Whites are generally unwilling to live in neighborhoods with large Black populations (Madden and Ruther, Reference Madden and Ruther2018) and will pay a housing price premium to live in a segregated (White) community (King and Mieszkowski, Reference King and Mieszkowski1973; Cutler et al., Reference Cutler, Glaeser and Vigdor1999). Finally, scholars have shown that land use regulations are correlated with segregation patterns; however, the links remain underexplored (and contested).
To begin with, scholars debate whether zoning is causally related to economic activity or demographics. Scholars have shown that land use regulations that disallow multifamily/high-density development in favor of detached single-family homes (e.g., restrictive zoning) are correlated with demographics. For example, Pendall (Reference Pendall2000) finds that low-density zoning is associated with smaller Black and Latino populations in cities and Whittemore (Reference Whittemore2018) finds that areas zoned for lower density are Whiter. Glaeser and Ward (Reference Glaeser and Ward2009) provide evidence from the Boston area that land use restrictions change the density and demographic composition of communities and Rothwell (Reference Rothwell2011) finds that anti-density regulations are associated with changes in metropolitan segregation levels over time. However, some scholars, (see, e.g., Seigan, Reference Seigan1972; Wallace, Reference Wallace1988; Berry, Reference Berry2001) conclude that these same patterns would be produced without the legal apparatus of land use regulations. Zoning is viewed by these scholars as simply reifying market behaviors. Yet, others have provided evidence that zoning is causally related to density (Shertzer et al., Reference Shertzer, Twinam and Walsh2016a, Reference Shertzer, Twinam and Walsh2018), home values (Glaeser and Gyourko, Reference Glaeser and Gyourko2003; Kok et al., Reference Kok, Monkkonen and Quikley2014; Song, Reference Song2025), and the racial composition of cities (Trounstine, Reference Trounstine2020).
Another reason why we lack a full understanding of the link between zoning and segregation is that prior work has not attended to the mechanism by which regulations could produce racial segregation. The regulation of development need not, in and of itself, produce segregation. For instance, there is no evidence that the adoption of indoor plumbing codes is related to segregation. To produce segregation, regulations must be geographically clustered and differentiated. The large field of spatial economics, which is focused geographic clustering, has generally not explored the segregating effects of land use regulations along race or class lines (exceptions are discussed below). Instead, scholars have sought to determine (for instance) the conditions under which we can expect firms and workers to sort and cluster, and what the consequences of clustering are for wages, housing costs, and amenities (e.g., Rosen, Reference Rosen, Mieszkowski and Straszheim1979; Roback, Reference Roback1982). Land use regulations play an important role in this literature through their effect on amenities (e.g., limiting the negative externalities of development), housing supply, densification, and property values. Some work has analyzed the particularly restrictive effect of land use regulations on housing available to poor residents, but racial segregation has not frequently been an outcome to be explained (see Baum-Snow and Duranton, Reference Baum-Snow and Duranton2025 for an overview). A related literature, initiated by Tiebout (Reference Tiebout1954), views population sorting across cities as a mechanism for producing local public goods (as cities compete with each other for population), but only (as Hamilton, Reference Hamilton1975 reveals) when zoning generates economic homogeneity in the population. Yet, neither Tiebout nor Hamilton incorporates racial preferences or attempts to explain racial segregation patterns. Even recent work endogenizing restrictive land use choices (e.g., Durantan and Puga, Reference Durantan and Puga2023; Parkhomenko, Reference Parkhomenko2023) does not consider racial drivers or consequences.
Scholars that have linked economic zoning and racial segregation have been imprecise about the mechanism by which the linkage occurs asserting things like “given the correlation between race and income, economic segregation has implied racial segregation,” (Berry, Reference Berry2001) or “the finding that stricter zoning increases socioeconomic and by extension ethnic segregation could now be considered ‘well-established,’” (Sorens, Reference Sorens2024) or “suburbs use zoning laws … [that] increase the price of entry into the community by requiring that residents buy a certain amount of housing services, a policy that may intentionally or unintentionally price Black households out of the area,” (Boustan, Reference Boustan, Brooks, Donaghy and Knaap2012, 333). The assumption these authors make is that the correlation between race and class will produce racial segregation when economic zoning is in place. But we do not know whether this is right; it is a supposition to be tested.
We do know that the impetus to implement zoning had racist intent. Cities adopted land use regulations and formal zoning requirements when voluntary solutions were incapable of preventing the threat of racial transition (Silver, Reference Silver, Thomas and Ritzdorf1997; Troesken and Walsh, Reference Troesken and Walsh2019; Trounstine, Reference Trounstine2018; Sahn, Reference Sahn2025). And when they implemented these regulations, cities chose to place undesirable land uses and density in neighborhoods with more immigrants and people of color (Shertzer et al., Reference Shertzer, Twinam and Walsh2016a, Reference Shertzer, Twinam and Walsh2021, Reference Shertzer, Walsh and Logan2016b; Twinam, Reference Twinam and Levine-Schnur2018). Yet, Trounstine (Reference Trounstine2018) reports that race and class segregation are imperfectly correlated in the United States (r ≈ .65). So, understanding the conditions under which economic zoning, racial preferences, and/or racial wealth inequality produce racial segregation remains an open question.
Part of the reason for continued debate is that it is impossible to isolate each proposed causal factor in the real world. We cannot, for instance, observe whether segregation patterns are different when White and Black Americans have equal levels of wealth and income because they do not and have never had equal wealth and income. Similarly, today, all cities engage in land use regulation, making it difficult to develop a clean counterfactual. Furthermore, it is difficult to measure each factor with a high degree of precision. This is especially true with regard to racist beliefs/tolerance among Whites. Finally, because segregation is an aggregate measure, it captures variation across units within a whole but requires individual behavior to arise. Studying both individual choices and aggregate outcomes at the same time is challenging in the real world. Using a model (e.g., an abstraction that represents real-world phenomena) is one solution to these problems, allowing us to explore the necessary conditions under which patterns of collective behavior emerge without overly complex rules or assumptions and allowing us to alter parameters one at a time (Miller and Page, Reference Miller and Page2007; Wilensky and Rand, Reference Wilensky and Rand2015; Smaldino, Reference Smaldino2023).
For this setting, an agent-based approach (a computational simulation of behavior), which does not pre-impose a solution, and instead allows individuals to interact under different sets of starting assumptions, offers an understanding of the process by which segregation arises (or fails to arise). Additionally, an agent-based model allows individuals (and parcels) to be heterogenous and numerous, important features of the real world that presumably affect the connection between economic zoning and racial segregation. As Miller and Page (Reference Miller and Page2007) explain, agent-based models are a useful tool when homogeneity and equilibrium states do not reflect the system under exploration. So, in the next section, I use an agent-based model to determine the conditions that link restrictive zoning to racial segregation.
3. Modeling segregation
To understand the ways in which restrictive zoning contributes to racial segregation, I draw on an agent-based model built in NetLogo (Wilensky, Reference Wilensky1999). The model that I build compares segregation patterns under different sets of assumptions. Given the existing explanations for segregation, I include three primary factors (racial tolerance, wealth inequality, and land use regulations) in the model and examine the contribution each makes to aggregate segregation patterns. First, I analyze segregation patterns if residents only consider the race of their neighbors in their decision to stay in a particular house. Then, I ask how a restriction that residents can only move to houses that they can afford affects segregation. Next, I investigate how redlining (preventing minority residents from living in certain neighborhoods) affects segregation. Finally, I implement restrictive zoning where regulations generate clustered housing costs.
At the outset, the model sets up a city with 9 neighborhoods, each containing 289 parcels. The model is populated with two types of residents—colored green (majority) and blue (minority). For the purposes of this paper, population density is set at 95% and the minority share is set to 30%. Each resident is assigned an income. Majority income is given by a gamma distribution with a mean of $76,543. Minority income is given by a gamma distribution with a mean of $47,942. These means represent average household income from the 2006-2010 ACS for White and Black Americans. Residents that have incomes below the citywide mean, are triangle shaped (poor) and those with incomes above the mean are circle shaped (rich).
Each parcel is given a value, and residents begin by locating on a parcel that they can afford (affordability is determined as 6 times the residents’ income).Footnote 3 Land value is normally distributed with mean values that vary depending on the model. When zoning is enabled, mean land values are clustered by neighborhood and represent a high degree of inequality. Two neighborhoods have a mean value of $444,100, two have a mean value of $316,600, two have a mean value of $117,600, one has a mean value of $123,400, one has a mean value of $121,000, and one has a mean value of $141,800. These land values were drawn from zip code level median home values for owner occupied houses in a major metropolitan area in the United States as of 2011.Footnote 4
When zoning is enabled, all neighborhood standard deviations are set to $50,000 to maintain the clustering of values. When zoning is not enabled, land values are normally distributed across all parcels with a mean equal to $241,795 and a standard deviation of $146,617.Footnote 5 In the aggregate, parcels have similar value across the two versions of the model—but they are clustered when zoning is enabled and randomly distributed when it is not. Parcels are shaded from Black to White reflecting value.
When the model runs, each resident determines whether she is happy or not, based on the percentage of neighboring residents that are the same color as herself. To begin, I set the majority resident preference at 70% majority neighbors, and the minority resident preference at 30% minority neighbors (the same as the citywide population distribution).Footnote 6 In addition, rich residents consider the wealth of their neighbors. Rich residents prefer at least 25% of their neighbors to be rich. If any residents are unhappy with the race or wealth of their neighbors, they move to a new location.Footnote 7 Residents move by randomly selecting an unoccupied, affordable parcel.Footnote 8 The model allows unhappy residents to move 20 times and then stops.Footnote 9
As the model runs, land value is updated to reflect the composition of neighbors as a proxy for demand to live in neighborhoods with high quality schools and services (Baum-Snow and Duranton, Reference Baum-Snow and Duranton2025). Land value increases by $2,500 if the neighbors are at least 60% rich and decreases by $2,500 if neighbors are at least 60% poor.Footnote 10 However, when zoning is enabled, in the higher priced neighborhoods (the four corners), land value never declines.
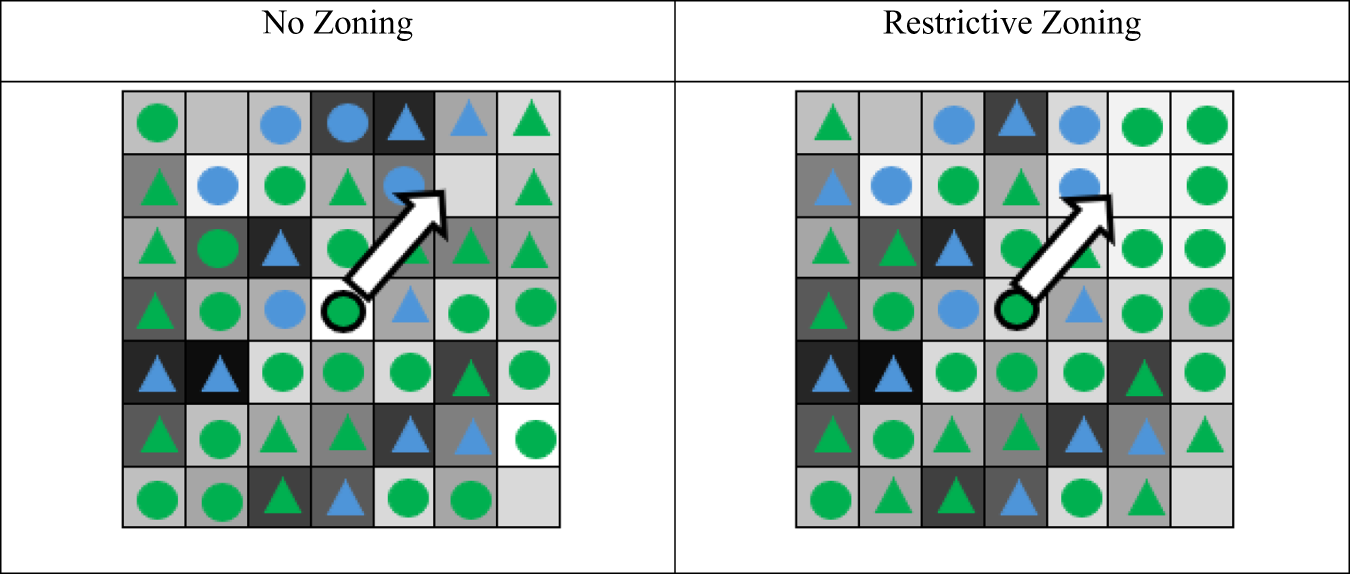
To analyze each model, I run 100 simulations and record the total segregation at the end of the run. Figure 1 shows a screenshot of the model when it is initiated (before any moves occur). The figure shows which components of the model are variable. For instance, density, demographic composition, and homophilic preferences are all represented by sliders that can be changed. Zoning, red-lining, and land values are switches that can be turned on or off. The model is available for download in the replication files associated with this paper so that interested readers can alter these settings. Figure 2 shows the decision process for a single resident in the models without and with zoning.
Model setup.

Zoomed-in example of resident choice.

In the model without zoning, the green circle in the center of the square represents a majority-raced resident with an income above the mean. At her starting location, she is surrounded by five majority-raced residents and five rich residents. Given the preferences I have set in the model, this majority-raced, rich resident is happy with the wealth of her neighbors and unhappy with the race of her neighbors. So, she moves to an empty space she can afford (denoted by the arrow). When she lands on this new space, she is surrounded by five majority-raced neighbors and only one rich neighbor (making her unhappy on both dimensions). So, in the next round, she will move again. If we compare this to the picture on the right, where the upper right-hand corner is restrictively zoned, we can see that her calculation is different. In the Restrictive Zoning model, high land values in the corner have prevented any poor residents from locating there. Additionally, the higher priced housing interacts with the race-based wealth inequality so that more green residents are located in the restrictively zoned neighborhood. In this model, the green, rich resident’s starting location is the same, but after she moves to the empty space her preferences for majority-raced and rich neighbors have been satisfied, and she will stay put. Next, I determine the conditions under which such decisions produce segregation in the aggregate.
4. Model results
I begin with a replication of Schelling’s famous result in which homophilic preferences alone generate segregation. In this model, residents only consider the race of their neighbors, parcels have no value, and there are no constraints on the price of housing. All residents can afford all parcels, and they move about the space seeking to satisfy their preference for similar race neighbors. I find, as Schelling did, that preferences for same-race neighbors generate segregation. Over 100 simulations of the model, the average dissimilarity index is 0.194 (SE 0.006) and blue and green residents are clearly spatially separated. Figure 3A shows a screenshot with a dissimilarity index that is close to this average. It appears that homophilic preferences can generate segregation. However, in this model, every resident can afford every house and so, the model does not allow for an exploration of the competing view that wealth inequality drives segregation.
Simulation screen-shots under different assmptions.

In Figure 3B, I explore the effect of land values and wealth inequality on racial segregation. Here, residents start by locating on parcels that are affordable and their ability to move to any parcel is limited by the same rule. This model also adds the complexity that rich residents seek 25% rich neighbors and land values update endogenously based on the wealth of the residents. In this version of the model, I set residents’ preferences for same-race neighbors to zero. That is, both majority and minority residents are indifferent to the race of their neighbors. Replacing racial preferences with land values and income restrictions radically changes the outcome. In this version of the model, over 100 simulations, the average dissimilarity index is much lower 0.055 (SE 0.002) and there is no spatial pattern or clustering of green and blue residents.
Recall that housing prices are normally distributed when the model is initiated. More expensive homes are randomly distributed throughout the community, and any parcel can become more valuable. The result is that variation in the affordability of housing alone does not produce racial segregation even though the (1) residents have race-based wealth inequality, (2) land values reflect the wealth of neighbors, and (3) wealthy residents are seeking to get closer to each other. Despite these settings, housing costs do not become clustered, and so even though majority residents have higher incomes, they are also not geographically clustered. As long as lower priced housing is located near higher priced housing, then higher income residents are unable to maintain segregated neighborhoods. Wealth inequality alone is insufficient to produce high levels of racial segregation.Footnote 11
Next, I ask what happens if we add racial preferences to the housing cost model. The result is shown in Figure 3C. Here the segregation patterns surpass the pure racial preference model, averaging 0.248 (SE 0.006). It appears that variation in the cost of housing exacerbates the tendency for residents to sort into communities with same-race neighbors. Racial preferences interact with wealth inequality in driving segregation.
In Figure 3D, I explore how explicitly racist housing market practices like redlining and racially restrictive covenants affects segregation patterns. To represent these behaviors, minority (blue) residents are prevented from starting on parcels in the four corner neighborhoods.Footnote 12 I set racial preferences to be the same as in Figure 3C (majority residents prefer at least 70% majority neighbors and minority residents prefer at least 30% minority neighbors). Housing costs are randomly distributed, and income inequality is race based, as in Figure 3C. In the redlining model shown in Figure 3D, the dissimilarity index shoots up to an average of 0.739 (SE 0.004). Preventing minority residents from selecting parcels in certain neighborhoods is a very effective generator of segregation. However, while banks and realtors still engage in racially discriminatory practices today, they are, at least technically, illegal. I ask whether restrictive zoning can be used to serve the same goal. So, in my final analysis, I replace redlining with restrictive zoning along economic lines, which has been upheld by the court, and is widely utilized in U.S. cities.
Land use regulations can limit housing available to residents at the lower end of the income distribution in numerous ways (Schleicher, Reference Schleicher2013; Been, Reference Been2018; Gyorko and Malloy, Reference Gyorko, Malloy, Duranton, Henderson and Strange2015; Ihlanfeldt, Reference Ihlanfeldt2007). Using regulations like set-back requirements, height limits, floor-area ratios, minimum lot sizes, development caps, historic overlays, impact fees, and prohibitions on attached housing, cities can drive up the cost of housing (Mangin, Reference Mangin2014). They can prevent housing from being rented and they can even specify what constitutes a family (and so who is allowed to live in “single-family” housing). An important feature of city land use policy is that these designations are applied to clusters of parcels thereby creating neighborhoods that are more or less likely to accommodate lower income residents. Perhaps obviously, these policies are facially race neutral. To explore how these strategies affect racial segregation, I change two key aspects of the model. First, as explained above, I initiate the model with highly clustered and unequal land values. Second, I designate the four corners of the model as having restrictive zoning. In these neighborhoods, housing values start much higher, and as the model runs land values are prevented from declining endogenously—values only ever increase depending on the demographics of residents. As before, I run 100 simulations and measure the dissimilarity index after each run. Figure 3E presents a screenshot of this restrictive zoning model.
Figure 3E shows that restrictive zoning increases the racial segregation compared to Figure 3C. Across 100 simulations, the average dissimilarity index for the restrictive zoning model is 0.297 (SE 0.006). While this is much lower than the segregation index produced in the redlining model, it reveals that in an environment where overtly racist practices are unavailable, restrictive zoning contributes to segregation.
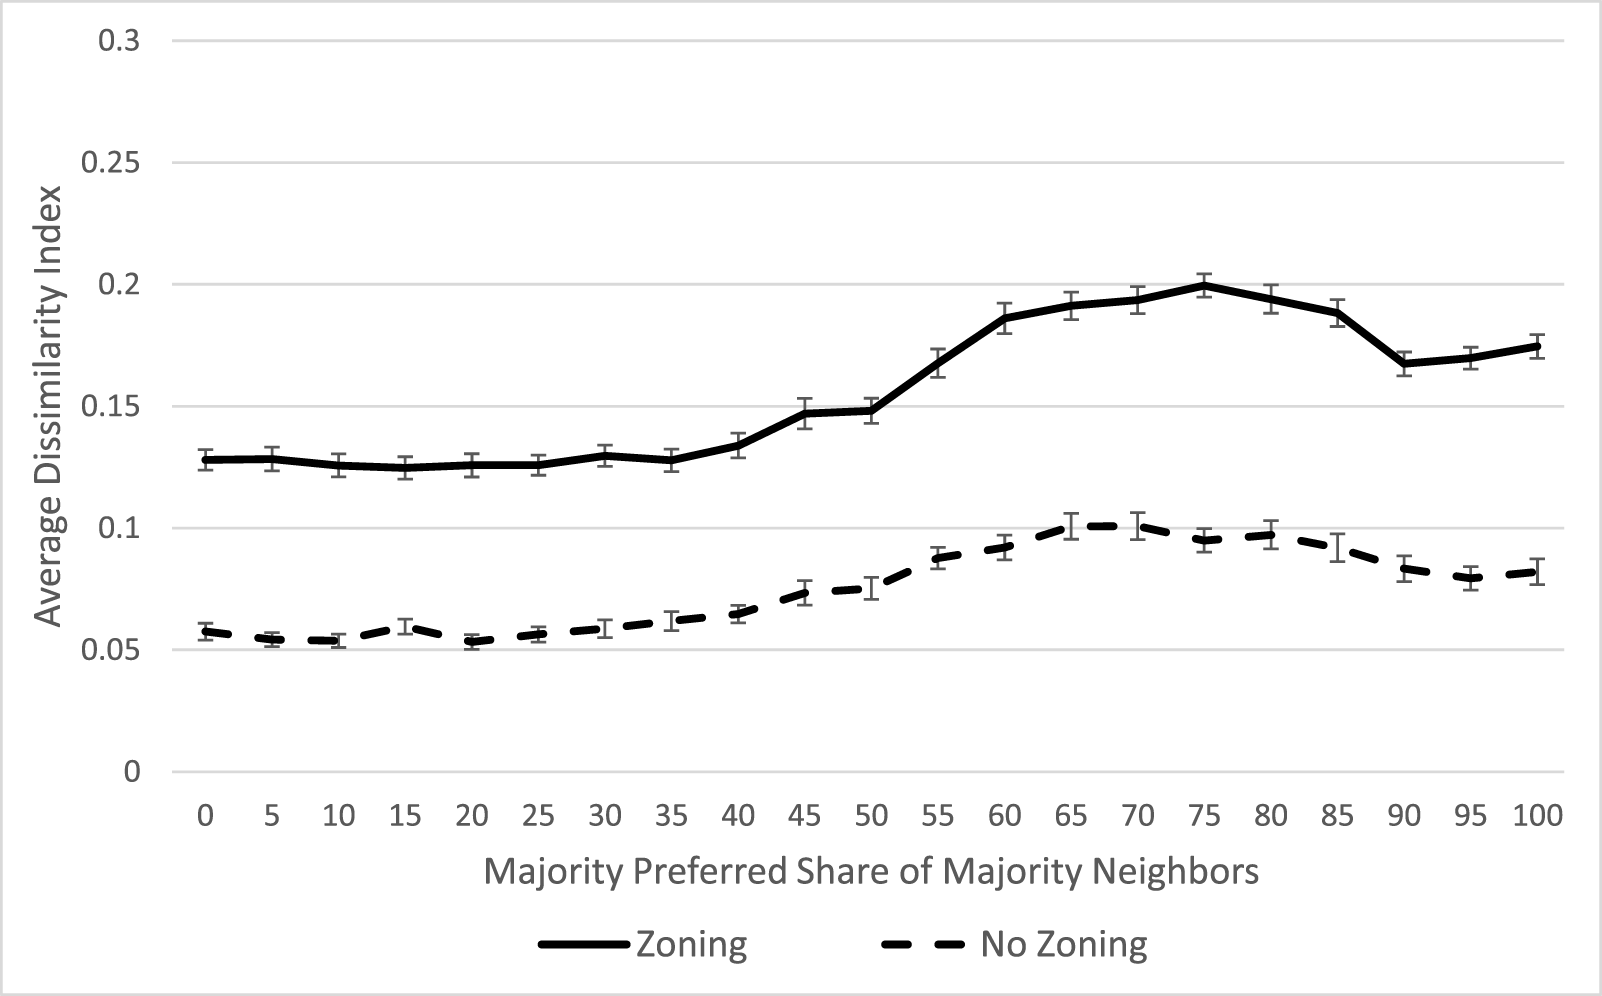
The pattern shown in Figures 3E is not sensitive to the threshold of preference for same-race neighbors. To demonstrate this, I reran the simulations varying the preference of majority residents from 0% to 100% in increments of 0.05. For these simulations, I set the preference among minority residents for minority neighbors to zero (e.g., they are indifferent to the race of their neighbors), and the preference among rich residents for rich neighbors at 25%. I ran these simulations with and without restrictive zoning. The results are shown in Figure 4. The x-axis of the figure represents share of majority neighbors preferred by majority residents and the y-axis represents the average dissimilarity index across 100 simulations. The graph reveals that at each threshold of preferences for majority neighbors, segregation is higher when restrictive zoning is in place. Depending on the level of the majority’s racial tolerance in a community, restrictive zoning increases segregation by 90–137%.
Comparing dissimilarity indices with and without restrictive zoning at varying levels of racial tolerance.

Although the effect of zoning is most pronounced when the majority’s preference for same-race neighbors is high, even with no preference for same-race neighbors, zoning generates higher levels of segregation compared to the model with no zoning.Footnote 13 Zoning has an even larger effect on racial segregation when racial preferences are set to zero and the preference for rich neighbors varies. In these models, zoning increases segregation by 117–354%. For example, when rich residents desire at least 75% rich neighbors, the dissimilarity index is about 0.06 without zoning and rises to about 0.23 with zoning.
Individually varying many other components of the model does not minimize the impact of restrictive zoning. For instance, in Figure 4, while the majority’s preference for same-race neighbors changes across the models, minority resident preferences are held constant. But the segregating effect of zoning appears even if minority preferences also change. Similarly, if I change the size of the minority population, restrictive zoning still increases segregation. Inequality in minority and majority wealth distributions is what allows zoning to generate racial segregation irrespective of tolerance or population size. So, next I explore what happens when residents have equal income distributions.
When minority residents are given the same income distribution as majority residents, restrictive zoning has a very marginal effect on segregation, and only once the majority’s preference for same-race neighbors is greater than 50% does zoning have any effect at all. Thus, restrictive zoning appears to increase segregation only in the presence of preferences for similar raced or wealth neighbors and race-based income inequality.
One final important result is that the model without zoning shown in Figure 3C produces higher levels of segregation if it is allowed to run longer than 20 moves. To better understand how segregation changes as the model runs for more time, I increased the move total by increments of 10, until 500 moves were reached. I ran 100 simulations at each move total and took the average dissimilarity across all 100 simulations. Segregation rises from 1 to 60 moves and then, levels off (with some bouncing around). With a single move the average dissimilarity index is 0.186 (SE 0.004); at 60 moves it is 0.274 (SE 0.007)—much closer to the average shown in the zoning model above (Figure 3E). However, allowing the zoning model to run longer ALSO generates higher segregation. At 60 moves, the zoning model average dissimilarity index is 0.314 (SE.006). What this suggests is that zoning allows for the generation of segregation more quickly and exacerbates the patterns over the long run.
Scholars have continued to debate the degree to which zoning represents legal formalities rather than binding or causal constraints. This model offers support for the latter view. Without zoning, segregation is lower despite variation in land values and wealth. Only once land values are clustered and restricted from declining do we see higher levels of segregation arise and persist. Miller and Page (Reference Miller and Page2007) suggest that the results of agent-based models can be usefully tested by comparing the outcome of the model to the real word. So, in the next section, I explore whether real-world patterns reflect the findings of the model.
5. Land use regulation association with neighborhood demographics
Studying the ways in which zoning and segregation are linked is challenging because land use information at low levels of geography (i.e., the neighborhood) are difficult to obtain and compare. Cities have wildly different standards and methodologies for regulating land. For instance, two cities might both have a zoning designation “R1” for some neighborhoods. In both cities, neighborhoods that are zoned R1 permit the building of residential, single-family homes without requiring discretionary approval. But in one city, R1 parcels must be at least ½ an acre and in the other, R1 parcels can be as small as 1/8th of an acre. This regulation is called dwelling units per acre (DUA) and determines the allowable density for any area. In the first instance (where parcels need to be ½ acre), the R1 DUA is 2 and in the second instance, the R1 DUA is 8. A researcher interested in the consequences of land use regulations in these two cities would not want to make these designations equivalent, despite having the same R1 designation. Thus, to understand the degree to which cities segregate land use regulations, we need detailed regulatory information at the parcel or plot level that can be standardized across places.
Through a National Science Foundation-funded partnership through STIR labs with the Association of Bay Area Governments (ABAG), I received geocoded parcel-level zoning information for all 110 Bay Area communities as of 2021 (approximately 2.2 million parcels). These data include an indicator noting whether each residential parcel is zoned for Multifamily or single-family use as of 2021 and the Maximum Dwelling Units per Acre allowed for each parcel.
I aggregate parcel information to census block groups to measure the share of parcels in each neighborhood zoned for multifamily use and the average maximum DUA across all parcels.
I use these two residential land use variables, Percent Multifamily and Average Max Dwelling Units per Acre (rescaled to run from zero to one), to measure the permissiveness of land use in a particular neighborhood. The agent-based model represented restrictive zoning through clustered, unequal housing prices. So, my first step is to demonstrate that this representation is reasonable by exploring the relationship between land use regulations and Median Home Values. Median home value is measured at the census block group level and was drawn from the 2015-2019 American Community Survey which I spatially merged to the zoning data. I regress this measure on my two variables measuring land use permissiveness. I include fixed effects for cities and present robust standard errors.Footnote 14 I expect more permissive land use regulations to be associated with lower median home values. Summary statistics are shown in Table 1. Table 2 presents the results.
Land use regulation dataset summary statistics

Association between land use regulation and property value

Note: Fixed effects for jurisdiction included, but not presented.
Table 2 shows that, as expected, more permissive zoning is associated with lower home values, offering support for the design of the agent-based model. Neighborhoods that are zoned for more density have less expensive homes. Comparing a block group at the 10th percentile of the distribution on both independent variables (one that has no multifamily zoning and an average max DUA of 2.2) to one in the 90th percentile (zoned all multifamily with an average max DUA of 40) reveals a median home price of $1,002,021 compared to $799,912. Thus, when land use regulations are clustered, housing prices are also clustered. Next, I look to see if these land use regulations are also associated with different demographics that can help elucidate how segregation is produced.
Segregation is a single measure that captures the sum of the differences between the racial composition of each neighborhood and the community as a whole. If restrictive zoning affects this aggregate measure, it should be the case that neighborhoods with different zoning designations also have different demographic compositions. Specifically, I expect that more permissive zoning will be associated with fewer White residents, more people of color, and more residents with lower socioeconomic status. To analyze this, I gathered data from the 2015-2019 American Community Survey at the census block group level and spatially merged these data to the parcel data. For each block group, I measure the share of residents that are Renters, the share with household incomes below the Poverty line, the share that are White, and the racial/ethnic Diversity of the population. This diversity measure is an entropy score calculated as follows:
 \begin{equation*}E = \,\mathop \sum \limits_{r = 1}^R ({\pi _r})\ln \frac{1}{{{\pi _r}}}\end{equation*}
 where  ${\pi _r}$ represents the proportion of residents in the block group that are of racial/ethnic group r. The racial groups included are White, Black, Latino, Asian/Pacific Islander, and other. The entropy score ranges between 0 and 1.61 (the natural log of the total number of racial groups). The higher the entropy score, the more diverse a neighborhood is.Footnote 15 In four separate models, I regress these socioeconomic measures on the measures of land use permissiveness, Percent Multifamily and Average Max Dwelling Units per Acre. To mirror the results of the agent-based model, it is important to capture zoning variation and demographic variation within cities, across neighborhoods. To do this, the regressions include fixed effects for city and include robust standard errors. Summary statistics appear in Table 1, and Table 3 presents the regression results.
Association between land use regulation and neighborhood demographics across neighborhoods within cities

Note: Fixed effects for jurisdictions included, but not presented.
Table 3 reveals that neighborhoods with higher zoned density and more parcels with multifamily designations are associated with more diversity and fewer White residents, more renters, and more residents living below the poverty line. Comparing, a block group at the 10th percentile of the distribution on both independent variables to one in the 90th percentile helps make these differences clear. The restrictively zoned neighborhood is predicted to have about 47% White residents, 25% renters, and 6% of households living below the poverty line, while the densely zoned neighborhood has about 39% White residents, 67% renters, and 12% of households living below the poverty line. In short, land use regulations are HIGHLY correlated with neighborhood demographics within cities. The variation in demographics across neighborhoods provides the building blocks for segregation. Of course, these data cannot provide any evidence of causality. We do not know whether the zoning designations follow the demographic makeup of the community or vice versa. They are best thought of as a real-world demonstration of the expected patterns produced by the agent-based model.
However, as the agent-based model revealed, for restrictive zoning to correlate with racial segregation in the aggregate, it must be the case that regulations are geographically clustered. So, in one final analysis, I explore the extent to which cities vary on this dimension. We can conceptualize zoning segregation at two levels. The first, as represented by the agent-based model, is segregation between neighborhoods within cities. The second level is segregation between cities within a larger county or metro area. It is this second level of segregation that has been the focus of existing literature on this topic. Scholars have shown that suburbs are zoned more restrictively than central cities (Danielson, Reference Danielson1976). The measure that I use captures both types of segregation.
To describe regulatory clustering, I calculate Single-family Zoning Segregation using Thiel’s H Index. Theil’s H is beneficial for this analysis because it is perfectly additive for nested geographies (Reardon and Firebaugh, Reference Reardon and Firebaugh2002; Fischer et al., Reference Fischer, Stockmayer, Stiles and Hout2004; Trounstine, Reference Trounstine2016, Reference Trounstine2018). In my case, neighborhoods are nested within cities, and cities are nested within counties. The H Index is built using the 2021 level parcel-level data described above and captures the degree to which neighborhoods that are reserved for single-family homes are separated from neighborhoods that allow multifamily homes.
I calculate H Indices at the two levels that are of interest—within cities and between cities. Respectively, these measure the extent to which neighborhood zoning diversity differs from city zoning diversity (Hc_n) and the extent to which city zoning diversity differs from county zoning diversity (Hm_c).Footnote 16 The measure of zoning diversity is influenced by the relative number of parcels zoned for each type of housing, while the overall index is influenced by the relative size of each neighborhood or city, giving more weight to larger places.
 \begin{equation*}{H_{c\_n}} = \mathop \sum \limits_{n = 1}^N \frac{{{P_n}}}{{{P_c}}}\left( {\frac{{{E_c} - {E_n}}}{{{E_c}}}} \right)\end{equation*}
 \begin{equation*}{H_{m\_c}} = \mathop \sum \limits_{c = 1}^C \frac{{{P_c}}}{{{P_m}}}\left( {\frac{{{E_m} - {E_c}}}{{{E_m}}}} \right)\end{equation*}
 where P represents total number of parcels of the neighborhood n, city c, or county m, and E represents the zoning diversity of the geography ( $E = \,\mathop \sum \limits_{z = 1}^Z ({\pi _z})\ln \frac{1}{{{\pi _z}}}$). Here ${\pi _z}$ represents the proportion of parcels that are zoned for single-family versus multifamily use in each geography (neighborhood, city, or county).
I combine the two indices to produce a total H Index for the county calculated at the neighborhood level, Hm_n.
 \begin{equation*}{H_{m\_n}} = \mathop \sum \limits_{n = 1}^N \frac{{{P_n}}}{{{P_m}}}\left( {\frac{{{E_m} - {E_n}}}{{{E_m}}}} \right) = \,{H_{m\_c}} + \mathop \sum \limits_{c = 1}^C \left( {\frac{{{P_c}}}{{{P_m}}}} \right)\left( {\frac{{{E_c}}}{{{E_m}}}} \right){H_{c\_n}}\end{equation*}
The H indices vary between 0, where all neighborhoods have the same composition as the entire city or county, and 1 where all neighborhoods contain only one housing type.
Table 4 presents the H Index for Single-family Zoning Segregation for both levels of segregation, by county
Single-family zoning segregation in Bay Area communities

The table shows that the Bay Area features a very high degree of zoning segregation overall, with evidence of zoning segregation at both levels. Generally, a greater share of total segregation is accounted for within cities rather than between them.Footnote 17 This may be a result of the state of California’s mandate that all cities zone for lower income housing.Footnote 18 The result is that even small suburbs typically have some neighborhoods that permit higher density development, and these are often clustered into a few neighborhoods.
6 Conclusion
Understanding the role that city governments play in maintaining and perpetuating segregation is crucial to our understanding of patterns of inequality. Scholars have shown that land use regulations, particularly restricting the development of multifamily and higher density housing, are associated with the sociodemographic characteristics of their communities. However, the mechanisms that generate this link have been undertheorized. I use an agent-based model to clarify the conditions under which economic zoning and racial segregation are linked. The agent-based model is a simplification of reality that ignores many complexities of the real world such as changes in zoning over time, population growth, housing supply, investment decisions, and variation in the distribution of renters versus homeowners. I leave the investigation of these additions to future work. The goal here was not to realistically model urban development in detail. Rather it was to demonstrate that certain patterns of behavior and land usage can emerge without overly complex assumptions. I find that restrictive zoning increases segregation, but only when residents have preferences for same-raced or same-wealth neighbors and when income inequality is race-based.
Then, using parcel-level zoning information, I show that restrictive land use regulations are associated with higher cost housing and demographics across neighborhoods. Neighborhoods with lower density zoning have fewer residents of color, more renters, and more residents above the poverty line. I also demonstrate that cities segregate housing types in their land use regulations. I develop a measure of zoning segregation across neighborhoods within cities, and across cities within counties, and provide evidence of both types of segregation in the Bay Area. Some neighborhoods are reserved for single-family homes, while others feature denser, less expensive housing. The results of the agent-based model indicate that when cities do this, they are likely to see racial segregation, particularly when race-based wealth inequality is present and or/residents have race-based preferences for neighbors.
Replication link
To obtain replication material for this article, please visit https://doi.org/10.7910/DVN/SHKLWH.


 Open access