


Introduction
Globally, prostate cancer (PC) is the second most common cancer in men (Bray et al., Reference Bray, Ferlay and Soerjomataram2018), and in Sweden the most common cancer overall, with over 10,000 diagnosed in 2019 (National Board of Health and Welfare, 2021). Most men are diagnosed with localized disease (tumor stages T1–T2), meaning the tumor has not metastasized (Litwin and Tan, Reference Litwin and Tan2017). There are several treatments available for men with localized PC: surgical removal of the prostatic gland (prostatectomy), radiotherapy (RT), or active surveillance, which means that the PC is being regularly monitored and other treatments might be considered if the disease progresses further (Barocas et al., Reference Barocas, Alvarez and Resnick2017).
Between 15% and 30% of men treated for localized PC eventually develop metastatic PC (mPC) (Alva and Hussain, Reference Alva and Hussain2013). The disease progression of PC is often slow and the life expectancy at all stages has increased considerably due to new and improved treatments (Siegel et al., Reference Siegel, Miller and Jemal2018). Quality of life (QoL) is very important for men with PC at all stages of the disease (Msaouel et al., Reference Msaouel, Gralla and Jones2017). A study comparing patient-reported outcomes between men with local disease (tumor stages 1–2) and men with tumor stages 3 and 4 found that even though the group with more advanced cancer reported more problems with fatigue and hormonal function (due to hormone treatment), health-related QoL (HRQoL) did not differ substantially between the groups (Downing et al., Reference Downing, Wright and Hounsome2019). However, HRQoL is rapidly deteriorating as the disease reaches the more advanced stages of metastatic disease (Sullivan et al., Reference Sullivan, Mulani and Fishman2007) that come with a more pronounced disease burden (Resnick and Penson, Reference Resnick and Penson2012). Previous research from Australia has also shown that despite their pronounced symptom burden, the access to symptom control and supportive care resources was low among men with mPC (Collins et al., Reference Collins, Sundararajan and Millar2019). PC at this stage is incurable (Sanford et al., Reference Sanford, Greene and Carroll2013) and associated with several common symptoms, such as pain from skeletal metastases, fatigue, and sexual and urinary problems (Rabow and Lee, Reference Rabow and Lee2012). Older age, comorbidities, higher tumor stage and Gleason score, impaired mental health, and lower educational level are some factors that have been shown to predict lower HRQoL among men with PC, whereas higher education level, a less advanced disease stage (T1–T2), and physical condition were predictors that were shown to affect HRQoL positively (Odeo and Degu, Reference Odeo and Degu2020). A study on partly the same sample as the present study shows that as they approach death, men with mPC rate their QoL and symptoms, such as pain and fatigue, significantly worse compared to men earlier in the disease course (Holm et al., Reference Holm, Doveson and Lindqvist2018). The same study showed that men who died with PC in later years (after the year 2006) reported higher levels of symptoms than those who died before 2006 (Holm et al., Reference Holm, Doveson and Lindqvist2018). Despite the growing palliative care research field over the last decades, these results indicate there is still a need for knowledge on late-stage and end-of-life experiences as well as the needs of men with PC.
In a literature-based conceptual framework suggested by Hui et al. (Reference Hui, De La Cruz and Mori2013), the wider concept of supportive care focuses on symptom control and QoL in patients with life-limiting illnesses across the disease trajectory. With the addition of a team-based approach, palliative care falls under the supportive care umbrella and the two concepts have the focus on symptom control and QoL in common. The literature shows that both concepts are expanding to include earlier phases in the disease trajectory; however, supportive care is expanding the furthest to also include both survivorship and bereavement (Hui et al., Reference Hui, De La Cruz and Mori2013). Given the increased symptom burden at the more advanced stages (Rabow and Lee, Reference Rabow and Lee2012), and the long disease trajectory, patients with PC may need both life-prolonging treatments and a supportive care approach with a focus on symptom control and QoL (Sanford et al., Reference Sanford, Greene and Carroll2013). Furthermore, disease-directed treatments may also come with side effects, such as urinary incontinence, erectile dysfunction (Brawley et al., Reference Brawley, Mohan and Nein2018), nausea/vomiting, and diarrhea (Sonnek and van Muilekom, Reference Sonnek and van Muilekom2013), which can lead to reduced QoL and increased symptom burden, which provides further implications for a palliative care approach early in the disease course (Kaya and Feuer, Reference Kaya and Feuer2004). In PC specifically, with the increasing treatment possibilities and life expectancy for men with mCRPC, where they can live with symptoms for long periods, it has been argued that a palliative care approach could be applied by interdisciplinary teams, focusing on symptom management and QoL at all stages of the disease (Rabow and Lee, Reference Rabow and Lee2012). It has also been concluded that despite calls for this kind of integrated care, it occurs too late or not at all for many patients with cancer (Collins et al., Reference Collins, Sundararajan and Burchell2018).
In summary, patients with PC may experience distressing symptoms and treatment side effects at all stages of the disease and may also have unmet supportive needs in the more advanced stages as the symptom burden increases. To identify early symptoms and supportive needs in men with mPC, it is therefore necessary to follow them already from an early stage and throughout their disease course. Hence, the aim of this study was to identify early symptoms and changes in QoL among men with primary localized PC who later develop metastases.
Methods
Design
The present study is a sub-study from a large, prospective study on QoL and symptoms comprising 3.885 men with PC from two regions in Sweden that are followed over the course of 20 years. The men in the present study were included between the years 1991–2008 and followed for up to 5 years.
Ethics approval
This study was performed in line with the principles of the Declaration of Helsinki. Ethical approval for the study was granted by the Research Ethical Review Board in Umeå, Sweden (Dnr 02-054 and Dnr 95-163). Written informed consent was obtained from all participants.
Setting/participants
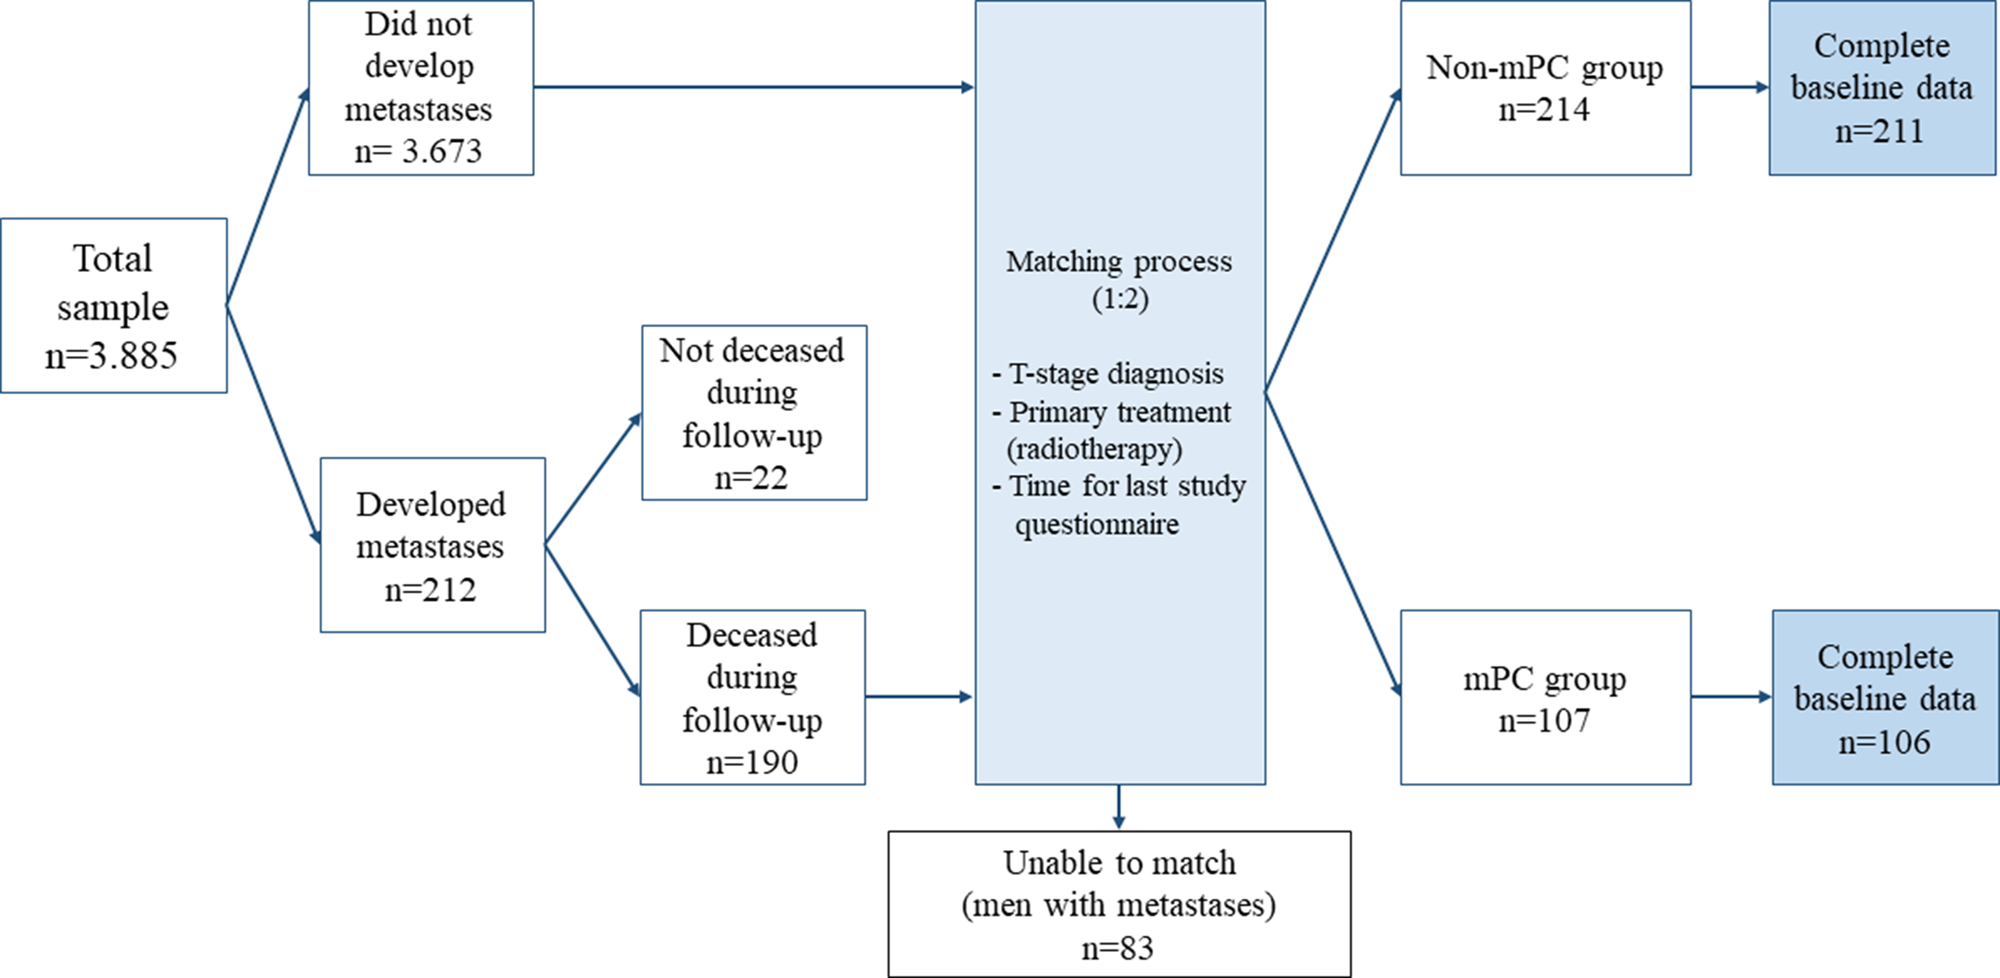
Inclusion criteria for the larger prospective study were men who had been diagnosed with non-mPC and were scheduled to undergo primary RT. In the present study, a subsample of the men who had developed verified metastases sometime during the follow-up was included. Given the study's focus on palliative care needs, a further inclusion criterion was that the men with mPC (mPC group) had died during the follow-up in the larger study. Another inclusion criterion for the mPC group was also that no verified metastases were observed during the first year after inclusion in the study, since the verification of metastases shortly following diagnosis could mean that metastases were present, but undetected, already at diagnosis. 190 men met these criteria and were matched (1:2) with men who had not developed verified metastases during the follow-up time (non-mPC group). The matching was based on: tumor size (T stage) at diagnosis, primary treatment type (RT), and last follow-up time-point in the study (Figure 1). As the focus in this study was men with initially localized PC, only men with tumor stages T1 and T2 were included. Only 107 men in the mPC group were able to match and, hence, were matched with 214 in the non-mPC group.
The matching process.
Measurements
All patients were invited to participate in the larger study by a nurse in the RT departments before their first RT appointment. They were asked to complete a baseline questionnaire and return it to the clinic staff. At baseline, some background characteristics and medical data were also collected: age, marital status, year of diagnosis, blood serum level of prostate-specific antigen (PSA), and tumor stage. In the present study, time-points included were baseline, treatment completion, 3 months, and 1, 2, 3, and 5 years post-treatment. The questionnaires were returned by mail, and a reminder was sent if the patient did not reply within 4 weeks.
To measure the men's QoL, functioning, and symptoms, the Swedish version of the European Organization of Research and Treatment of Cancer Quality of life Questionnaire version 3.0 (EORTC QLQ-C30) (Groenvold et al., Reference Groenvold, Klee and Sprangers1997) and the Prostate Cancer Symptom Scale (PCSS) (Fransson et al., Reference Fransson, Tavelin and Widmark2001) were used. EORTC QLQ-C30 is a 30-item scale composed of single-item and multi-item scales. For this study, QoL/global health, the five functional scales (physical, role, emotional, social, and cognitive), and four symptom scales (fatigue, pain, nausea/vomiting, and dyspnea) were considered relevant for the study aim. All items have four response alternatives (“not at all,” “a little,” “quite a bit,” and “very much”), except for the QoL/global health questions, which have seven response alternatives, ranging from “very poor” to “excellent.” Scores were calculated either by scale or by item and transformed into a 0–100 scale (Aaronson et al., Reference Aaronson, Ahmedzai and Bergman1993), where higher values indicate better QoL and functioning or worse symptom levels. Internal consistency for all selected multi-item scales in this study was calculated and measured by Cronbach's α. The five functional scales ranged from 0.53 to 0.81, with the social, emotional, and role scales scoring of >0.70 and the cognitive and physical scales of <0.6. Cronbach's α for the three symptom scales ranged from 0.289 to 0.813: two out of three scales (pain and fatigue) scored >0.8, while nausea/vomiting scored <0.3. The global health/QoL item displayed a Cronbach's α of 0.827. Clinically important threshold values have been developed for some of the scales (QoL, physical and emotional functioning, pain, and fatigue), where a rating below (QoL and functioning scales) or above (symptoms) the threshold value indicates the need for clinical attention (Snyder et al., Reference Snyder, Blackford and Okuyama2013). In addition, Osoba et al. (Reference Osoba, Rodrigues and Myles1998) has recommended the following interpretation of clinically relevant changes in the EORTC QLQ-C30: a change in a score of 5–10 indicates “little” change, 10–20 indicates “moderate” change, and >20 indicates “very much” change (Osoba et al., Reference Osoba, Rodrigues and Myles1998). The instrument was developed and validated in the context of cancer patients (Aaronson et al., Reference Aaronson, Ahmedzai and Bergman1993) and has also been validated specifically for patients with PC (Arraras Urdaniz et al., Reference Arraras Urdaniz, Villafranca Iturre and Arias de la Vega2008). The PCSS is a 43-item scale that measures men's levels of self-assessed symptom from PC. It was developed and validated in a Swedish context (Fransson et al., Reference Fransson, Tavelin and Widmark2001). The instrument uses a modified linear analog scale ranging between 0 and 10, where 0 = “no problem/very good function” and 10 = “many problems/very bad function.” For the present study, three single-items were chosen to investigate the men's levels of prostate-specific problems (urinary-, bowel-, and sexual problems).
Analysis
Descriptive statistics (Student's t-test and χ 2 test) were used to calculate differences in background characteristics for the two groups at baseline (Table 1). Mean ratings with standard deviations were calculated in both groups for all outcomes at the seven follow-up time-points in the study. Four participants had not completed the study questionnaires at baseline but instead had completed questionnaires from a time-point before the start of RT closely following baseline, and these were used in the baseline analyses for these participants. Because the group sizes were uneven, non-parametric statistics (independent samples Mann–Whitney U tests) were used to investigate the mean differences between the groups over time (Table 2). Repeated measures analysis of variance (RM ANOVA) was used to explore differences in QoL, pain, and fatigue within the mPC- and non-mPC groups over three different time-points (Table 3). These outcomes were chosen based on previous research showing that QoL commonly deteriorates rapidly once PC metastasizes and that pain and fatigue are especially prominent in men with advanced PC (Sullivan et al., Reference Sullivan, Mulani and Fishman2007). Three out of seven time-points (baseline, 3, and 5 years) were used in the analysis in order to maximize the number of participants included in each group. Bonferroni post-hoc tests, with pairwise comparisons of the three time-points within each group, were performed to identify between which time-points the differences within each group occurred (Table 4). To control for sociodemographic factors, age was added as a covariate to the RM ANOVA. For all analyses, a significance level of p < 0.05 was considered statistically significant. Statistical analyses were conducted using the software SPSS Statistics 26 for Windows (IBM, Armonk, NY, USA).
Patient characteristics and differences in medical and sociodemographic data in the non-mPC and mPC groups
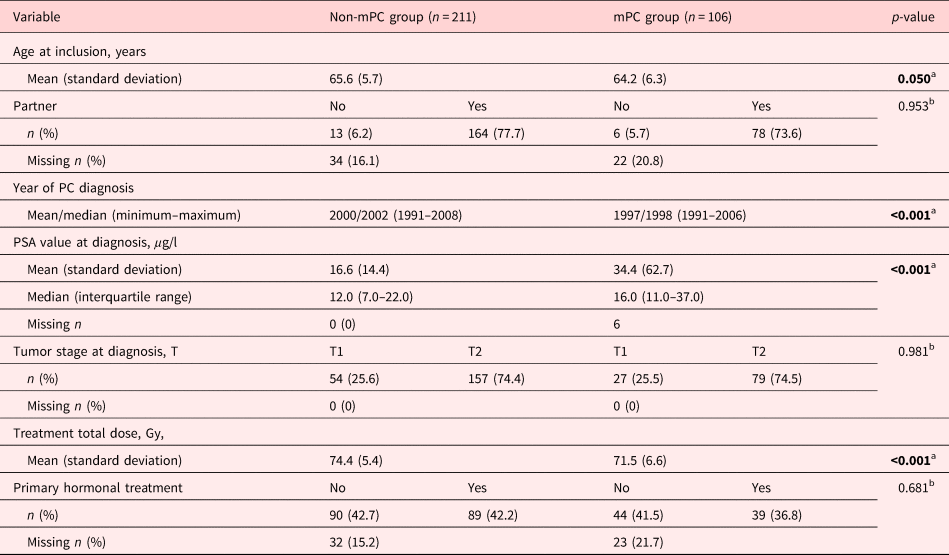
Statistically significant p-values are in bold.
a Calculated using Student's t-test.
b Calculated using Pearson's χ 2 test.
Levels of symptoms, QoL, and functioning between the mPC and non-mPC) groups compared to clinically significant threshold values and compared between groups using Mann–Whitney U tests
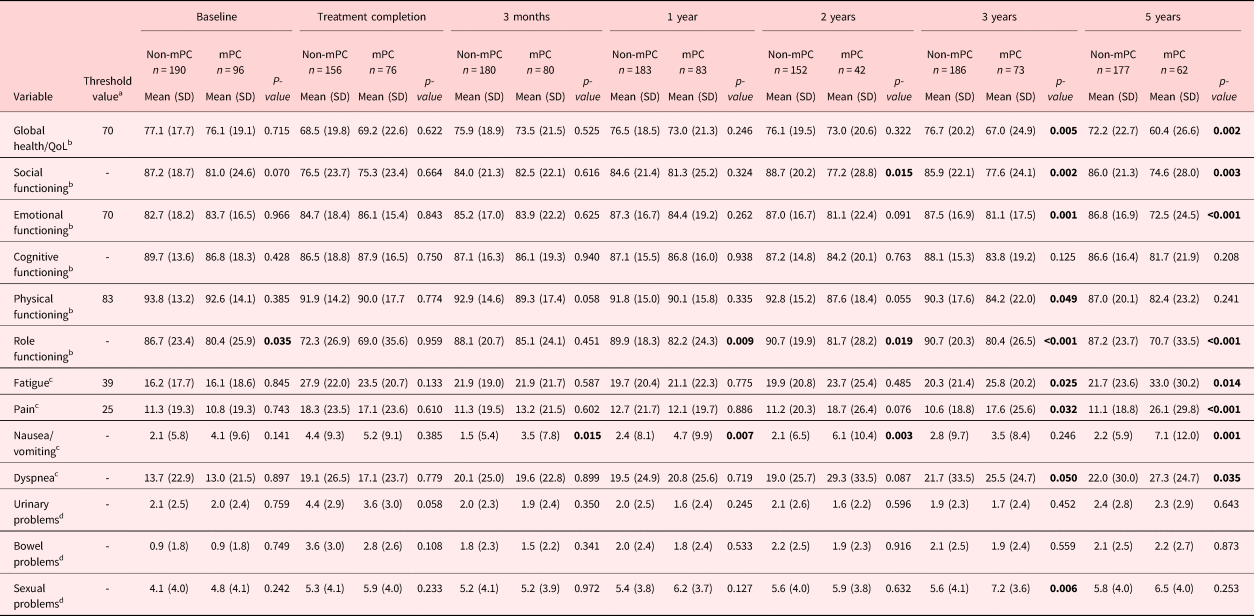
Statistically significant p-values are in bold.
a EORTC-QLQ-C30. Established clinically important threshold values (Snyder et al., Reference Snyder, Blackford and Okuyama2013).
b EORTC-QLQ-C30. Higher values indicate better QoL and functioning.
c EORTC-QLQ-C30. Higher values indicate more symptoms.
d PCSS. Higher values indicate more problems.
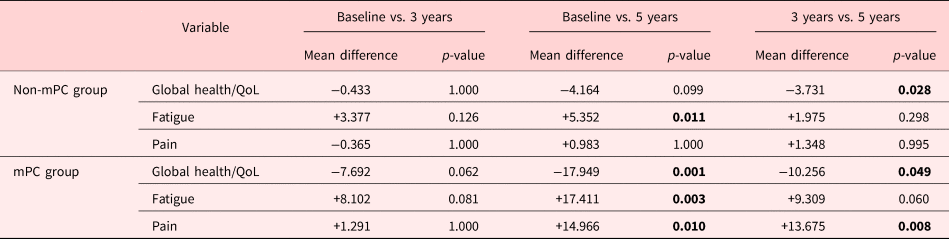
Development of quality of life (QoL), symptoms, and differences over time within the non-mPC and mPC groupsa, b
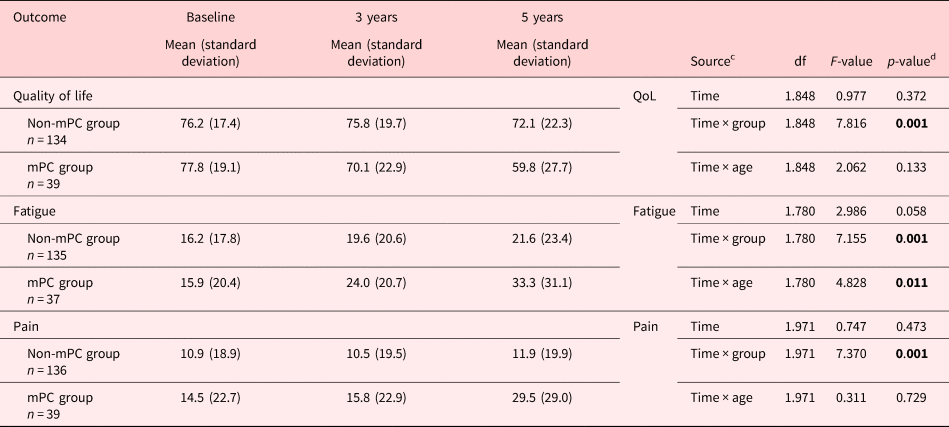
Statistically significant p-values are in bold.
a Based on repeated measures ANOVA.
b Controlled for age.
c Time: effect over time within the groups. Time × group: effect over time between the groups. Time × age: effect over time controlled for age.
d Huynn–Feldt-corrected p-values due to violation of sphericity.
To find out if the differences between the groups could be explained by the development of metastases in the mPC group, a sensitivity analysis was performed where patients who had developed metastases during the 5-year period (n = 35) where excluded in analyses from the time-point where metastases had been clinically verified. At the same time-point, their corresponding matches (n = 70) in the non-mPC group were also removed from analysis. At each follow-up, mean ratings and standard deviations were calculated in both groups and independent samples Mann–Whitney U tests were used to explore differences between the groups.
Results
Group characteristics
Of the 107 men in the mPC group and the 214 men in the non-mPC group, data were obtained from 106 and 211 men, respectively, and hence, these men constituted the sample for this study (Table 1). The mPC group was significantly younger compared to the non-mPC group at baseline (p = 0.050) and on average had received their PC diagnosis 3 years earlier than the non-mPC group (p < 0.001). The mPC group also had significantly higher PSA values at diagnosis (p < 0.001), while the non-mPC group received a significantly higher total radiation dose (p < 0.001). No differences between the groups were observed regarding tumor stage at diagnosis (p = 0.981), marital status (p = 0.953), or whether they received hormone therapy or not (p = 0.681).
Levels of, and differences in, symptoms
The symptom levels were generally low in both groups (Table 2). The ratings of pain and fatigue were generally within a range of the clinically relevant threshold values (Snyder et al., Reference Snyder, Blackford and Okuyama2013) at all follow-ups except at 5 years — where the mPC group rated their pain [mean 26.1 (SD 29.8)] above the threshold value (25). At 3 months post-treatment, a significant difference (p = 0.015) in mean values in nausea/vomiting was observed between the two groups, where the mPC group reported more problems than the non-mPC group. The significant difference remained at the 1-year (p = 0.007) and 2-year (p = 0.003) follow-ups and reoccurred at the 5-year follow-up. Significant differences were found at the 3-year follow-up, where the mPC group scored their fatigue (p = 0.025), pain (p = 0.032), and dyspnea (p = 0.050) worse than the non-mPC group. The differences remained significant at the 5-year follow-up. For prostate-specific symptoms, a significant difference was observed at the 3-year follow-up — where the mPC group rated their sexual problems as significantly worse than the non-mPC group (p = 0.006). No significant differences were observed between the groups regarding urinary- or bowel problems at any follow-up.
Levels of, and differences in, QoL and functioning
The QoL and functioning levels were generally high in both groups (Table 2). When compared to the clinically relevant threshold values, the ratings of QoL, physical functioning, and emotional functioning were generally within a range of the threshold values (Snyder et al., Reference Snyder, Blackford and Okuyama2013) during the first 2 years. The non-mPC group rated their QoL and functioning above the threshold values in all follow-ups except for at treatment completion, where they rated QoL [mean 68.5 (SD 19.8)] below the threshold value (70). The mPC group rated their QoL below the threshold value (70) at treatment completion [mean 69.2 (SD 22.6)], the 3-year [mean 67.0 (SD 24.9)] and 5-year follow-ups [mean 60.4 (SD 26.6)]. At the 5-year follow-up, they also rated their physical functioning [mean 82.4 (SD 23.2)] below the threshold value (83).
A difference was found in role functioning between the groups at baseline (Table 2), where the mPC group scored significantly worse than the non-mPC group (p = 0.035). Otherwise, no statistically significant differences were observed in reported QoL or functioning between the mPC and non-mPC groups at baseline or upon treatment completion. The significant difference in role functioning remained at the 1-year (p = 0.009), 2-year (p = 0.019), 3-year (p < 0.001), and 5-year (p < 0.001) follow-ups. The mPC group also scored significantly poorer social functioning at 2, (p = 0.015), 3 (p = 0.002), and 5 years (p = 0.003) compared to the non-mPC group. At the 3-year follow-up, significant differences between the groups were observed for all variables except for cognitive functioning. The same pattern was observed at 5 years, with significant differences observed for all variables except cognitive and physical functioning.
Results from the sensitivity analysis
In the sensitivity analysis, all patients who developed metastases (n = 35) within the second to fifth years (and their corresponding matches, n = 70) were removed from the follow-up where metastases had been verified (3 at 1-year, 4 at 2-year, and 14 at the 3- and 5-year follow-ups respectively). The men in the mPC group that developed metastases (n = 35) did so on average at 5 years from inclusion (mean: year 2002, range: years 1995–2010). In this analysis, the significant differences remained in role functioning at baseline and the 1-year follow-up, and in nausea and vomiting at the 3 months, 1-year, and 2-year follow-ups. However, none of the other significant differences in the other variables remained between the groups and no new significant differences were found. When removing the patients with metastases from the mPC group (and their corresponding matches), both the mPC and the non-mPC groups also rated their QoL, functioning, and symptoms within the range of the clinically significant threshold values (Snyder et al., Reference Snyder, Blackford and Okuyama2013) at all follow-ups.
Trajectories of QoL and symptoms
The results from the RM ANOVA revealed significant differences between different time-points within both the mPC group and the non-mPC group (Tables 3, 4). In the non-mPC group, a significant decrease was found in QoL between 3 and 5 years (p = 0.028). Also, the group's reported fatigue had significantly increased between baseline and 5 years (p = 0.011). In the mPC group, QoL was found to significantly decrease (p = 0.001) between baseline and 5 years. Also, between baseline and 5 years, their fatigue and pain increased significantly (p = 0.003 and p = 0.010, respectively). Furthermore, a significant decrease was found for QoL (p = 0.049) between 3 and 5 years, while pain increased significantly (p = 0.008) during the same time period. No significant differences were found for QoL, fatigue, or pain in either group between baseline and 3 years (Table 4). When controlling for age, there was a significant difference over time only in fatigue (Table 3).
Discussion
The results showed that there were very few differences between the groups early in the disease trajectory but that men with mPC gradually scored worse in symptoms, QoL, and functioning, while the non-mPC group remained more stable over time. The differences in patient-reported outcomes increased between the mPC group and the non-mPC group from 2 years after diagnosis.
The aim of this study was to identify early symptoms and changes in QoL among men with PC who later develop metastases. Even if the results show that the development of metastases could not be predicted by worsening patient-reported outcome scores, it does indicate that once metastases occur among men with PC, close monitoring of symptoms, functioning, and QoL may serve to identify patients who develop needs for support and intervention against severe or debilitating problems. With this group of patients whose disease usually develops gradually with a long trajectory (Siegel et al., Reference Siegel, Miller and Jemal2018), the trend and overall changes in scores in both groups have to be considered over time for men with PC. From baseline to the 5-year follow-up, the mPC group scores deteriorated in all outcome measures and approached what would be considered “very much change” (Osoba et al., Reference Osoba, Rodrigues and Myles1998) for QoL, pain, and fatigue. Clinically, this is indicative of a considerable change that would require attention and possibly the need for intervention. Up until the 5-year follow-up, both groups’ ratings were generally within the threshold values (Snyder et al., Reference Snyder, Blackford and Okuyama2013) for symptoms, QoL, and functioning. However, at the 5-year follow-up, the mPC group reported scores under the threshold values for QoL and physical functioning and above the threshold value for pain, indicating the need for clinical attention (Snyder et al., Reference Snyder, Blackford and Okuyama2013).
The increasing symptom burden and deteriorating QoL and functioning among the men in the mPC group are also in line with the findings from a review on supportive needs of men with PC, where physical symptoms were a salient domain where the men had unmet supportive needs (Paterson et al., Reference Paterson, Robertson and Smith2015). Furthermore, in a disease that progresses slowly (Sanford et al., Reference Sanford, Greene and Carroll2013; Siegel et al., Reference Siegel, Miller and Jemal2018), an absence of distressing symptoms early in the disease course does not mean that distressing symptoms cannot occur later on. The results of this study showed significant differences in QoL, symptoms, and functioning that occurred over time within both groups (Tables 3 and 4). The study lacks complete data on disease-directed treatments beyond the initial RT and hormone treatment and, thus, did not have access to data on possible life-prolonging treatments that have become standard for men with advanced mPC over the past decade and a half (Siegel et al., Reference Siegel, Miller and Jemal2018; Sumanasuriya and De Bono, Reference Sumanasuriya and De Bono2018). It is possible, if not probable, that some of the men in the mPC group have undergone additional disease-directed treatments during their time in the study, opening up the possibility that treatment side effects could have affected the scores in the mPC group. Potential life-prolonging treatments could have influenced the men's symptoms, functioning, and QoL in a positive way, as their lives may have been prolonged and distressing symptoms relieved but could also have influenced them negatively as many treatments have side effects. Even though this study does not take specific treatments into consideration in the analyses, the mPC group reports problems with QoL, functioning, and symptoms that need to be recognized and addressed, regardless of the origin of each outcome. Furthermore, the results show significant differences for QoL and fatigue over time in the non-mPC group, where QoL deteriorated and fatigue increased over time. Although their change in mean scores over time for these outcomes (Table 3) is not as large as in the mPC group, decreasing QoL and increasing fatigue could greatly impact the daily lives of the men who experience this. This study concludes that men with PC could benefit from early monitoring and early integration of a supportive care approach to monitor QoL, functioning, and symptoms and to intervene in highly treatable symptoms and improve QoL also early in the disease trajectory (Paterson et al., Reference Paterson, Robertson and Smith2015; Haun et al., Reference Haun, Estel and Rucker2017). Previous research also shows that men with advanced PC have limited access to symptom control and supportive care despite a pronounced symptom burden, due to, for example, delayed/absent palliative care services referrals (Collins et al., Reference Collins, Sundararajan and Millar2019) or lack of information on how to access supportive care when needed (King et al., Reference King, Evans and Moore2015). The often-long PC disease trajectory is commonly action-intensive initially, at the time for diagnosis and initial treatment, after which follow-ups are commonly fewer or done at longer intervals. In Sweden, for example, the National Programme for Prostate Cancer Care (2021) states that evidence for specific time intervals or -points for follow-ups is lacking. Instead, follow-up recommendations are based on clinical experience. Despite the growth of the supportive and palliative care research- and clinical fields, patients still report severe symptoms and limited access to supportive care (King et al., Reference King, Evans and Moore2015; Collins et al., Reference Collins, Sundararajan and Millar2019). A possible reason could be that there is not a structured way to identify the patients who experience escalating symptoms or deteriorating QoL and functioning. Furthermore, in a disease such as PC that progresses slowly, it is also possible that even the patients themselves do not bring healthcare professionals’ attention to symptoms or problems even if they are encouraged to do so, simply due to their gradual onset or development. If a healthcare organization lacks structures and routines for regular QoL and symptom follow-ups of patients with PC during all stages of the disease trajectory, it is perhaps not surprising that opportunities to provide alleviating measures and support may be missed. Working toward establishing structured follow-up schemes at clinics that provide care for PC patients may serve to increase and “catch” more of these opportunities. The assessment of QoL, symptoms, and functioning, using structured instruments/questionnaires to detect and follow these outcomes measures, could be done at set time-points at clinic visits or over the phone by the treating physician or contact nurse.
Strengths of this study include a prospective, long-term follow-up of patients and several measurement points over a long follow-up time. Another strength is that a matching process was conducted to reduce the risk that variations in tumor stage, primary treatment, and elapsed time from the last questionnaire to death between the groups would influence the results. There are also limitations that must be considered in relation to the presented results. The study lacks complete data regarding treatments given during follow-up after the initial RT. The earliest data were collected as far back as the early 1990s, and the changing treatment regimens over time (Sumanasuriya and De Bono, Reference Sumanasuriya and De Bono2018) must be taken into account when considering the study results.
The mPC group had significantly higher blood serum levels of PSA at baseline which could indicate a more aggressive cancer even though there were no differences in tumor stage between the groups at baseline. Also, high values in single individuals impacted the mean value in the mPC group, whereas the median values were closer between the groups (Table 1). PSA values were not included in the matching between the groups since the number of individuals was too low to find good matches on this criterion, meaning that this potential difference in aggression could not be taken into account. Gleason scores were not available for the study population before the year 2000 (Epstein et al., Reference Epstein, Amin and Reuter2017), hence neither such scores could be used to compare the level of aggression. However, despite the possibility that the mPC group had a more aggressive disease, there were no significant differences between the groups regarding symptoms, QoL, and functioning at baseline except for role functioning.
Conclusion
The results of this study indicate that despite calls for a supportive care approach early in the disease course for men with PC, there are still unmet supportive needs that occur over time among men with mPC. Worsening QoL or functioning, as well as increasing symptoms, may be difficult to recognize in patients where the negative development is gradual and stretches over several years, and with various access to systematic follow-up in late phases. Nevertheless, it seems imperative that these issues be continuously addressed by healthcare professionals when meeting men with PC at all stages, including men who have successfully undergone curatively intended treatment and have not developed advanced PC. Continuous monitoring of patient-reported outcomes provides an opportunity for early detection of supportive care needs, and initiation of supportive interventions at all stages of PC.
Conflict of interest
There are no conflicts of interest.


 Open access