





Introduction
This article briefly examines the problem of “demand for demand” faced by Japan’s commercial whaling industry and erstwhile whaling locales, focusing on how the city of Shimonoseki, Japan’s largest and most important whaling port, addresses intergenerational differences in whale consumption through the command economy of the public school lunch program. With this case study in mind, the article concludes by proposing a novel theoretical approach for additional research on the question of whaling’s future. I hypothesize that applying concepts drawn from research on complex, nonlinear natural and social systems can help to explain the current and likely future persistence of a stable social regime in Japan in which, industry efforts notwithstanding, the large-scale, widespread consumption of whale products is exceptionally unlikely.
Whale meat consumption in Japan peaked in 1962 before dwindling to economic inconsequentiality decades ago. Nevertheless, its cultural and political significance has dramatically increased since the International Whaling Commission’s (IWC) 1986 whaling moratorium; political entrepreneurs and other vested interests aggressively rebranded this mostly local, possibly moribund industry as a key cultural marker of “Japaneseness” and a sacrosanct national “core interest” to be defended regardless of the cost to Japan’s reputation or the cost in generous public subsidies. Having made whaling an issue of national cultural significance, whaling’s promoters in government and industry have financially and rhetorically propped up the industry, promoting whale hunting and consumption as indispensable national culture, history, and heritage (Smith Reference Smith2008). This cultural narrative of whaling’s importance—whaling as Japanese culture, the equation of whaling culture and Japanese culture, etc.—has been buttressed by “scientific” justifications for the continuation of whaling. These include arguments that whaling is “rational” and anti-whaling is “irrational” on the one hand, and other arguments—often, as Hopson (Reference Hopson2024) has shown, framed in recent years in terms of the United Nations’ Sustainable Development Goals (SDGs)—that whaling is necessary to cull an overabundant apex predator and rebalance the marine ecosystem on the other.
Demand for demand
Broadly speaking, for the purposes of research, there are four parts to the problem of “demand for demand.”
First is the apotheosis of whaling. We need to understand how, when, and why whaling was elevated to the status of national culture and heritage, how and why this narrative has been disseminated (and what, if any, effects it has on public opinion), and how this cultural narrative has synergized with scientific—or scientized—justifications for continued commercial whaling (Ishii and Sanada 2015). Additionally, we need to uncover the diversity of both narratives and practices of human–whale relations within Japan that this hegemonic discourse emanating from the whaling industry and the whaling camp attempts to obscure.
Second, there is supply without demand. To the dismay of whaling supporters in Japan, leaving the IWC in 2019 has paradoxically meant fewer whales slaughtered each year. That is because Japan has confined itself to the waters around the archipelago instead of the “scientific whaling” in the Antarctic that had supplied most of the meat for the domestic market in previous years. This is a problem for the Japanese pelagic whaling industry and the cultural nationalist actors promoting it. Whale meat, both Japanese-caught and imported, was piling up in warehouses even as Japan’s largest whaling company, Kyōdō Senpaku, launched the first new factory ship in decades in 2024. Kyōdō Senpaku was consolidated in 1987 as part of the Japanese response to the moratorium. Heavily subsidized until Japan left the IWC and still the recipient of zero-interest, zero-collateral loans from state coffers, the company is the flagship carrier of Japanese commercial whaling now that its role in collecting, processing, and wholesaling “byproducts” from Japan’s moratorium-era “scientific whaling” on behalf of the Institute for Cetacean Research (ICR) is over. Ostensibly cut off from government subsidies in 2020 after Japan left the IWC, Kyōdō Senpaku faces a stiff challenge in turning a profit.Footnote 1 Demand even in Japan has remained low and the unit price high. This presents Kyōdō Senpaku with genuine challenges.
Finally, there is the demand for whaling in whaling and post-whaling spaces. This is the nostalgia for the era in which whaling was, despite the hardships involved, a source of tremendous prosperity for a small number of communities in modern Japan, especially in the postwar peak years. In addition to coastal towns and cities such as Shimonoseki, Taiji, and Ayukawa, a scattered few inland towns sent young men to the Antarctic fisheries. For these communities, whaling was transformative. And it brought more diffuse but equally important benefits to Japan as a whole. Like other extractive industries and external expansion, i.e., imperialism and colonialism, industrial whaling provided not just a concentrated influx of capital into local communities, it harnessed abundant new sources of energy to fuel economic growth. It was also subject to Jevons paradox, the axiomatic observation that demand tends to go up rather than down as resource extraction becomes cheaper and more efficient. The twentieth century’s so-called “Whaling Olympics” is evidence enough of this, but whaling had been profligate and destructive for centuries at that point (Epstein Reference Epstein2008: 28; Kalland Reference Kalland2009: 66; Andresen and Nese Reference Andresen, Aarvik Nese, Sellheim and Morishita2024: 28). In all these ways, modern commercial whaling resembles, for example, the coal industry for which many Americans are nostalgic. This post-industrial nostalgia fuels a demand for a return to the “golden age of whaling” (Akamine 2019: 59).
However, the industry struggles to stimulate demand for whale products, not just whaling. Perhaps the most important aspect of this issue—both practically and in terms of academic analysis—is the domestic intergenerational tension that accompanies international tension. Nostalgia for whaling and whale meat is largely confined to older generations, the “whale generation” (Igarashi and Kizu 2024) of baby boomers that grew up with whale meat as a critical source of protein in the face of postwar food shortages. Their children and grandchildren, raised with a more diverse diet that included little or no whale, are mostly indifferent (Komatsu 2011: 4; Kishimoto and Nakagawa 2025). This is especially significant for an industry that has lost several major political backers in recent years. It is also the most significant problem when considering the possible futures of whaling in Japan, a point to which I will return in the concluding remarks.
Shimonoseki
This article focuses on this third aspect of “demand for demand,” how whaling and post-whaling spaces address this generational divide. My case study is Japan’s commercial whaling center, Shimonoseki, home port for the country’s sole operating pelagic whaling fleet. At approximately 240,000 people, Shimonoseki is the largest city by population in Yamaguchi Prefecture. The city is located at the southwestern tip of Honshu, connected to the industrial hub of Kitakyūshū by the Kanmon Bridge and a parallel undersea pedestrian tunnel. Like most of Japan, the local economy is overwhelmingly concentrated in tertiary industries. According to 2020 census data (cited in Shimonosekishi 2023: 5), primary industries in Shimonoseki employed just under 4% of the city’s 119,000-strong workforce (down from 5% in 2010) and accounted for 0.6% of economic activity by value (about 6.1 of an almost 963-billion-yen local economy). Fisheries accounts for less than one-third of primary industry output, around 190 million yen. Shimonoseki is home to Kyokuyo Shipyard Corporation, which constructed Kyōdō Senpaku’s new flagship, Kangeimaru. This is a 112.6-meter-long, nearly 9300-ton vessel with a reported range of 13,000 km, more than enough to hunt in Antarctic waters (Asahi Shinbun 2024).Footnote 2 This is notable especially considering that the ship cost 7.5 billion yen, a giant investment not profitable at the scale of whaling in which Kyōdō Senpaku currently engages.
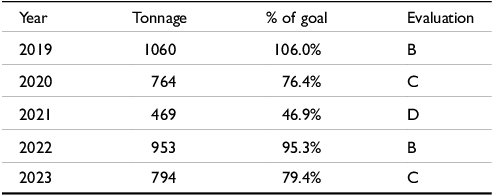
When the company’s fleet returned from a three-month whaling excursion to its home port of Shimonoseki on July 28, 2025, it carried 370 tons of whale meat, lifting the season’s total just past the kiloton mark (KRY Yamaguchi Hōsō 2025). For comparison, out of a total of 1588 tons caught in the 2024 season, Kyōdō Senpaku unloaded 794 tons of whale in Shimonoseki and 790 tons in Sendai, the number two whaling port in Japan (San’yō Shinbun 2025). Kangeimaru’s second season fell short of the company’s 2-kiloton goal. The same goal was set for its third season, which began on April 19, 2026 (Hiragi 2026). Even the ambitious goal of 2000 tons of whale harvest would amount to less whale meat than Japan both holds in frozen reserves or imports annually from Norway and Iceland some years, and is less than 1% of the total harvested by Japanese Antarctic fleets during the peak years of the “whaling Olympics” in the first half of the 1960s (Kalland and Moeran Reference Kalland and Moeran1992: 12; Jones Reference Jones2022: 71; Nōrinsuisanshō 2025).
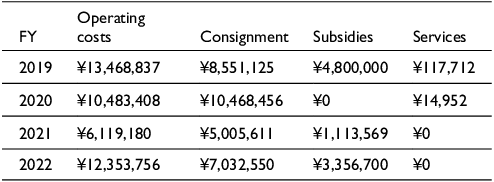
Scale is an important element in discussions of whaling, as these numbers suggest. On the one hand, the amount of even pelagic whaling in which Kyōdō Senpaku is engaged is barely a drop in the bucket in the context of Japan’s 12-trillion-yen, 127-million-person economy and the global marine ecosystem. This is clear from the city’s fiscal 2019–2022 budget for whaling promotion (see Table 1), especially in comparison to the average total budget of almost 192 billion yen over that same period and 135 billion yen in 2025 (Shimonosekishi n.d.).
Shimonoseki’s whaling promotion budget

On the other hand, mobilization of the “Great Replacement Theory” that whales are outcompeting humans by eating the oceans to death and must be culled to keep the marine environment in balance and protect fish stocks for human consumption implies—or at the very least, is not incompatible with—a return to the profligate “Olympic”-era industrial slaughter of whales.Footnote 3 Not only does the idea that whales are “the cockroaches of the high seas” (Kyōdō Tsūshin 2001) mirror the fallacy-cum-fantasy of the so-called “super whale” critiqued by whaling supporters (Kalland Reference Kalland1992, Reference Kalland1993), but it also flies in the face of both Japan’s own protestations that its “scientific management” calculations ensure that the whale population will remain unaffected for another century. This is particularly ominous in light of Kyōdō Senpaku’s massive investment in its brand-new, long-range, high-capacity factory ship. The same problem exists when it comes to arguments for whale as a source of Japanese national food security (e.g., Freeman Reference Freeman1991; Diaz Reference Diaz2004; Morishita 2023, Reference Morishita2024): the number of whales that would need to be slaughtered to have any appreciable impact on Japanese protein self-sufficiency is so improbably astronomical as to invalidate any pretense of sustainability. This is the whaling industry trying to have its whale and eat it, too.
Shimonoseki’s four-part strategy
Shimonoseki is building an identity as the “City of History and Whales.” To integrate the culture of whaling and whale consumption into the everyday lives of its residents and promote the whaling industry itself, the city is pursuing the following measures (Kishimoto and Tezuka 2021):
-
• Normalize whale cuisine in daily life
-
• Promote whale consumption to younger generations
-
• Highlight the nutritional value of whale and expand its presence in the tourism industry
-
• Develop a bifurcated (luxury-everyday) market like other meats and fish
Elsewhere, the city’s “Whale Town Shimonoseki” promotion plan is described as having just three “pillars” (Shimonosekishi Nōrinsuisan Shinkōbu Suisan Shinkōka 2023). In order, they are:
-
• Whale meat in school lunches
-
• Promotion of whale meat consumption
-
• Promotion of Shimonoseki as Kyōdō Senpaku’s home port
Together, these bullet points encapsulate a four-part strategy shared across Japan, supported by commercial whaling concerns led by Kyōdō Senpaku, the Fisheries Agency, and the industry-affiliated ICR. In brief, that strategy is normalization, intergenerational transmission, marketing as a health food, and product-line stretching. In concert with this strategy, Shimonoseki targets school lunches, youth, whaling supporters, and inbound tourists to address the problem of demand for demand. The city’s measures overlap most clearly with the first two categories of the overall whaling promotion strategy—normalization and intergenerational transmission—while product-line stretching, new-product development (NPD), and marketing are left mostly to Kyōdō Senpaku.
Specifically, the city plans workshops to develop and disseminate whale recipes in the interest of normalizing whale consumption at home and making it more attractive in restaurants, and to make “Whale Day” (September 4) a bigger event locally. These efforts are intended to normalize and legitimize a local and national history and culture of whaling. Shimonoseki is exceptional in the degree to which tourism plays a role in promoting the city’s brand identity as a whaling city, and perhaps in the number of whaling-related events it has played host to in recent decades. For example, in May 2002, Shimonoseki hosted the five-day-long 54th Annual Meeting of the IWC. In November–December 2010, the city built on this experience with a four-day international symposium on “the sustainable use of cetaceans.” On the domestic front, Shimonoseki played host to a traditional whaling summit in 2005 and sequels in 2012 and 2020. In 2006, the city entered a partnership with neighboring Nagato, which shares historical connections to whaling. Shimonoseki has additionally been the site of many smaller events and provides support for private organizations promoting whale as food.
Overall, Shimonoseki’s promotion of whale meat consumption took a major step forward with the establishment in May 2020 of a promotion council. This landmark came on the heels of the 2019 Japanese decision to leave the IWC. The key activities of this public–private partnership include creating and distributing “Whale served here” PR pennants to identify local restaurants with whale on the menu, setting targets for annual whale catch unloading at the city’s port (see Table 2), and providing whale to local school lunches.
Whale landing volume (Shimonoseki)

Whale school lunches
Of all the initiatives to promote whale meat consumption, the provision of whale to Shimonoseki’s public school lunch program is particularly notable. This project has been ongoing since the 1998 academic year. In the 2019 school year, the number of whale meat meals served to the 20,000 children in Shimonoseki’s public kindergartens, elementary, and junior high schools was increased from 70,000 to 100,000, where it has remained. This is roughly five servings of whale meat per child per school year. A number of municipalities with historical connections to the whaling industry, such as Nagasaki and Ishinomaki, also have whale meat school-lunch programs heavily subsidized by the whaling industry. For instance, among the ICR’s “public service initiatives” is subsidizing whale-meat school lunches “to make younger generations understand whales as food.” The most recent data available (Nihon Geirui Kenkyūjo 2023) show that the institute provided 104 tons of whale meat to elementary and junior high schools in 28 prefectures during the 2022 school year. This meat was distributed primarily in areas with a historical association with whaling at one-third of the market price.
However, Shimonoseki’s program is the largest—not least because Shimonoseki is the biggest “whaling town” in Japan and the home of Kyōdō Senpaku (interviews with Chiba Takashi, February 12, 2026; Minezoe Ryō, March 13, 2026). The goal of all these programs, whether regular or sporadic and regardless of their scale, is to promote whale-eating culture to younger generations. Whether this is meant to preserve “Japanese culture” or revive the commercial whaling industry is not always so clear.
What is clear is that for the whaling industry, the problem of demand for demand is a generational one. Generational change is one of the most profound factors in historical change, though not simply because of demographics. Shimonoseki is attempting to tackle the problem of generational change head-on via its school lunch program with the understanding that “For children to eat whale regularly as adults, ‘whale school lunches’ must be seen as a regular menu item, not a special one” (Kishimoto and Tezuka 2021).Footnote 4 Unsurprisingly, the effort to promote whales to younger generations extends to the Yamaguchi prefectural level as well. This is why, as a three-minute promotional video (Yamaguchi 2023) for the “prefecture’s efforts to expand whale meat consumption” puts it, “children learn about whale meat through school lunches.” Interspersed with footage of a classroom full of elementary school students eating whale-meat lunch on camera and responding somewhat awkwardly to the interviewer’s questions about exactly how delicious whale is, the host asserts that not only is whale “one of children’s favorites,” but whale is an exceptionally healthy (Hopson Reference Hopson2024) alternative to meat: “Whale meat is not just delicious but also nutritionally outstanding. It is high in protein, low in fat, and [relieves] fatigue.”
Concluding remarks
In lieu of a conclusion, I would like to offer a direction for further research. Taking an analogy from research originally performed on regime shift and the resilience of complex ecological systems, especially aquatic ecology (Kosten et al. Reference Kosten, Veraart, Dakos, Thomas and Klement2022), but now applied to social phenomena such as norm shifts (Strand and Lizardo Reference Strand and Lizardo2017; Sznajd-Weron et al. Reference Sznajd-Weron, Arkadiusz and Barbara2024), I would like to suggest the possibility of understanding the norm of whale consumption as a nonlinear system. Nonlinear systems can have multiple stable dynamic states, i.e., regimes. Each stable regime is the result of a particular set of negative feedback loops that hold it within a given state around a central point called a basin of attraction. Some systems have multiple possible stable states, or regimes. A bistable system, for instance, has two possible stable states. In a system with multiple stable states, rapid, functionally irreversible regime shifts can occur (Scheffer Reference Scheffer, Simon and Stephen2009: 397). Each time a feedback loop is disturbed, the regime’s resilience is diminished. As detailed by Scheffer et al. (Reference Scheffer, Carpenter, Dakos and van Nes2015: 147), resilience can be visually represented as the width and depth of a basin of attraction—representing the maximum degree of perturbation sustainable before a regime shift and the energy required for that shift, respectively—and the slope on either side of an equilibrium point, which corresponds to engineering resilience. As the authors continue, “all three aspects of resilience tend to decline in concert as a system moves toward a tipping point.” Eventually, a stressed or perturbed system transitions across a critical phase transition threshold (tipping point) and into a new basin of attraction. This establishes a new stable equilibrium state, as shown in Figure 1.
The state of a system depends on its history. This diagram (adapted from Scheffer Reference Scheffer, Simon and Stephen2009), schematically visualizes hysteresis using critical transitions in lake ecology as an illustrative example. The y-axis shows water clarity. The x-axis shows the degree of perturbation, in this case by nutrient loading. F1 and F2 are tipping (bifurcation) points between these two states. The orange and green branches of this diagram represent stable equilibria. The blue band (top) represents a “healthy” lake with clear water. The green band (bottom) represents a turbid, algae-clogged lake. Catastrophic shift from the blue stable equilibrium to green occurs at F2. Backward shift occurs only when conditions return to F1. This recovery (F1 → F2) requires far greater input than the initial regime shift (F2 → F1). In other words, a system can rapidly (and non-linearly) shift state, and due to hysteresis (“path dependency”) it may be impossible to return to the original state via the same path.

Some such regime shifts are unidirectional or practically so. In other words, a system that is bistable, having two possible regimes centered on two unique sets of conditions, may move relatively easily from A to B but require impossibly large amounts of energy to reverse. This is a result of the property of hysteresis, the history of systems: change is not always reversible because it depends on a system’s past state and can therefore be asymmetrical (Sznajd-Weron et al. Reference Sznajd-Weron, Arkadiusz and Barbara2024: 513). In Genkai-Kato’s (Reference Genkai-Kato2007: 215) summary, “(1) when the key variable… exceeds a threshold even slightly, a regime shift occurs abruptly; (2) the shift is discontinuous; (3) after the regime shift, it is difficult to restore the state to the original one because of hysteresis.” Practically, then, as Scheffer (Reference Scheffer, Simon and Stephen2009: 397) adds, hysteresis accounts for the difficulty of reversing catastrophic transitions.
Social norms can likewise be modeled as stable equilibria within multistable social systems, so long as it is clear that the map is not the terrain (Sznajd-Weron et al. Reference Sznajd-Weron, Arkadiusz and Barbara2024: 518). A prominent example of the application of these concepts of hysteresis and catastrophic regime change can be found in the sociological work of Bourdieu, who writes, among other things, of the “hysteresis of habitus” and the resulting mismatch between habitus and field (quoted in Hardy Reference Hardy and Grenfell2008: 208; see also Graham Reference Graham2020). More generally, applying nonlinear systems concepts from the natural sciences to social norms results in a view of systems in which multiple patterns of behavior (behavioral regimes) are simultaneously viable under the same external conditions. As in environmental systems, when a tipping point is reached, a norm’s basin of stability collapses, producing a catastrophic transition in which the system abruptly shifts to an alternative equilibrium. Critically, reversing the original causal drivers typically fails to restore the prior norm because the system has reached a new stable regime.
In the specific case of whale consumption in Japan, the hypothesis or model I propose for future exploration is that exogenous and endogenous perturbations have combined to transition Japan from a stable regime in which whale was widely consumed to another in which whale consumption is no longer a social norm, and that the property of hysteresis will make it practically impossible to return to a whale-eating regime. The implications of this would be profound, if impossible to see from the inside and likely to be dismissed as anti-whaling sophistry by the industry and its advocates. More concretely, not only will the provision of less than a half-dozen whale-meat lunches to schoolchildren each year have little effect on the future of whale eating in Japan, even a return to the type of industrial slaughter that characterized much of the twentieth century would likely not be enough to reset the system to its status quo ante.
Financial support
L. Meltzers Universitetsstiftelse for the project “Museums and the Construction of Whaling Narratives in Anti-Anti-Whaling Japan”.
Competing interests
No competing interests to declare.
Author Biography
Nathan Hopson is a professor of Japanese history and language at the University of Bergen, Norway. In addition to a “healthy” interest in narratives shaping discourse on whaling in Japan and Norway, his current research focuses on the social history of nutrition science in modern Japan as a technology of nation building, national food security, and conspiracy theories.


 Open access

