

1. Introduction
Reconstructing the assembly of continents is crucial for sedimentologists to understand palaeogeographical evolution and potential sediment source areas (Dickinson and Suczek, Reference Dickinson and Suczek1979; Allen, Reference Allen2017; Armstrong-Altrin, Reference Armstrong-Altrin2020; Madhavaraju et al. Reference Madhavaraju, Noriega-Montoya, Ramirez-Montoya, González-León and Armstrong-Altrin2024; Myrow et al. Reference Myrow, Goodge, Brock, Betts, Park, Hughes and Gaines2024). After the final assembly of Gondwana, basin-scale fluvial systems originated from the Precambrian orogenic areas. These Precambrian orogenic areas supplied large volumes of sediment into the peri-Gondwanan sedimentary basins (Veevers and Saeed, Reference Veevers and Saeed2009; Chaudhuri et al. Reference Chaudhuri, Das, Banerjee and Fitzsimons2020; Cerri et al. Reference Cerri, Warren and Assine2024; Rajak et al. Reference Rajak, Prabhakar and Banerjee2024a, Reference Rajak, Prabhakar, Banerjee, Dev, George and Tomsonb, Reference Rajak, Banerjee, George, Dev and Tomson2026; Schneider et al. Reference Schneider, Schetselaar, Powell, Tari, Raharisolofo and Ramboasalama2024; Dutta et al. Reference Dutta, Banerjee, Le Pera, George, Singh and Ghosh2026). In response to these, large volume of siliciclastic sediments was deposited within the rifted basins of western India by possible transcontinental drainage systems (Veevers and Saeed, Reference Veevers and Saeed2009; Rajak et al. Reference Rajak, Prabhakar, Banerjee, Dev, George and Tomson2024b, Reference Rajak, Banerjee, George, Dev and Tomson2026).
The progressive rifting of the Eastern Gondwana assembly marked Jurassic–Cretaceous periods. Widespread volcanism, sedimentation, sea-level fluctuations and climatic variability characterized this time interval (Ali and Aitchison, Reference Ali and Aitchison2008; Reeves, Reference Reeves2014; Foley et al. Reference Foley, Baty, Knutsen, Lignum and Roberts2020). Eastern Gondwana, including Australia, Antarctica, India and Madagascar, drifted to its present position, contributing to the formation of the Indian Ocean (Gombos et al. Reference Gombos, Powell and Norton1995; Gibbons et al. Reference Gibbons, Whittaker and Müller2013). The breakup of Eastern Gondwana allowed marine incursions into the craton interior, creating shallow epicontinental seas (Pratt and Holmden, Reference Pratt and Holmden2008). The Narmada basin records thin but laterally extensive sandstone units deposited during the Cretaceous, interpreted to have formed in a low-relief epicontinental setting (Kumari et al. Reference Kumari, Tandon, Kumar and Ghatak2020; Keller et al. Reference Keller, Nagori, Chaudhary, Reddy, Jaiprakash, Spangenberg, Mateo and Adatte2021). The reactivation of the Narmada–Tapti and Krishna–Godavari rifts during the Cretaceous impacts palaeogeographical settings and sediment dispersal. Identifying sediment sources is inherently challenging in epicontinental basins because they are located within cratonic interiors, far from active orogenic belts. Palaeoclimate, palaeogeography and complex sediment routing through fluvial and marine systems further complicate provenance interpretations (Harris and Eriksson, Reference Harris and Eriksson1990; Pratt and Holmden, Reference Pratt and Holmden2008). Provenance and sediment routing of the Cretaceous siliciclastic deposits in the Narmada basin remain poorly understood. Although a few studies have attempted to address these questions (Ahmad and Akhtar, Reference Ahmad and Akhtar1990; Akhtar and Ahmad, Reference Akhtar and Ahmad1991; Akhtar et al. Reference Akhtar, Khan and Ahmad1992; Rajak et al. Reference Rajak, Chaudhuri, Prabhakar and Banerjee2022), the spatio-temporal distribution of the sediments and their link to the Eastern Gondwana breakup remain debated. Therefore, the Narmada basin preserves crucial geological archives of the Cretaceous period, making it an ideal natural laboratory to investigate the sedimentary responses to continental breakup and potential sediment routing. In this context, the present study aims: (a) to unravel the source rocks of these Cretaceous siliciclastic deposits, (b) to discuss the palaeodrainage evolution in the hinterland area associated with the final phase of the Eastern Gondwana rifting and (c) to examine possible India–Madagascar connection during the Cretaceous period.
2. Geology of the study area
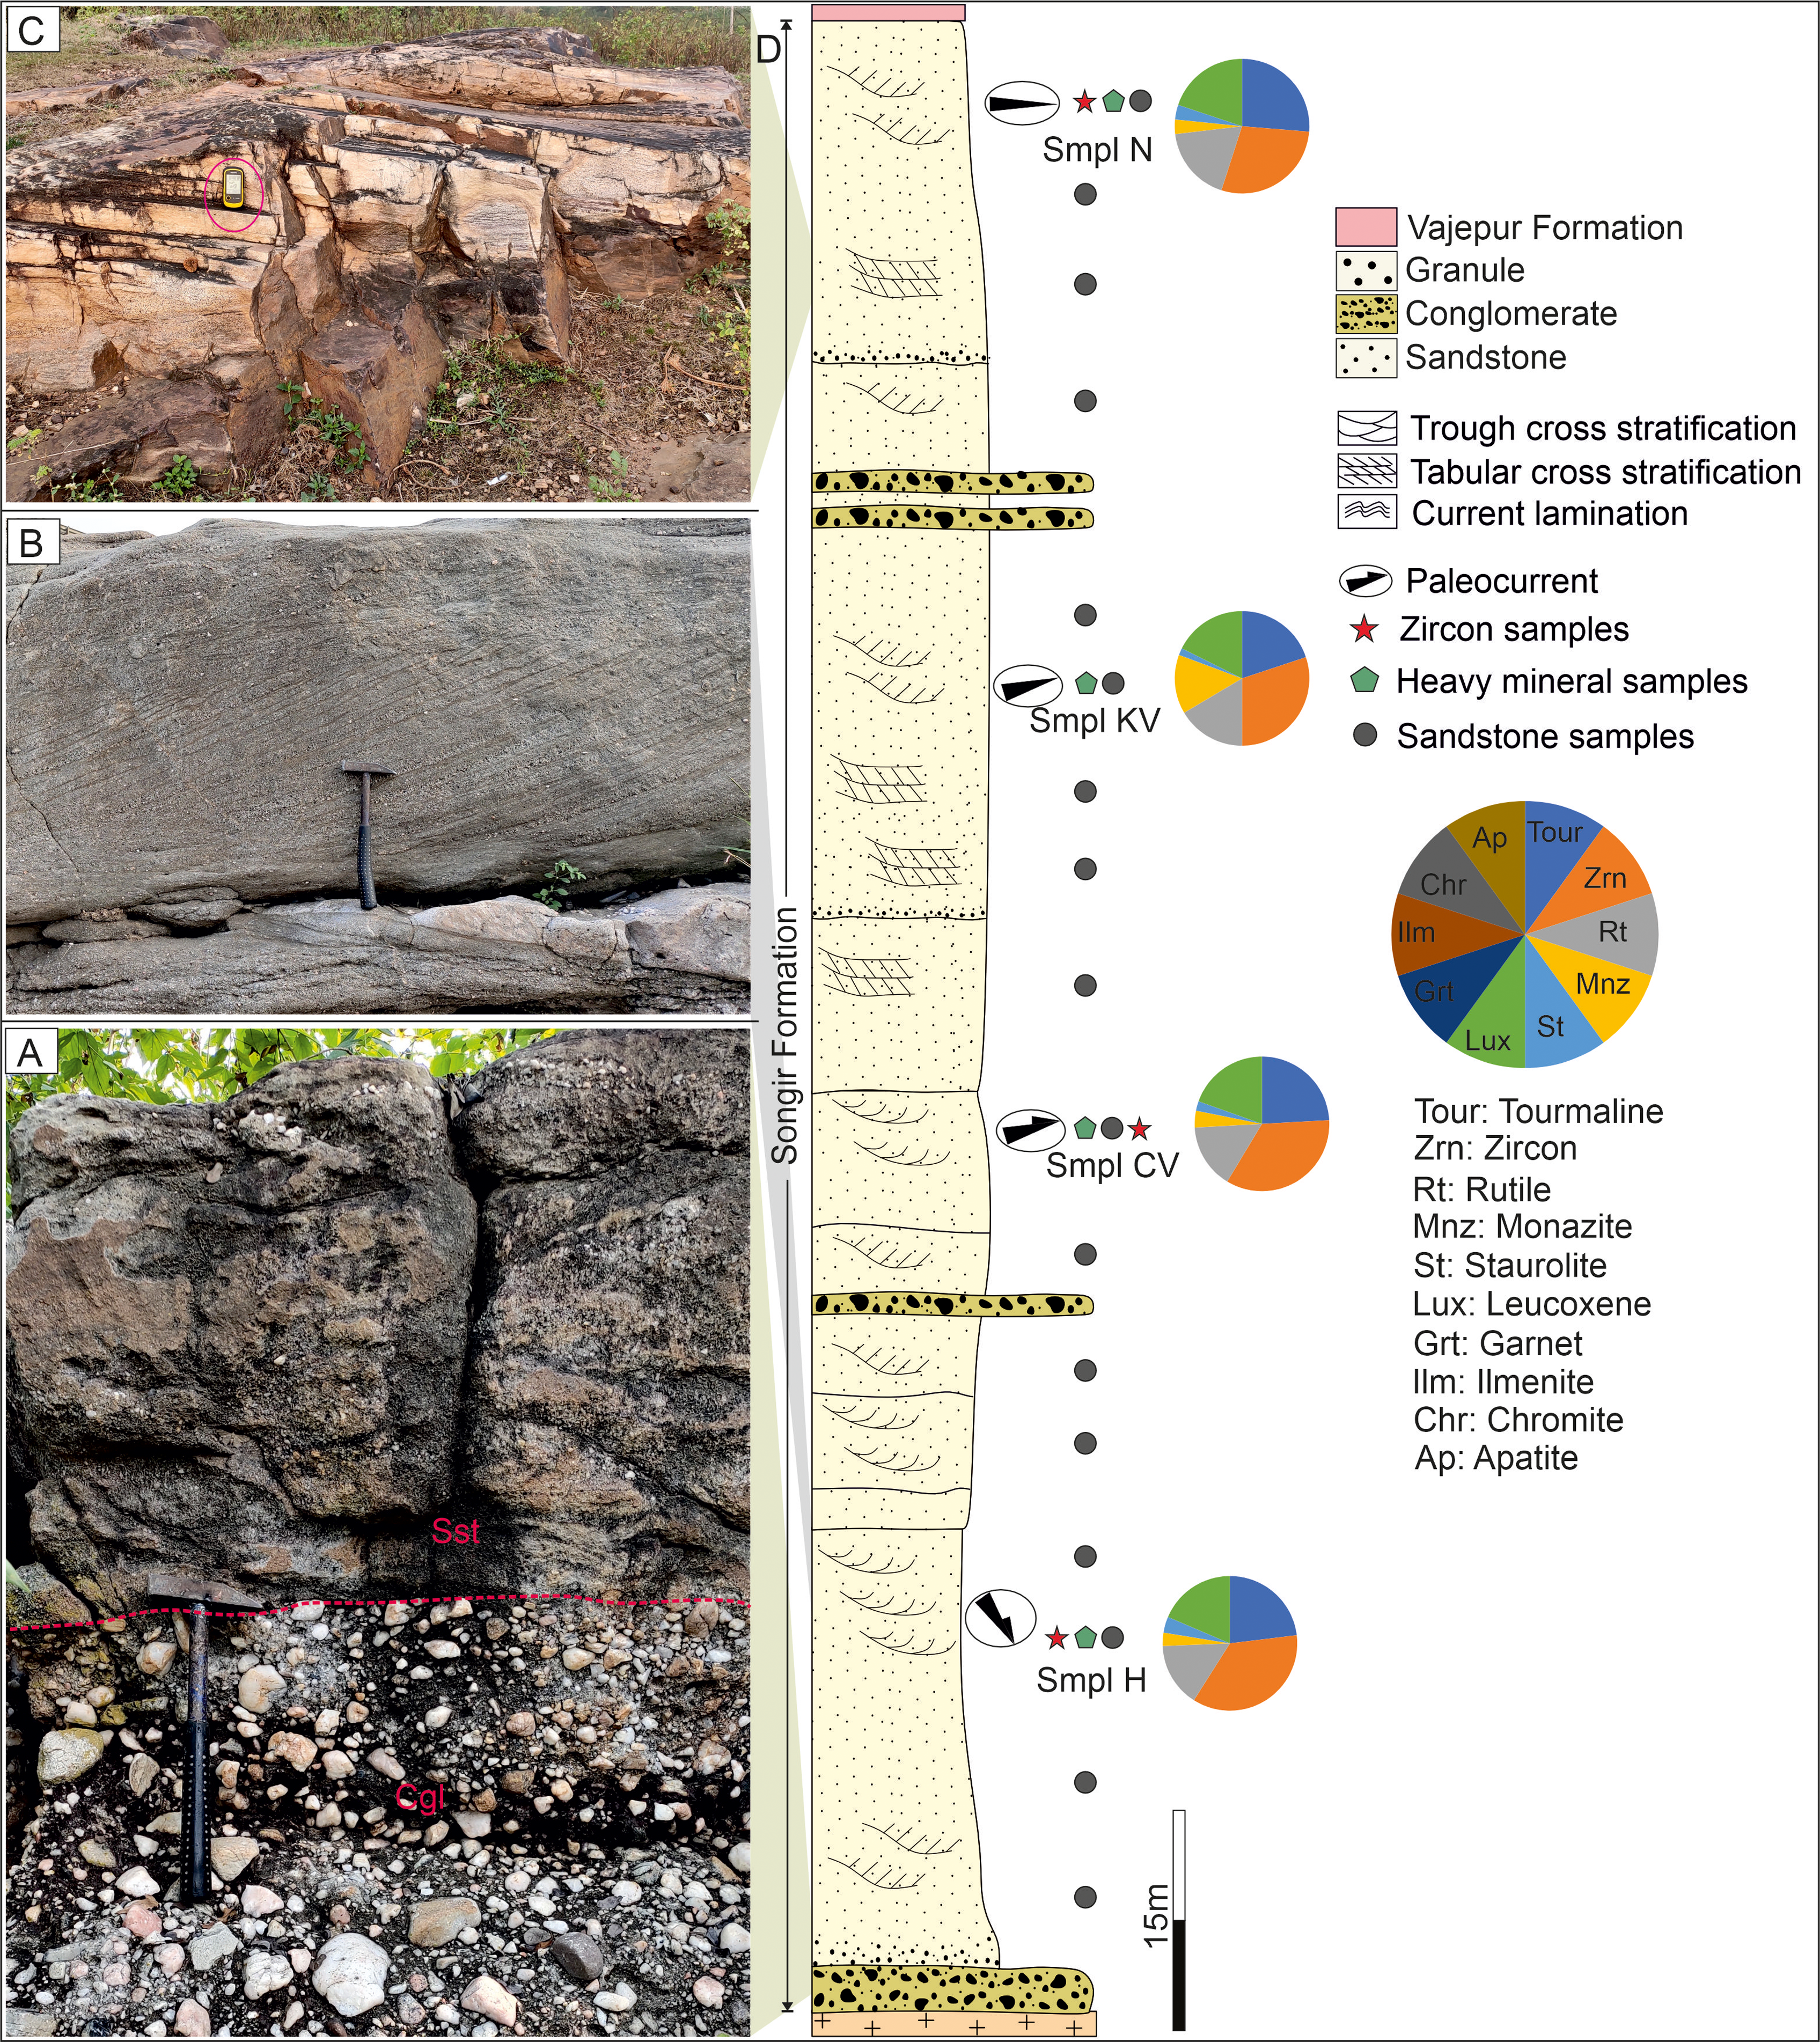
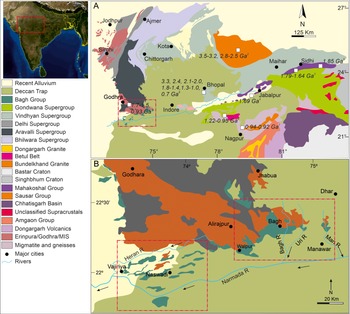
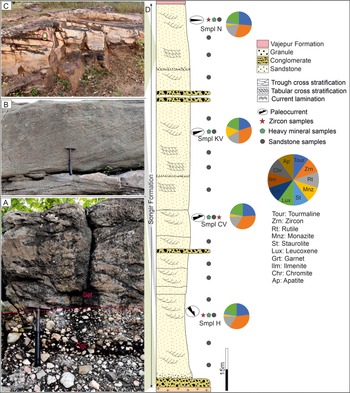
The central-west Indian shield encompasses the Archaean (the Aravalli, Bundelkhand and Dharwar cratons), the Proterozoic (the Vindhyan basin and Central Indian Tectonic Zone (CITZ)), the Mesozoic Bagh Group and the Deccan volcanic units that together record a complex tectono-magmatic-metamorphic history (Verma et al. Reference Verma, Verma, Oliveira, Singh and Moreno2016; Kaur et al. Reference Kaur, Zeh, Chaudhri and Eliyas2016; Lan et al. Reference Lan, Pandey, Zhang, Sharma, Gao and Wu2021; Biswal et al. Reference Biswal, Pradhan, Sharma, Tiwari, Beniest, Behera, Singh, Saraswati, Bhardwaj, Umasankar and Singh2022; Singh et al. Reference Singh, Rajak, Pati, Dwivedi, Pandey, Prakash, Rai and Dwivedi2022). Among these diverse geological units, the Narmada basin originated along the ENE-WSW-trending Narmada-Son transform fault and received sediments since the Cretaceous (Figure 1a; Biswas, Reference Biswas1987, Reference Biswas1999; Tripathi, Reference Tripathi2006). The Cretaceous sedimentary succession of the Narmada basin is known as the Bagh Group. The outcrops of the Bagh Group unconformably overlie the Precambrian rocks in Madhya Pradesh and Gujarat states, in places (Figure 1b; Ahmad and Akhtar, Reference Ahmad and Akhtar1990; Tripathi and Lahiri, Reference Tripathi and Lahiri2000; Tripathi, Reference Tripathi2006; Bhattacharya et al. Reference Bhattacharya, Jha and Mondal2020; Shitole et al. Reference Shitole, Patel, Darngawn and Joseph2021). The 127 m thick Songir Formation of the western Narmada basin, exposed only in the Nasvadi area, rests unconformably on the Champaner Group of the Aravalli-Delhi Fold Belt (ADFB) and is overlain by the Lameta Formation and Deccan Traps (Figure 2; Table 1; Shitole et al. Reference Shitole, Patel, Darngawn and Joseph2021). A matrix-supported conglomerate occurs at the base of the Songir Formation, which is succeeded by gravelly sandstone, fine- to coarse-grained, cross-stratified sandstones (Figure 2a–d; Ahmad and Akhtar, Reference Ahmad and Akhtar1990; Shitole et al. Reference Shitole, Patel, Darngawn and Joseph2021). The palynomorphs and floral evidence assign an Early Cretaceous age to the Songir Formation (Rajanikanth and Chinnappa, Reference Rajanikanth and Chinnappa2016). The sedimentary-facies constituting the formation suggest their deposition in a braided river (Ahmad and Akhtar, Reference Ahmad and Akhtar1990). The Songir Formation is overlain by the marine deposits of the Albian-Cenomanian-Vajepur Formation (Jafar, Reference Jafar1982; Shitole et al. Reference Shitole, Patel, Darngawn and Joseph2021).
(a) Geological map of central-western India showing the area mostly covered by the Deccan Traps (adapted from Banerjee et al. Reference Banerjee, Cogné, Sequeira and Bhattacharya2022) (the superscripts represent the references used in the compilation of ages, which are given in the Table 4), and (b) shows an enlarged view of the study area (red rectangle), highlighting the distribution of Mesozoic (Bagh Group) rocks and major Precambrian units (adapted from Shitole et al. Reference Shitole, Patel, Darngawn and Joseph2021).
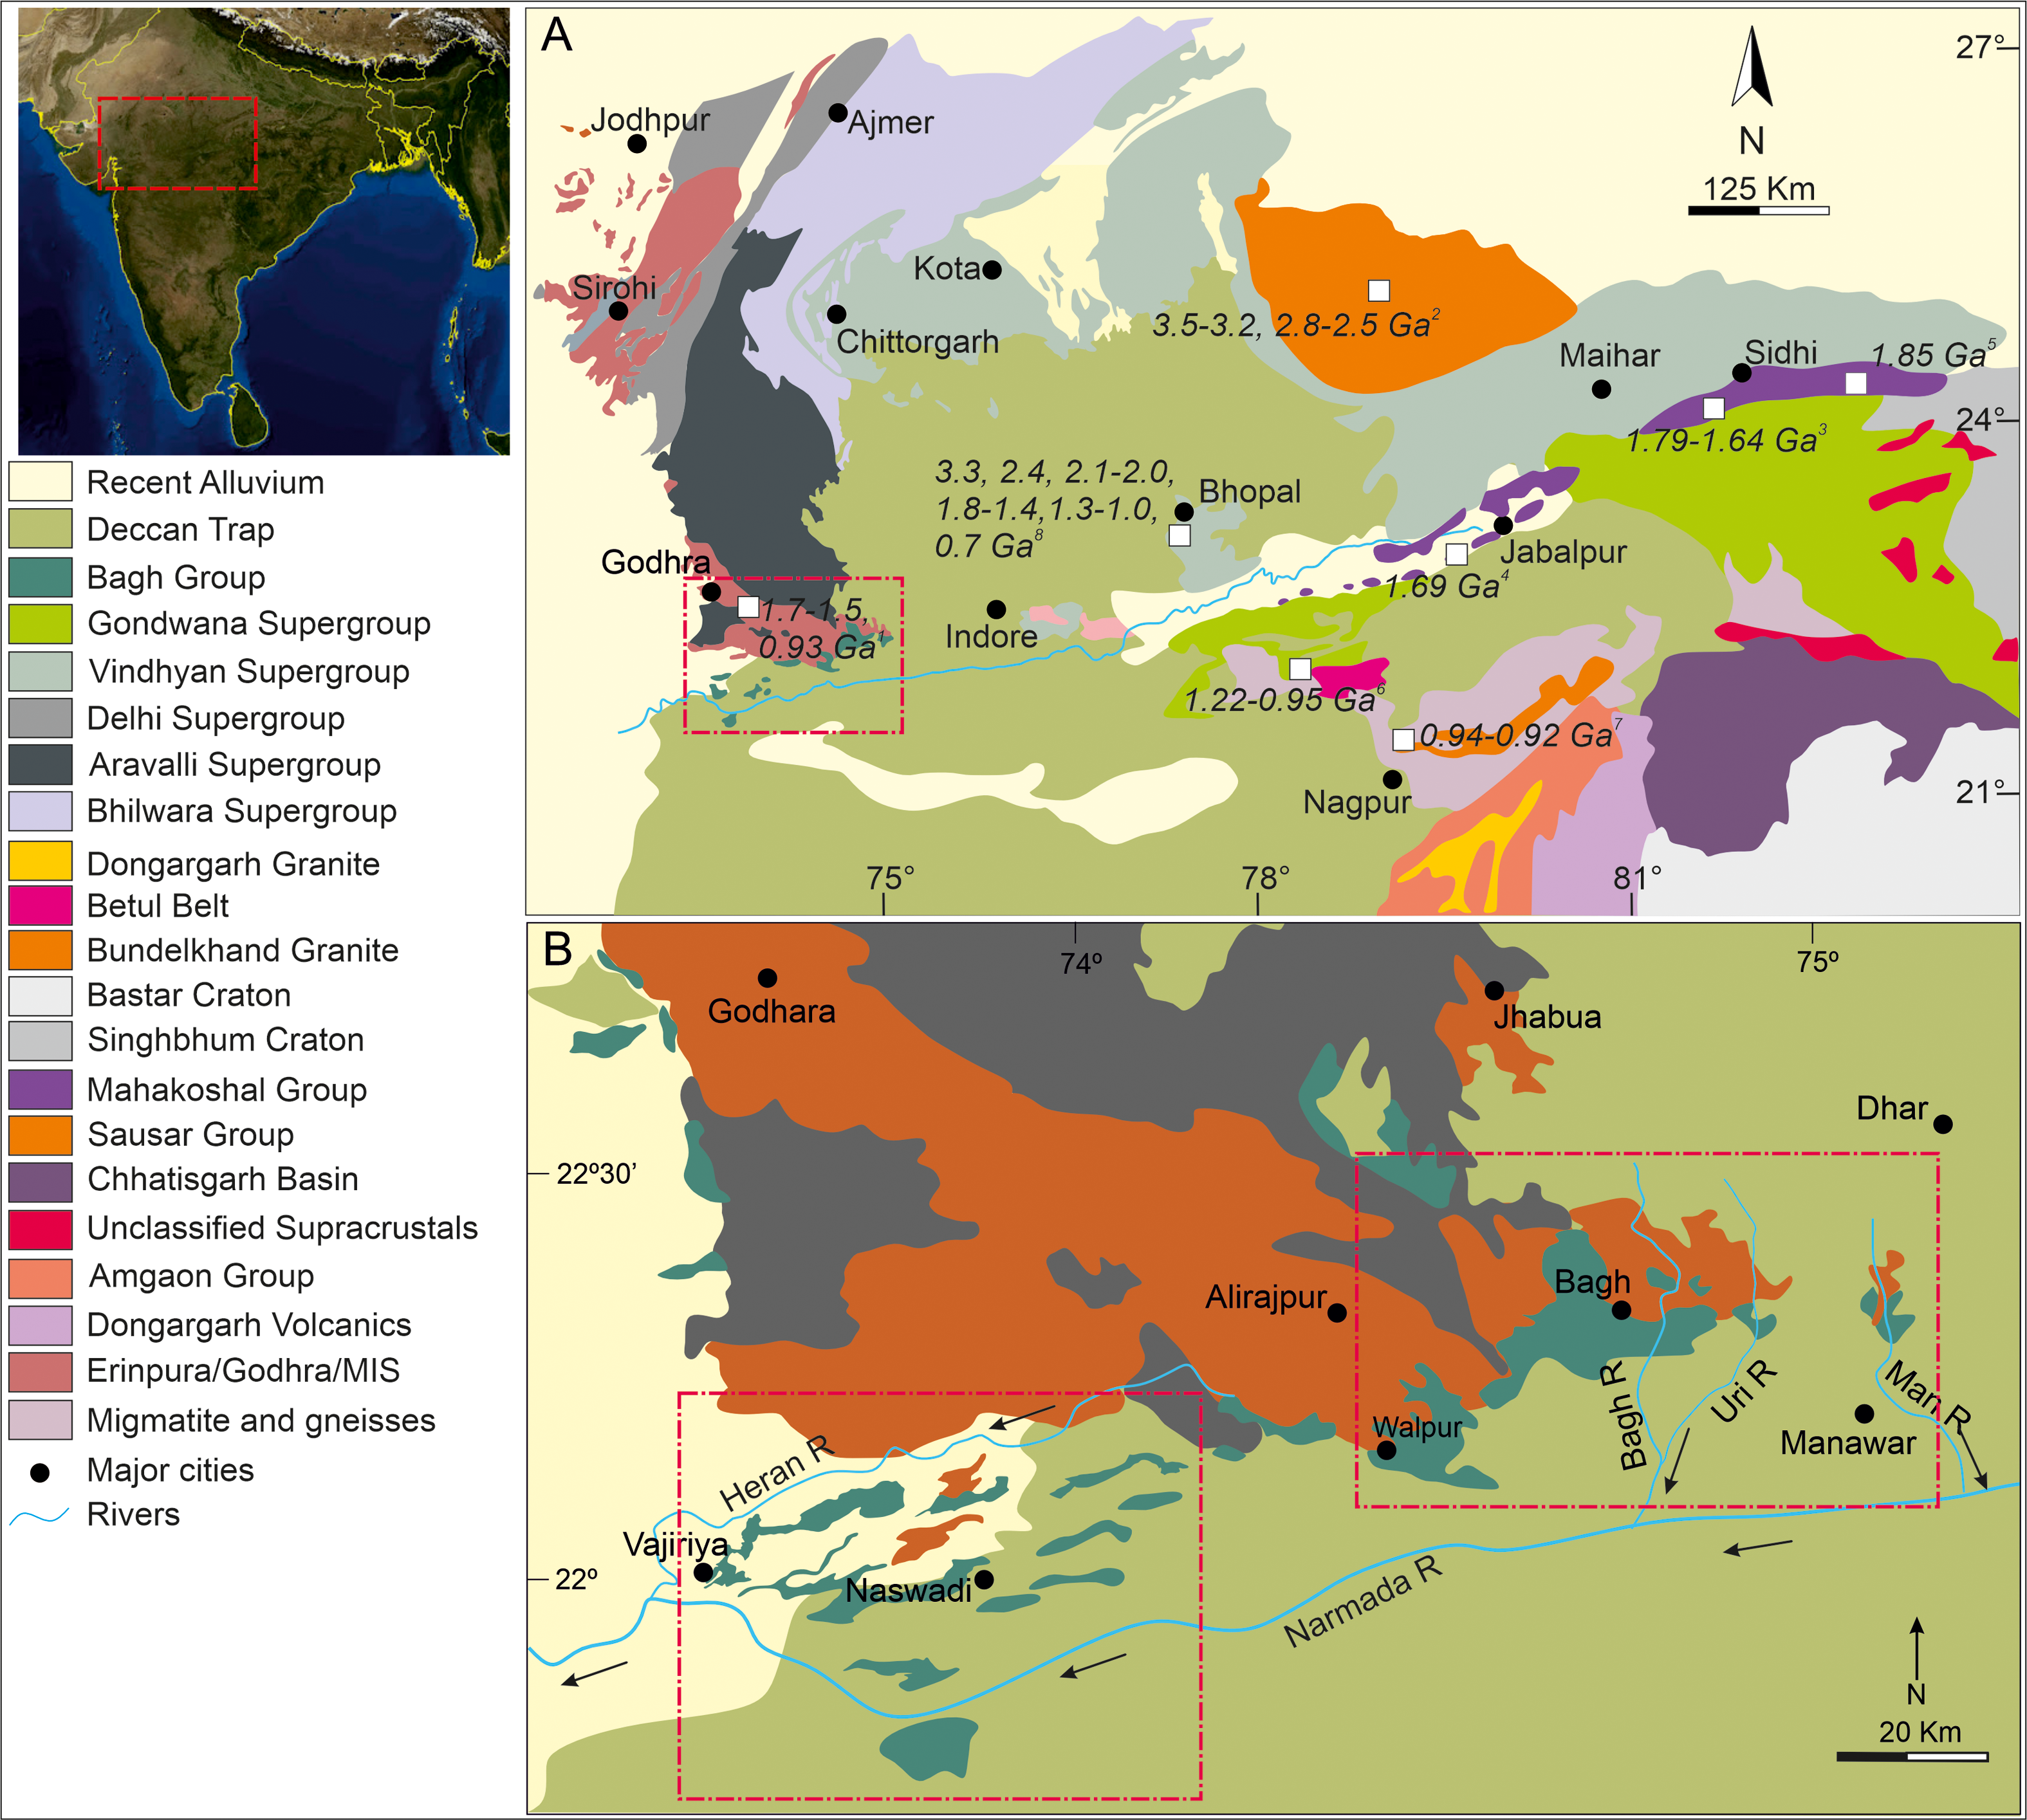
Figure 1. Long description
Panel A: A geological map of central-western India showing different geological formations. The map includes labels for major cities such as Jodhpur, Ajmer, Kota, Chittorgarh, Bhopal, Indore, Jabalpur, Nagpur, Maihar, Sidhi, and Godhra. Various geological units are color-coded, including Recent Alluvium, Deccan Trap, Bagh Group, Gondwana Supergroup, Vindhyan Supergroup, Delhi Supergroup, Aravalli Supergroup, Bhilwara Supergroup, Dongargarh Granite, Betul Belt, Bundelkhand Granite, Bastar Craton, Singhbhum Craton, Mahakoshal Group, Sausar Group, Chhatisgarh Basin, Unclassified Supracrustals, Amgaon Group, Dongargarh Volcanics, Erinpura/Godhra/MIS, and Migmatite and gneisses. The map also shows rivers and age annotations in Ga. Panel B: An enlarged view of the study area within a red rectangle, highlighting the distribution of Mesozoic Bagh Group rocks and major Precambrian units. Key locations include Godhra, Jhabua, Alirajpur, Bagh, Walpur, Vajiriya, Naswadi, Dhar, Manawar, and Heran P. The map shows the Narmada River and other rivers, with various geological units color-coded similarly to Panel A.
The sections of the Songir Formation show: (a) conglomerate at the base and cross-stratified sandstone at the Nasvadi area, (b) Cross-stratified sandstone at the Hiran River section, (c) tabular cross-bedded sandstone (hammer as a scale, hammer length = 38 cm). (d) Generalized stratigraphic litholog of the Lower Narmada basin with palaeocurrent direction (Ahmad & Akhtar, Reference Ahmad and Akhtar1990; Shitole et al. Reference Shitole, Patel, Darngawn and Joseph2021). Pie chart illustrates the distribution of heavy minerals in the formations by stratigraphic position.
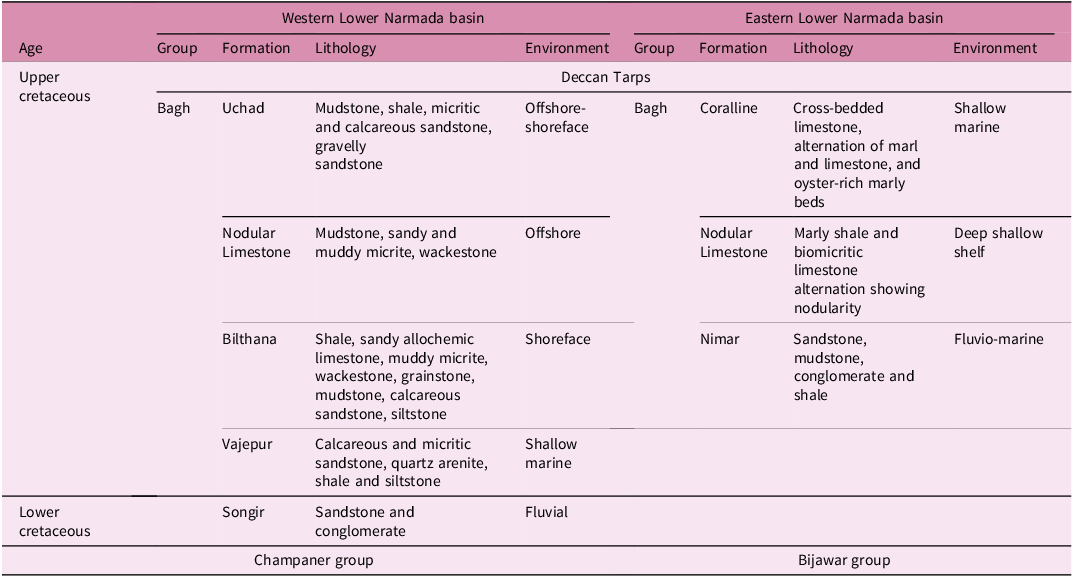
Litho-stratigraphic description of Lower Narmada Valley (Tripathi, Reference Tripathi2006; Ruidas et al. Reference Ruidas, Paul and Gangopadhyay2018; Shitole et al. Reference Shitole, Patel, Darngawn and Joseph2021)

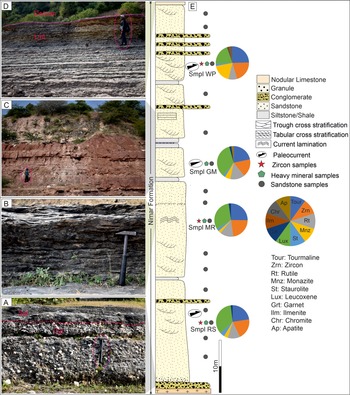
The Bagh beds of the central Narmada basin are composed primarily of marine deposits. The marine inundation occurred from the west during the Late Cretaceous (Jafar, Reference Jafar1982; Tandon, Reference Tandon2000; Bansal et al. Reference Bansal, Banerjee, Ruidas and Pande2018, Reference Bansal, Banerjee, Pande and Ruidas2020; Bhattacharya et al. Reference Bhattacharya, Jha and Mondal2020). This transgression is attributed to eustatic sea-level rise during the Late Cretaceous, which formed an epicontinental seaway in central India (Tandon, Reference Tandon2000; Keller et al. Reference Keller, Nagori, Chaudhary, Reddy, Jaiprakash, Spangenberg, Mateo and Adatte2021). The Nimar Formation, belonging to the Bagh Group, occurs only in central India and comprises ∼100 –m thick fluvio-marine deposits (Jaitly and Ajane, Reference Jaitly and Ajane2013; Bhattacharya et al. Reference Bhattacharya, Jha and Mondal2020; Kumari et al. Reference Kumari, Tandon, Kumar and Ghatak2020). The Nimar Formation unconformably overlies the Precambrian Bijawar Group, consisting of grain-supported conglomerates, cross-bedded and rippled sandstones and mudstones with rare shale layers (Figure 3a–e, Tripathi, Reference Tripathi2006; Bhattacharya et al. Reference Bhattacharya, Jha and Mondal2020). A Late Cretaceous age has been assigned to the Nimar Formation based on ichno-facies, nannofossils, ostracods and planktic foraminifera (Jafar, Reference Jafar1982; Jaitly and Ajane, Reference Jaitly and Ajane2013; Keller et al. Reference Keller, Nagori, Chaudhary, Reddy, Jaiprakash, Spangenberg, Mateo and Adatte2021). The Nimar Formation gradationally transits to nodular and coralline limestones (Figure 3d; Table 1; Jaitly and Ajane, Reference Jaitly and Ajane2013; Ruidas et al. Reference Ruidas, Paul and Gangopadhyay2018; Bansal et al. Reference Bansal, Banerjee, Pande and Ruidas2020).
Vertical sections of the Nimar Formation showing: (a) conglomerate and (b) rippled sandstone at Man river section of Nimar Formation, (c) vertical section across the Nimar Sandstone at Gayatri Mandir, Bagh area, (d) Nodular Limestone at Man river section overlain by the Deccan Traps (scale, man height = 168 cm, hammer length = 38 cm). (e) Generalized stratigraphic litholog of the Lower Narmada basin with palaeocurrent direction (Ahmad & Akhtar, Reference Ahmad and Akhtar1990; Bhattacharya et al. Reference Bhattacharya, Jha and Mondal2020). Pie chart illustrates the distribution of heavy minerals in the formations by stratigraphic position.
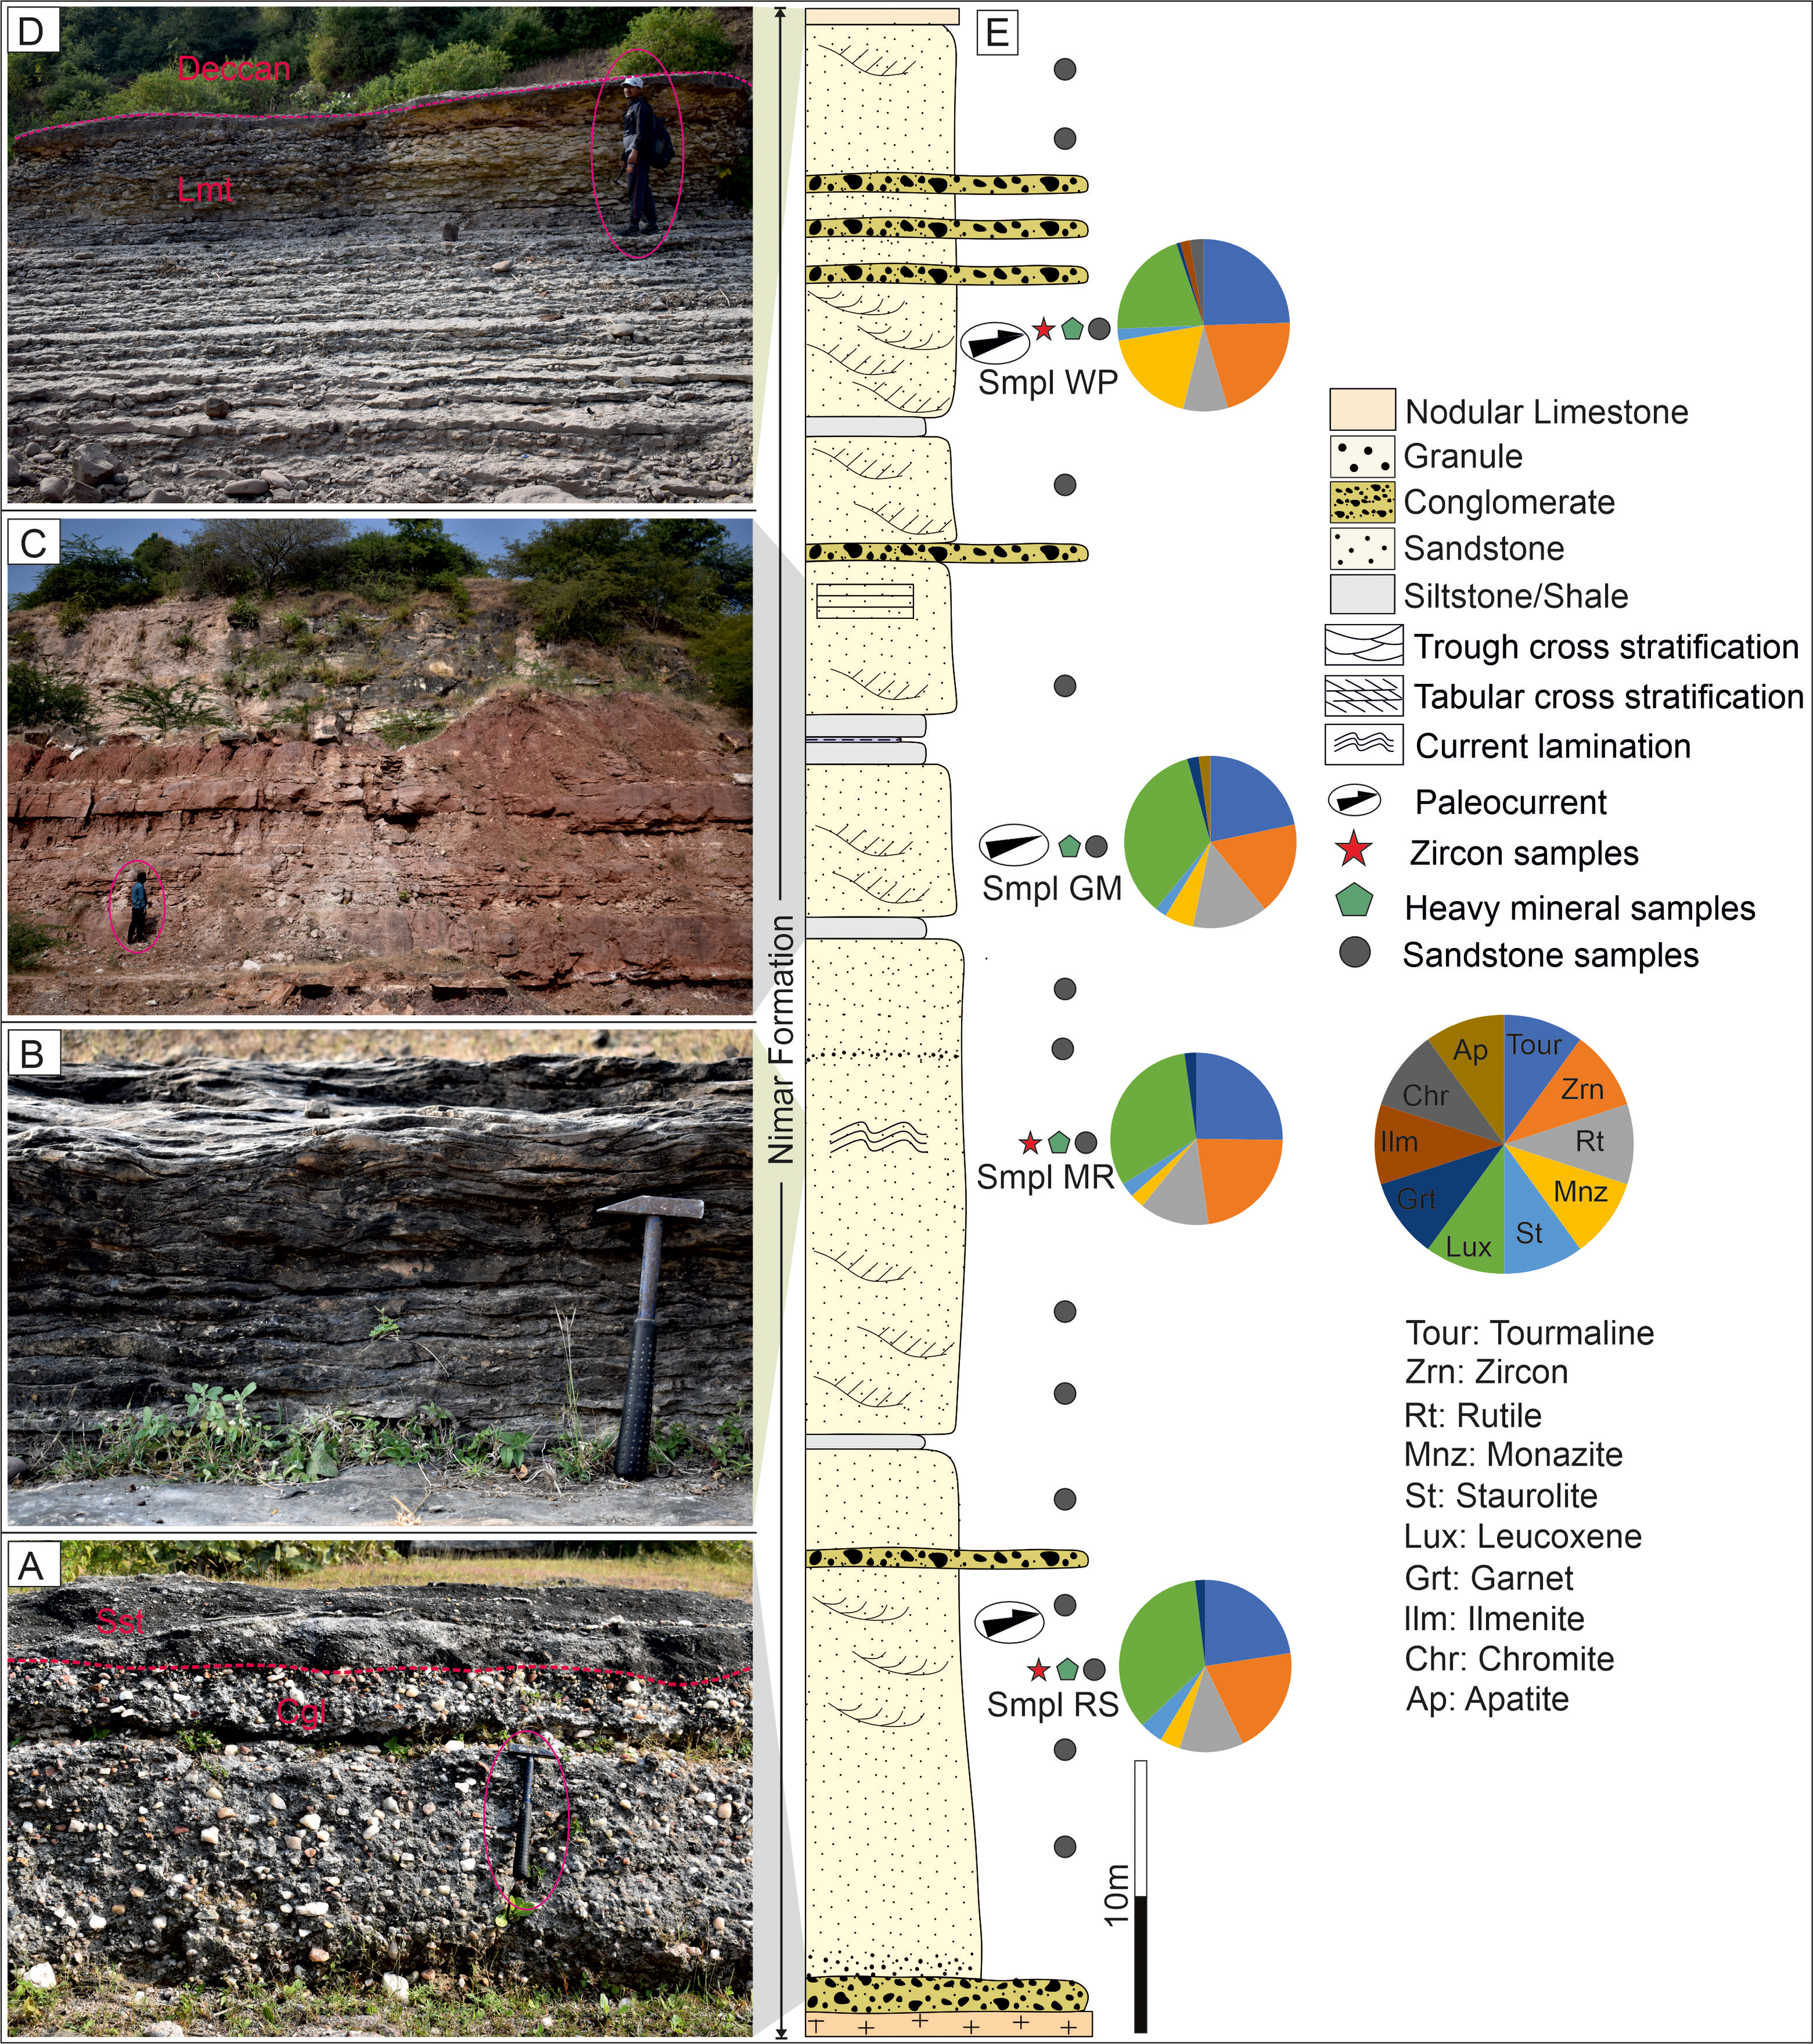
Figure 3. Long description
Panel A: A photo of a conglomerate at the Man river section of the Nimar Formation. Panel B: A photo of rippled sandstone at the Man river section of the Nimar Formation. Panel C: A photo of a vertical section across the Nimar Sandstone at Gayatri Mandir, Bagh area. Panel D: A photo of Nodular Limestone at the Man river section overlain by the Deccan Traps, with a scale showing a man’s height of 168 centimeters and a hammer length of 38 centimeters. Panel E: A diagram showing the generalized stratigraphic litholog of the Lower Narmada basin with palaeocurrent direction. The diagram includes various geological layers such as Nodular Limestone, Granule, Conglomerate, Sandstone, Siltstone/Shale, and different types of stratifications. Pie charts illustrate the distribution of heavy minerals in the formations by stratigraphic position, with labels for different minerals like Tourmaline, Zircon, Rutile, Monazite, Staurolite, Leucoxene, Garnet, Ilmenite, Chromite, and Apatite.
3. Samples and methods
The sandstone samples were collected in two different parts of both the Songir and Nimar formations (Figure 1b). The samples of the Songir Formation (n = 17) were collected from Nasvadi in the western Narmada basin. Samples of the Nimar Formation (n = 16) were collected from outcrops in the central Narmada basin around Bagh (Figure 1b). Both formations reveal predominantly sandy lithology, which in places is interrupted by thin beds of conglomerate and shale (Figures 2–3). The cross-stratified sandstones provide a predominant westerly sediment transport. The modal analysis of sandstone samples, excluding both interstitial components and pores, was carried out following the Gazzi-Dickinson method (cf. Ingersoll et al. Reference Ingersoll, Bullard, Ford, Grimm, Pickle and Sares1984). More than ∼300 framework grains were counted from each thin section, excluding interstitial components (both matrix and cements) and pores (Table 2). The compositional data, in terms of quartz (Q), feldspars (F), and rock fragments (L/R), were recalculated for the tectonic setting discriminant plot of Dickinson et al. (Reference Dickinson, Beard, Brakenridge, Erjavec, Ferguson, Inman, Knepp, Lindberg and Ryberg1983) and sandstone classification scheme of Folk (Reference Folk1980). Heavy mineral fractions were separated using sodium polytungstate solution. The heavy minerals (63–125 μm size) were identified based on their colour, texture and optical properties and were counted using the Fleet (Reference Fleet1926) method utilizing a polarizing microscope to determine their frequency distribution (Table 3). Pie charts were prepared showing heavy mineral assemblage along with sample stratigraphy (Figures 2, 3). Tourmaline grains were analysed for their major element composition by CAMECA SX-FIVE electron probe microanalyser (EPMA) at the Department of Earth Sciences, Indian Institute of Technology (IIT) Bombay.
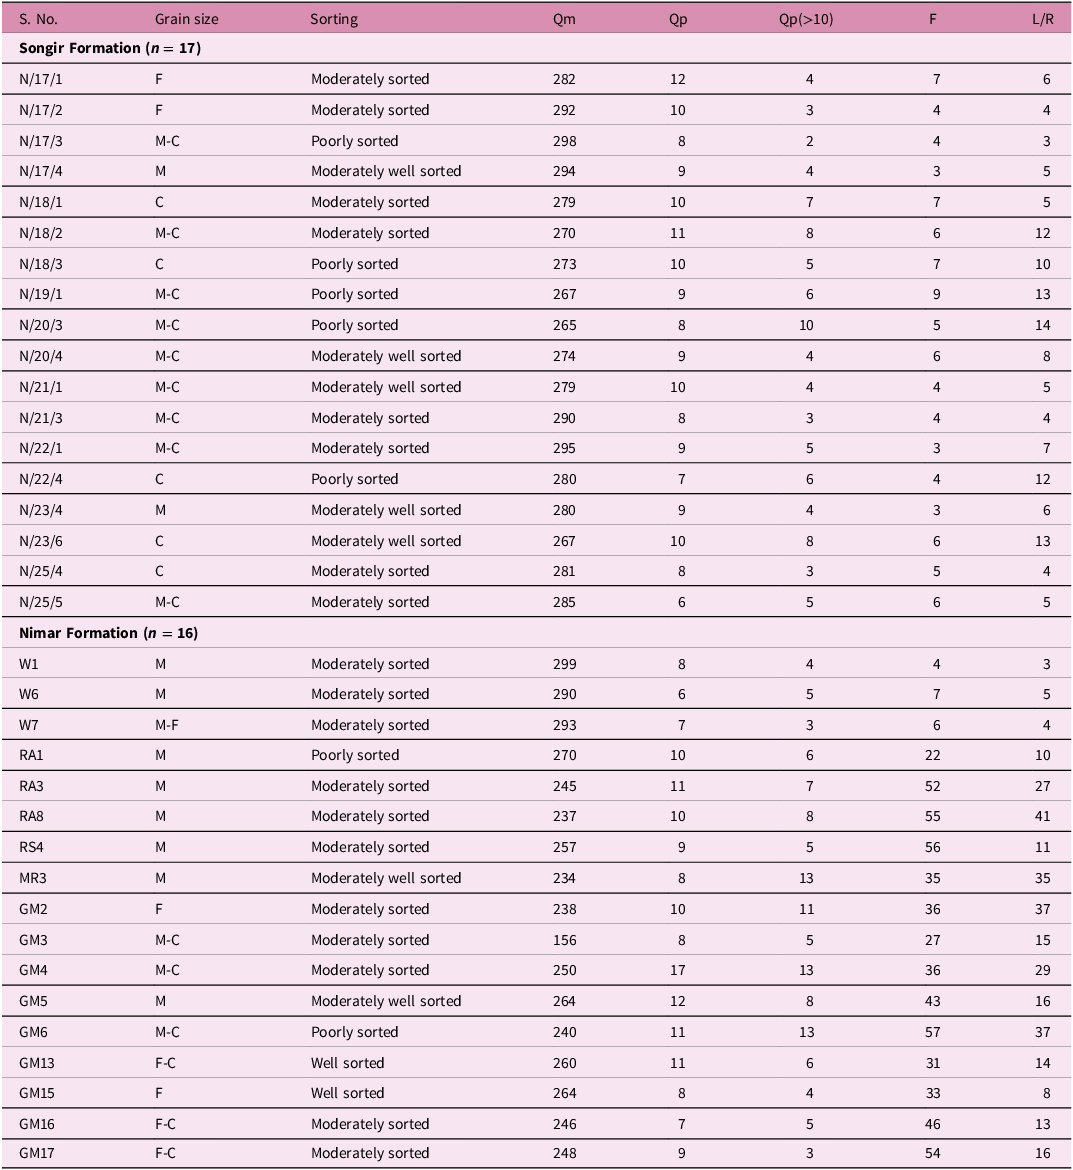
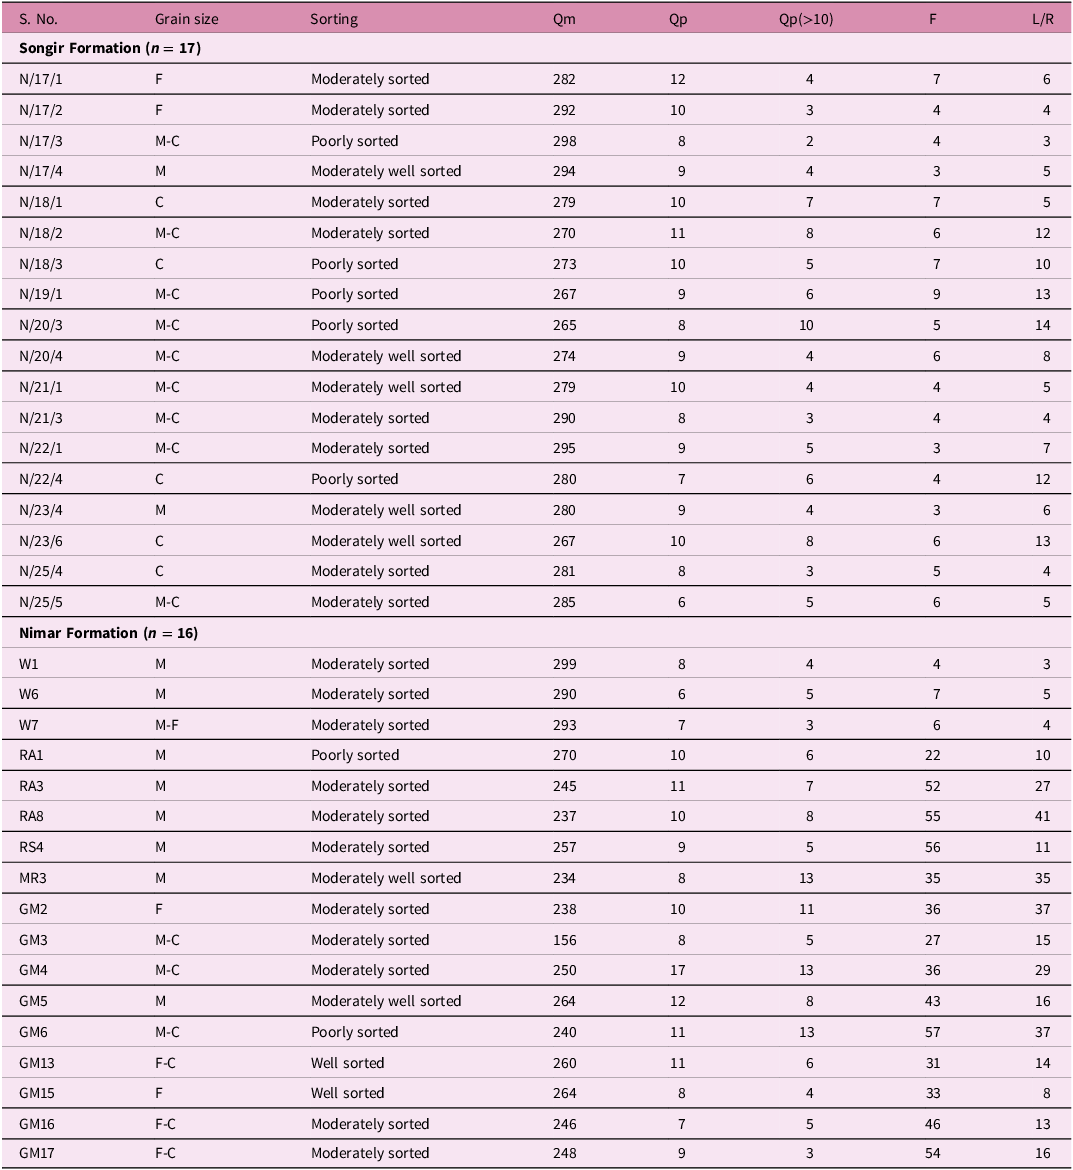
Modal analysis of the Songir and Nimar formations, Narmada basin (Qm-monocrystalline, Qp-polycrystalline, F-feldspar, L/R- rock fragment, VC-very coarse, C-coarse, M-medium, F-fine)
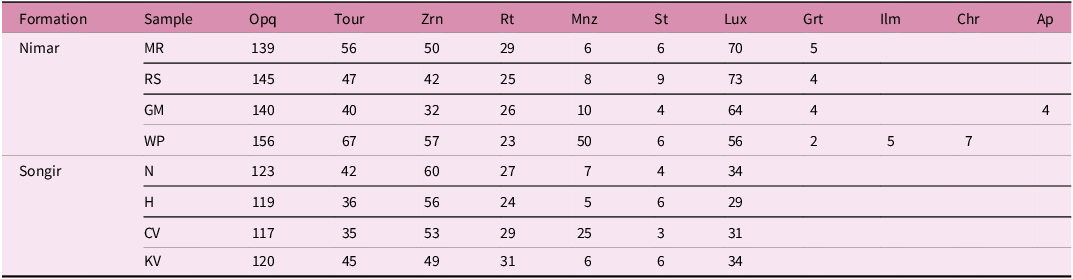
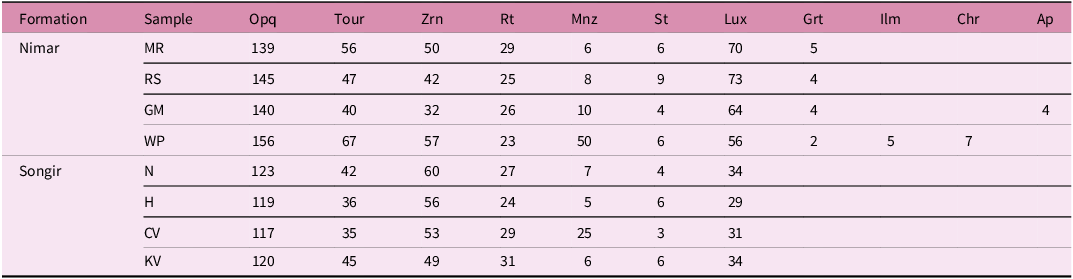
The modal analysis of heavy minerals present in the sandstones of the Nimar and Songir formations of the Narmada basin (Opq: ilmenite, magnetite, hematite, Tour: tourmaline, Zrn: zircon, Rt: rutile, Mnz: monazite, St: staurolite, Lux: leucoxene, Grt: garnet, Ilm: ilmenite, Chr: chromite, Ap: apatite)
Zircons (n = 643; 63–125 μm size) were separated from the six sandstone samples, three from each formation, embedded using epoxy resin and hardener on glass-thin sections. Back-scattered electron (BSE) and cathodoluminescence (CL) imaging of zircons was performed using a TESCAN Vega 4 scanning electron microscope (SEM) at the National Centre for Earth Science Studies (NCESS), Kerala, India. Zircon uranium-lead (U–Pb) geochronology and trace element analysis were conducted using a Teledyne CETAC Technologies, neodymium-doped yttrium aluminum garnet, (Nd:YAG) (213 nm) laser ablation system coupled with Agilent 7800 quadrupole inductively coupled plasma mass spectrometry (ICP-MS), at the Isotope Geochemistry Facility (IGF), NCESS (for detailed analytical protocol, see Dev et al. Reference Dev, Tomson, Sorcar and Nandakumar2021, Reference Dev, Tomson, Sorcar and Francis2022). The 91500-zircon standard was used as the primary reference material (1062 ± 5 Ma; Wiedenbeck et al. Reference Wiedenbeck, Alle, Corfu, Griffin, Meier, Oberli, Quadt, Roddick and Spiegel1995), whereas Plešovice (338 ± 1 Ma; Sláma et al. Reference Sláma, Košler, Condon, Crowley, Gerdes, Hanchar, Horstwood, Morris, Nasdala, Norberg and Schaltegger2008) and BB-11 zircon standards (560 ± 11 Ma; Santos et al. Reference Santos, Lana, Scholz, Buick, Schmitz, Kamo, Gerdes, Corfu, Tapster, Lancaster and Storey2017) were analysed as unknowns for quality control. During the analytical session, Plešovice and BB-11 zircon standards yielded weighted mean 206Pb/238U ages of 337.36 ± 0.4 Ma (n = 116) and 562.34 ± 0.94 Ma (n = 109), respectively. For zircon trace element analysis, NIST 610 (Pearce et al. Reference Pearce, Perkins, Westgate, Gorton, Jackson, Neal and Chenery1997) was used as the primary reference standard with 29Si (internal standard (IS) value = 14.78) as the internal standard. The detailed analytical protocol was provided by Dev et al. (Reference Dev, Tomson, Sorcar and Nandakumar2021, Reference Dev, Tomson, Sorcar and Francis2022). Data processing was carried out offline using Iolite v.4 (Paton et al. Reference Paton, Hellstrom, Paul, Woodhead and Hergt2011). The selection of ‘best age’ was made as discussed by Gehrels (Reference Gehrels2012). Ages older than 1.2 Ga were used for the 206Pb/207Pb age, and ages less than 1.2 Ga were used for the 206Pb/238U age. The Concordia diagram was used to investigate and interpret disruptions of the U–Pb system caused by ‘lead loss’ and to plot the 206Pb/238U and 207Pb/235U ratios. Grains >90% concordance were used to plot the Concordia curve, kernel density estimates, cumulative age distributions and multi-dimensional scaling (MDS) plot using IsoplotR (Vermeesch, Reference Vermeesch2018). The cumulative distribution function (CDF) plots provide a statistical distribution of zircon U–Pb ages across samples and possible sources. Furthermore, MDS plots were also used to visualize the level of similarity between the sample and sources. The closely associated samples are joined by a strong continuous line, whereas those indirectly associated are joined by a dashed line.
4. Results
4.a. Sandstone petrography and heavy mineral investigation
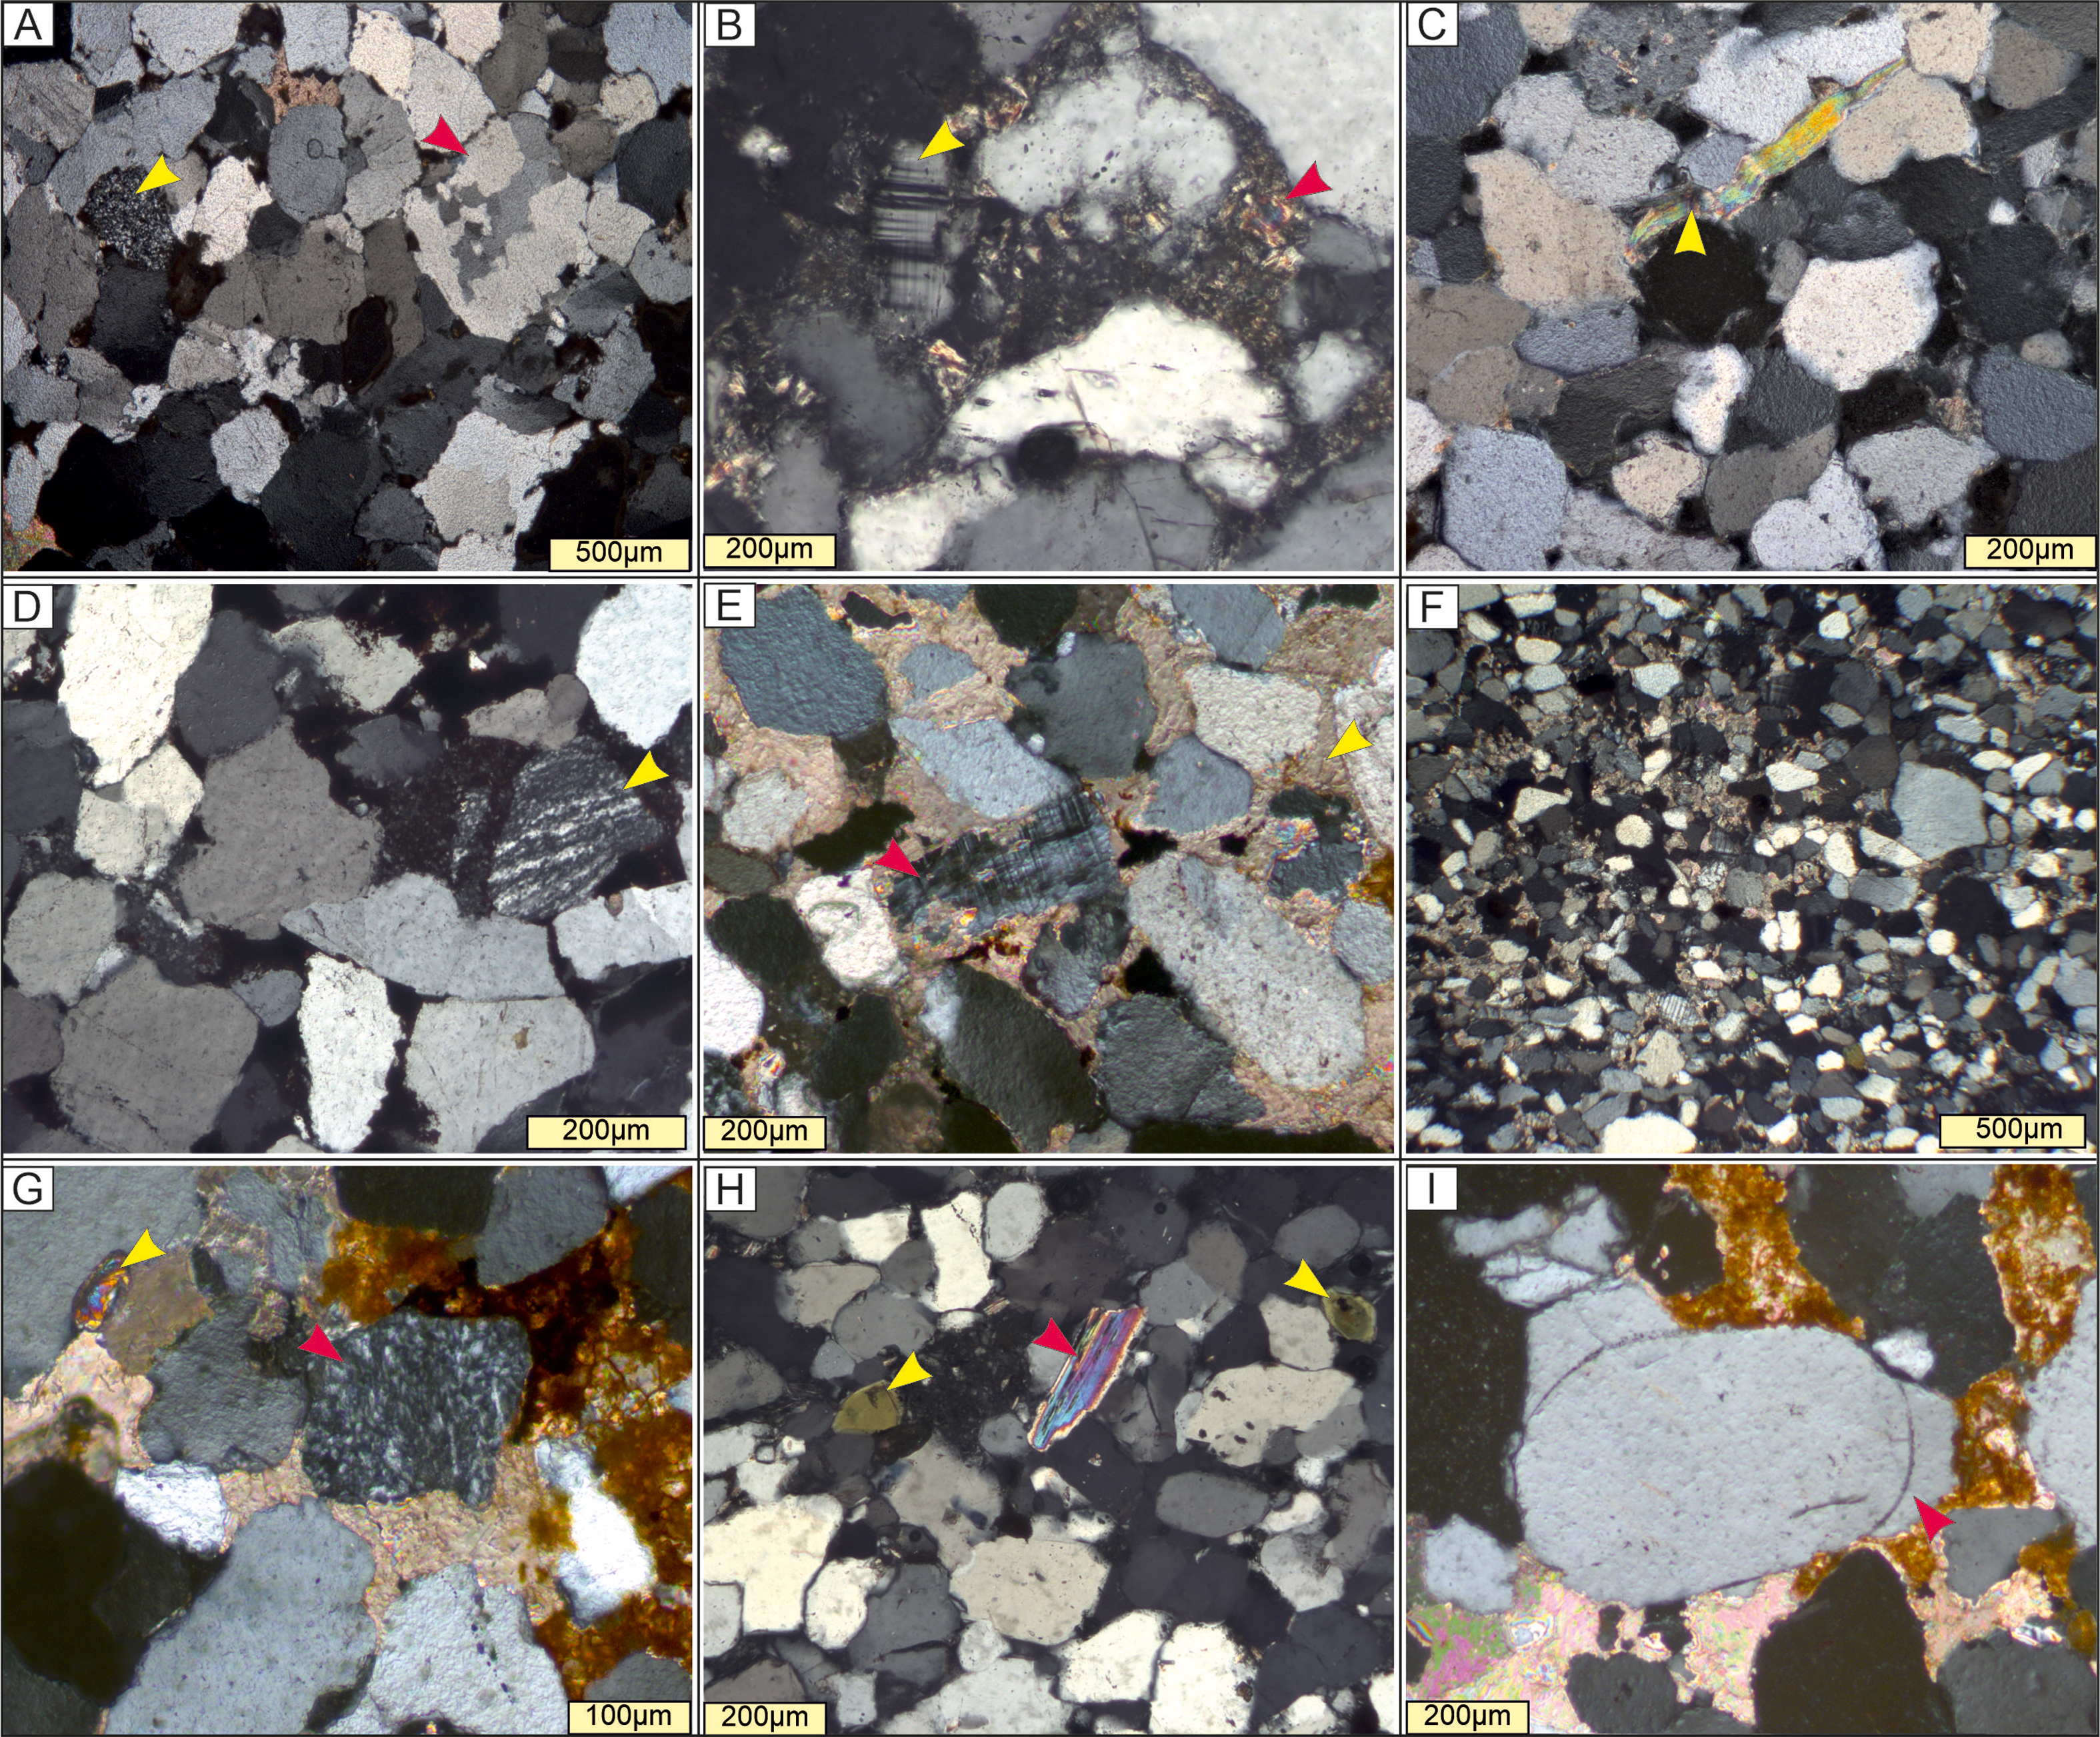
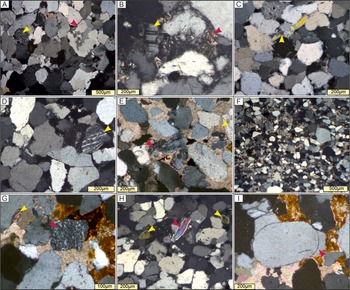
The Songir sandstones (n = 17) comprise coarse- to medium-grained, moderately sorted, subrounded to subangular framework grains. The monocrystalline quartz (Qm) grains dominate the sandstone (85% by volume) (Table 2; Figure 4a). Orthoclase feldspar grains exceed microcline feldspar (Figure 4b). A few feldspar grains (F) are altered partially, forming pseudomatrix in places (Figure 4b). Rock fragments (L/R) include chert and gneiss (Figure 4a, d, g). Iron oxide and quartz are common cement types. The Nimar sandstones (n = 16) are composed of medium- to fine-grained, moderately to poorly sorted, subangular to angular framework grains (Figure 4). The monocrystalline quartz grains (∼77% by volume) are dominant along with feldspar (∼10% by volume) and rock fragments (∼7% by volume) (Table 2; Figure 4). Although orthoclase is also present in the sandstones, feldspar is primarily microcline (Figure 4e). The sedimentary rock fragments include chert (6% by volume), which dominates over the metamorphic rock fragments (1% by volume). Metamorphic rock fragments include quartzite and gneissic rocks. Iron oxide, carbonate and siliceous cement are types of cement (Figure 4g, i). Abraded quartz overgrowths are common in the formation (Figure 4i) along with some feldspar grains replaced by carbonate cement. The average sandstone compositions of the Songir and Nimar formations are Q92F5R3 and Q86F11R3, respectively. Songir and Nimar sandstones lie within subarkose and quartz arenite fields within the Q=quartz, F=feldspar, R=rock fragments (QFR) plot of Folk (Reference Folk1980). The data indicate sand supply from craton interior and recycled orogeny tectonic settings in the Qm=quartz monocrystalline, F=feldspar, L=rock fragments (QmFL) diagram (Figure 5a–b; Dickinson et al. Reference Dickinson, Beard, Brakenridge, Erjavec, Ferguson, Inman, Knepp, Lindberg and Ryberg1983).
The petrographic study of the sandstones from the Narmada basin shows: (a) quartzarenite with polycrystalline quartz and chert, (b) microcline feldspar and pesudomatrix, (c) muscovite, (d) gneissic rock fragment, (e) carbonate cement replacing microcline, (f) fine-grained sandstone, (g) rounded zircon and chert, (h) muscovite and greenish tourmaline and (I) detrital quartz overgrowth grain (A–D: the Songir Formation, and E–I: the Nimar Formation).
(a) QFR plot for formations (adapted from Folk, Reference Folk1980), (b) QmFL tectonic setting diagram of formations (adapted from Dickinson et al. Reference Dickinson, Beard, Brakenridge, Erjavec, Ferguson, Inman, Knepp, Lindberg and Ryberg1983) (Q = quartz, Qm = quartz monocrystalline, F = feldspar, L/R = rock fragments). (c) Plot of Na/(Na+Ca) vs Mg/(Mg+Fe) for the tourmalines from the Songir and Nimar formations. The coloured magmatic and hydrothermal origin tourmalines are shown for comparison (Zheng et al. Reference Zheng, Chen, Palmer, Zhao, Hernández-Uribe, Gao and Wu2024). The pie chart shows the contribution of tourmaline (%) from magmatic and metamorphic sources. (d) The ternary Ca-Fetot-Mg plot (molecular proportion) shows the source rock characteristics of tourmalines (Henry & Guidotti, Reference Henry and Guidotti1985). The numbered fields in the ternary Ca-Fetot-Mg plot represent different rock types: (1) Li-rich granitoid pegmatites and aplites, (2) Li-poor granitoids and associated pegmatites and aplites, (3) Ca-rich metapelites, metapsammites and calc-silicate rocks, (4) Ca-poor metapelites, metapsammites and quartz-tourmaline rocks, (5) metacarbonates and (6) metaultramafics. The coloured field adopted from Ghosh et al. (Reference Ghosh, Upadhyay, Abhinay and Mishra2021) and Gorania et al. (Reference Gorania, Akolkar, Joshi, Limaye and Singh2024) is shown for the tourmaline comparison.
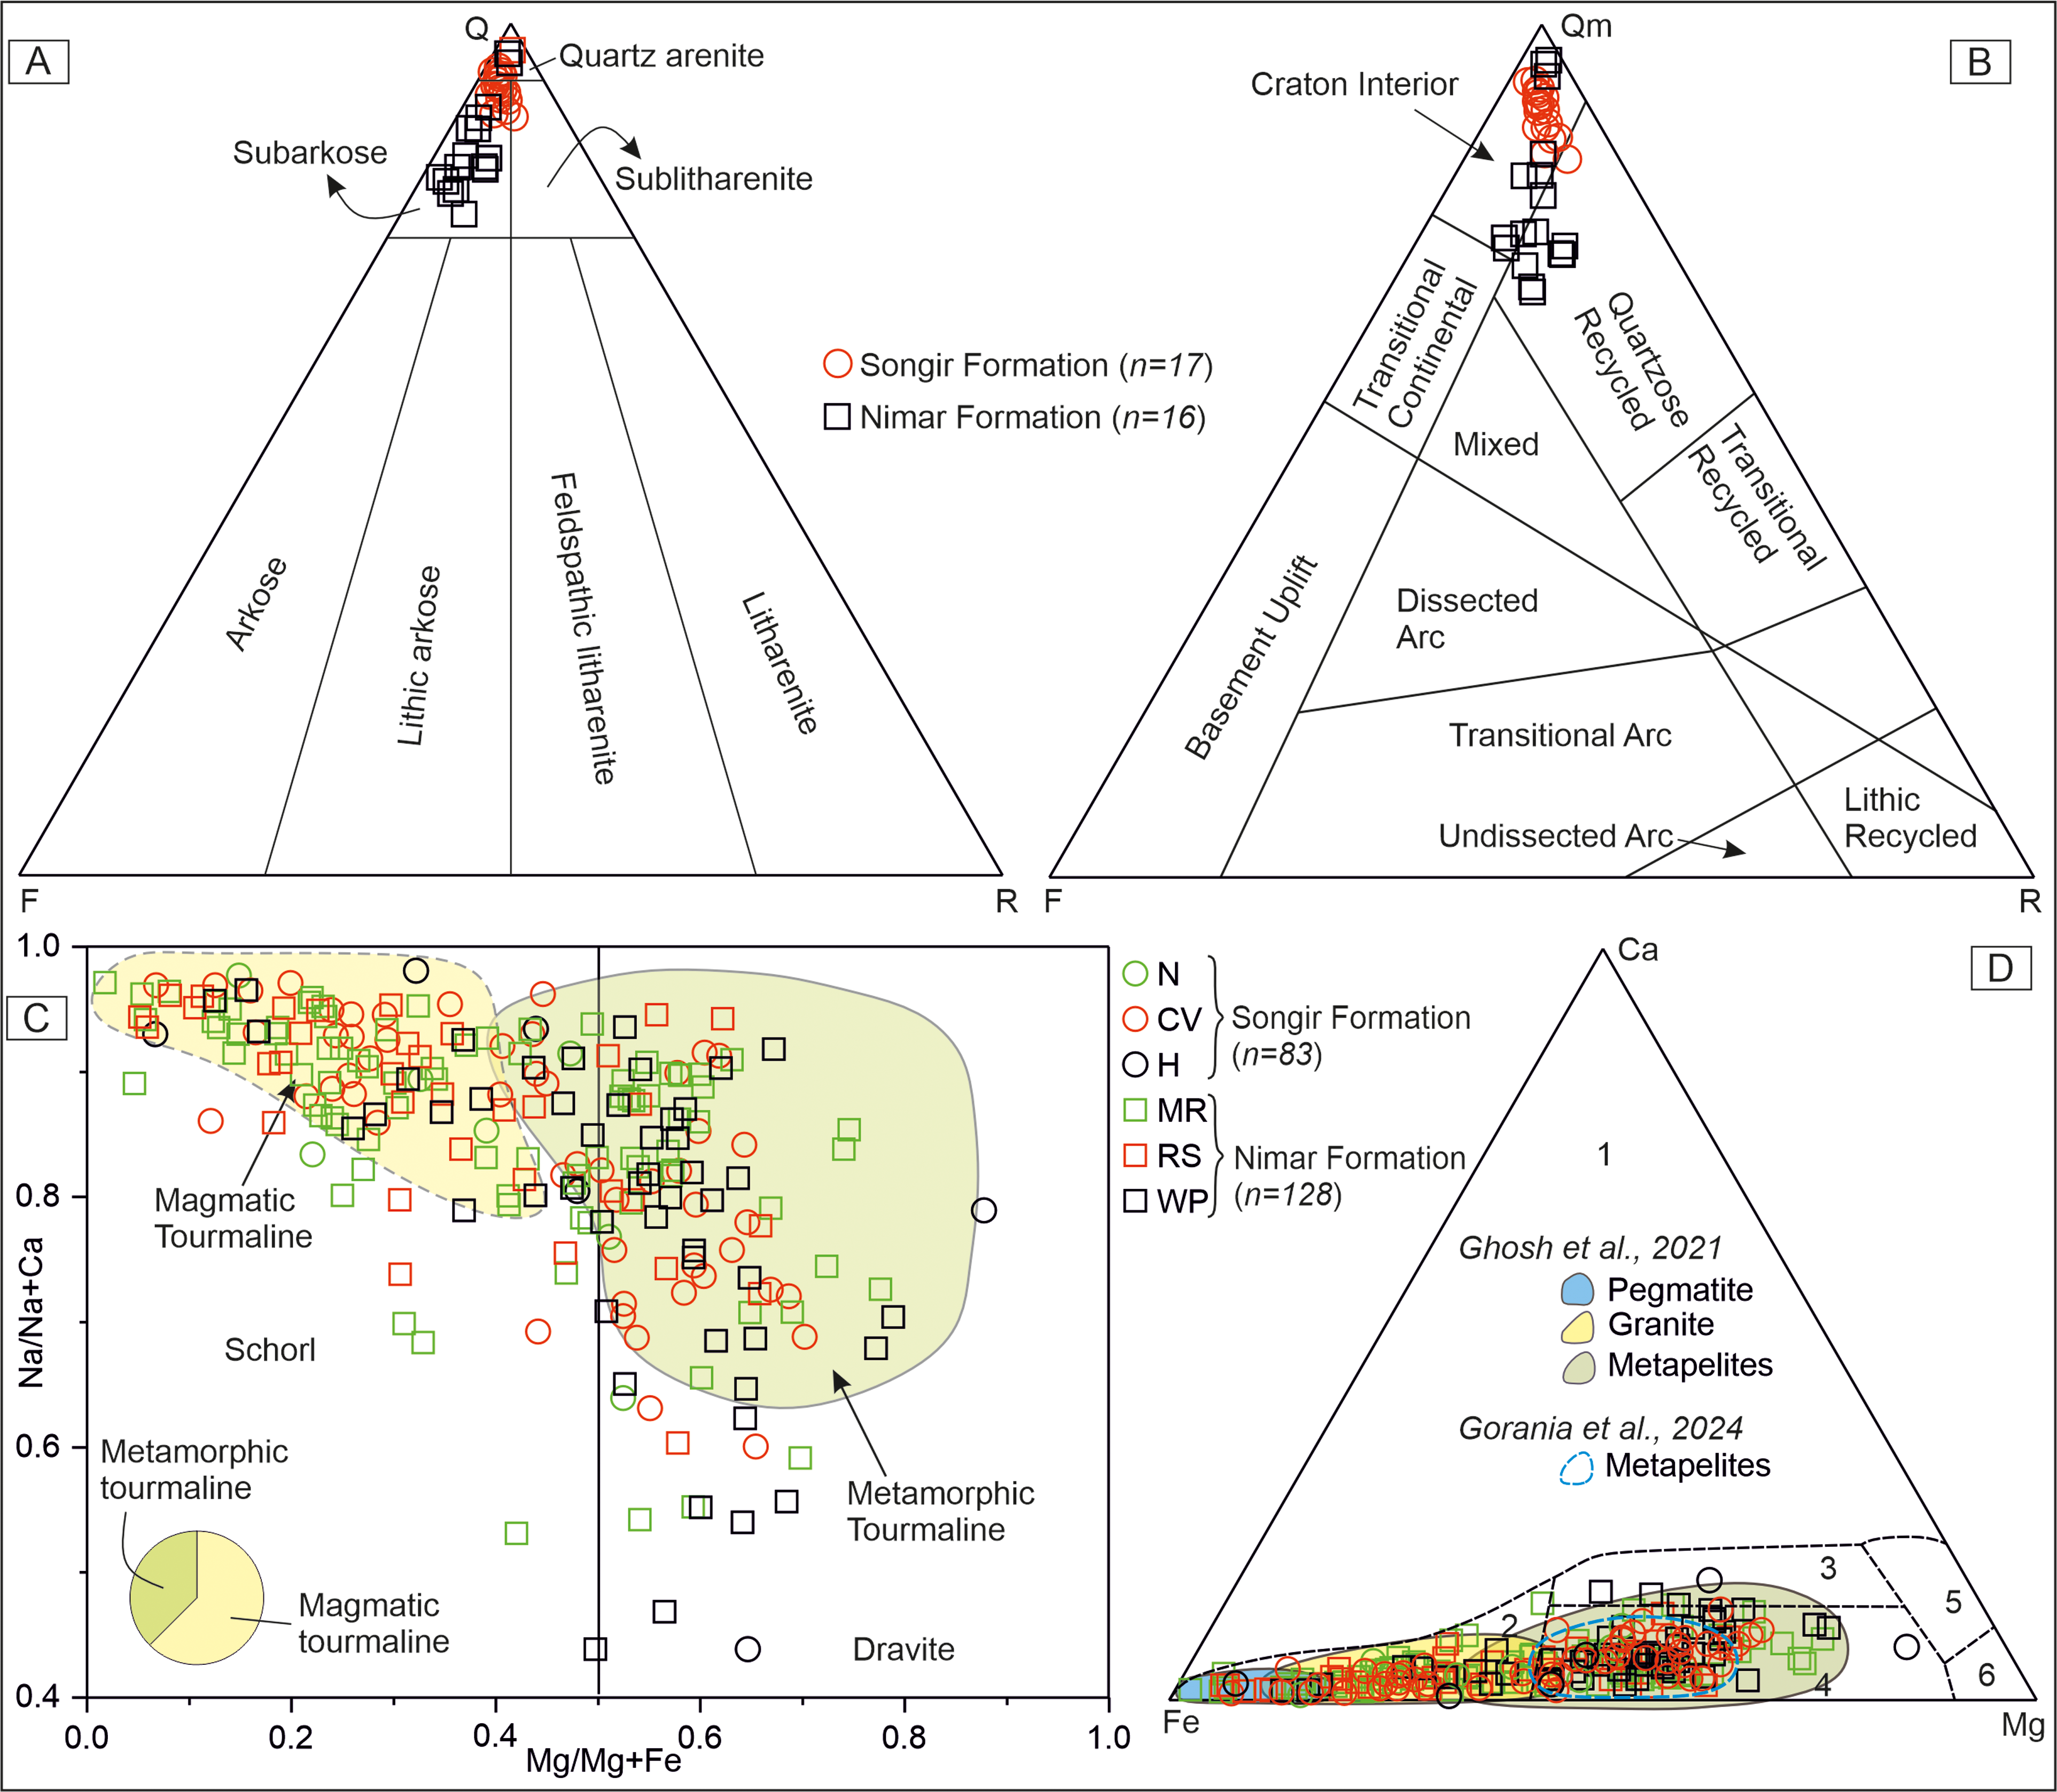
Figure 5. Long description
Panel A: A ternary diagram labeled QFR plot for formations. The axes are labeled Q, F, and R, representing quartz, feldspar, and rock fragments respectively. The diagram includes data points for the Songir Formation and Nimar Formation, with different symbols representing each formation. Panel B: A ternary diagram labeled QmFL tectonic setting diagram of formations. The axes are labeled Qm, F, and L/R, representing quartz monocrystalline, feldspar, and rock fragments respectively. The diagram includes data points for the Songir Formation and Nimar Formation, with different symbols representing each formation. Panel C: A scatter plot labeled Plot of Na/(Na+Ca) vs Mg/(Mg+Fe) for the tourmalines from the Songir and Nimar formations. The x-axis is labeled Mg/(Mg+Fe) and the y-axis is labeled Na/(Na+Ca). The plot includes data points for the Songir Formation and Nimar Formation, with different symbols representing each formation. A pie chart shows the contribution of tourmaline from magmatic and metamorphic sources. Panel D: A ternary diagram labeled Ca-Fe-Mg plot. The axes are labeled Ca, Fe, and Mg, representing molecular proportions. The diagram includes data points for the Songir Formation and Nimar Formation, with different symbols representing each formation. The numbered fields represent different rock types.
The heavy mineral assemblage in sandstone varies across the formations (Figures 2 and 3). Four sandstone samples from each formation were studied for the heavy mineral assemblage. The heavy minerals in sandstones of the Songir Formation (n = 4) contain tourmaline, zircon, rutile, leucoxene, staurolite and monazite, along with opaques, whereas heavy minerals in Nimar sandstones (n = 4) include tourmaline, rutile, zircon, leucoxene, monazite, garnet, ilmenite and chromite. Subrounded to rounded tourmaline grains exhibit bluish, brownish, reddish-brown and greenish hues (Figure 4h). Rutile grains are reddish-brown and deep red, with subangular and subrounded morphologies. Zircon occurs as euhedral to rounded grains, which are almost colourless, with rare inclusions (Figure 4g). Staurolite grains are colourless, yellowish brown and pale brown, with subrounded to rounded morphologies. The content of opaque heavy minerals decreases towards the western side of the basin (see Table 3). The Songir Formation exhibits a higher concentration of tourmaline, rutile and zircon compared with the Nimar Formation. Conversely, the monazite content in the Songir Formation is significantly lower than that of the Nimar Formation. Furthermore, garnet, chromite, ilmenite and apatite are rarely encountered in the Nimar Formation, whereas they are absent in the Songir Formation.
4.b. Detrital tourmaline geochemistry
The mineral chemical data of 212 tourmaline grains from Songir and Nimar sandstones exhibit significant variation in their major oxide contents (Supplementary Data 1). Most tourmalines reveal an even distribution between magmatic and metamorphic sources on the Mg/(Mg+Fe) vs. Na/(Na+Ca) plot. In the same plot, tourmalines of the Nimar Formation from the Walpur (WP) area mostly belong to dravite of metamorphic origin (Figure 5c). Dravite tourmaline demonstrates a greater variability in Mg/(Mg+Fe) ratios compared with the schorl variety (Figure 5c). The Ca–Fe–Mg triangular plot illustrates the composition of tourmaline that has crystallized from various rock types (Henry and Guidotti, Reference Henry and Guidotti1985). The tourmaline data points are mostly located in the lower portion of the Ca–Fe–Mg triangular plot. Except for a few data points, most tourmalines are evenly distributed in fields 2 and 4, suggesting a predominantly granitic and pegmatitic (Type-2) as well as metapelitic (Type-4) origin (Figure 5d). The tourmaline data points of sample WP mostly occupy the metapelites (Type-4) field (Figure 5d).
4.c. Detrital U–Pb zircon geochronology
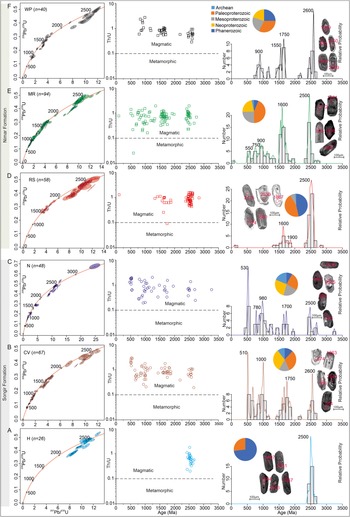
Detrital zircon U–Pb data of six samples (n = 613) were used to understand the provenance and maximum depositional age of the Songir and Nimar formations (Supplementary Data 2). The sample Hiran River (H) was collected from the western Narmada basin. In this sandstone, 126 zircon grains were analysed, of which 26 grains exhibit more than 90% concordance, with Th/U ratios ranging from 0.20 to 1.73. The U–Pb age spectrum shows 73% contribution from Archaean zircons (2656 to 2500 Ma), with a peak around 2600 Ma. Approximately, 27% of the zircon ages belong to Palaeoproterozoic (2497–2413 Ma) (Figure 6a).
Concordia plot, relative age population density plots for the analysed samples from the Narmada basin. The Th/U ratios of the zircon suggest magmatic origin (Belousova et al. Reference Belousova, Griffin, O’Reilly and Fisher2002).
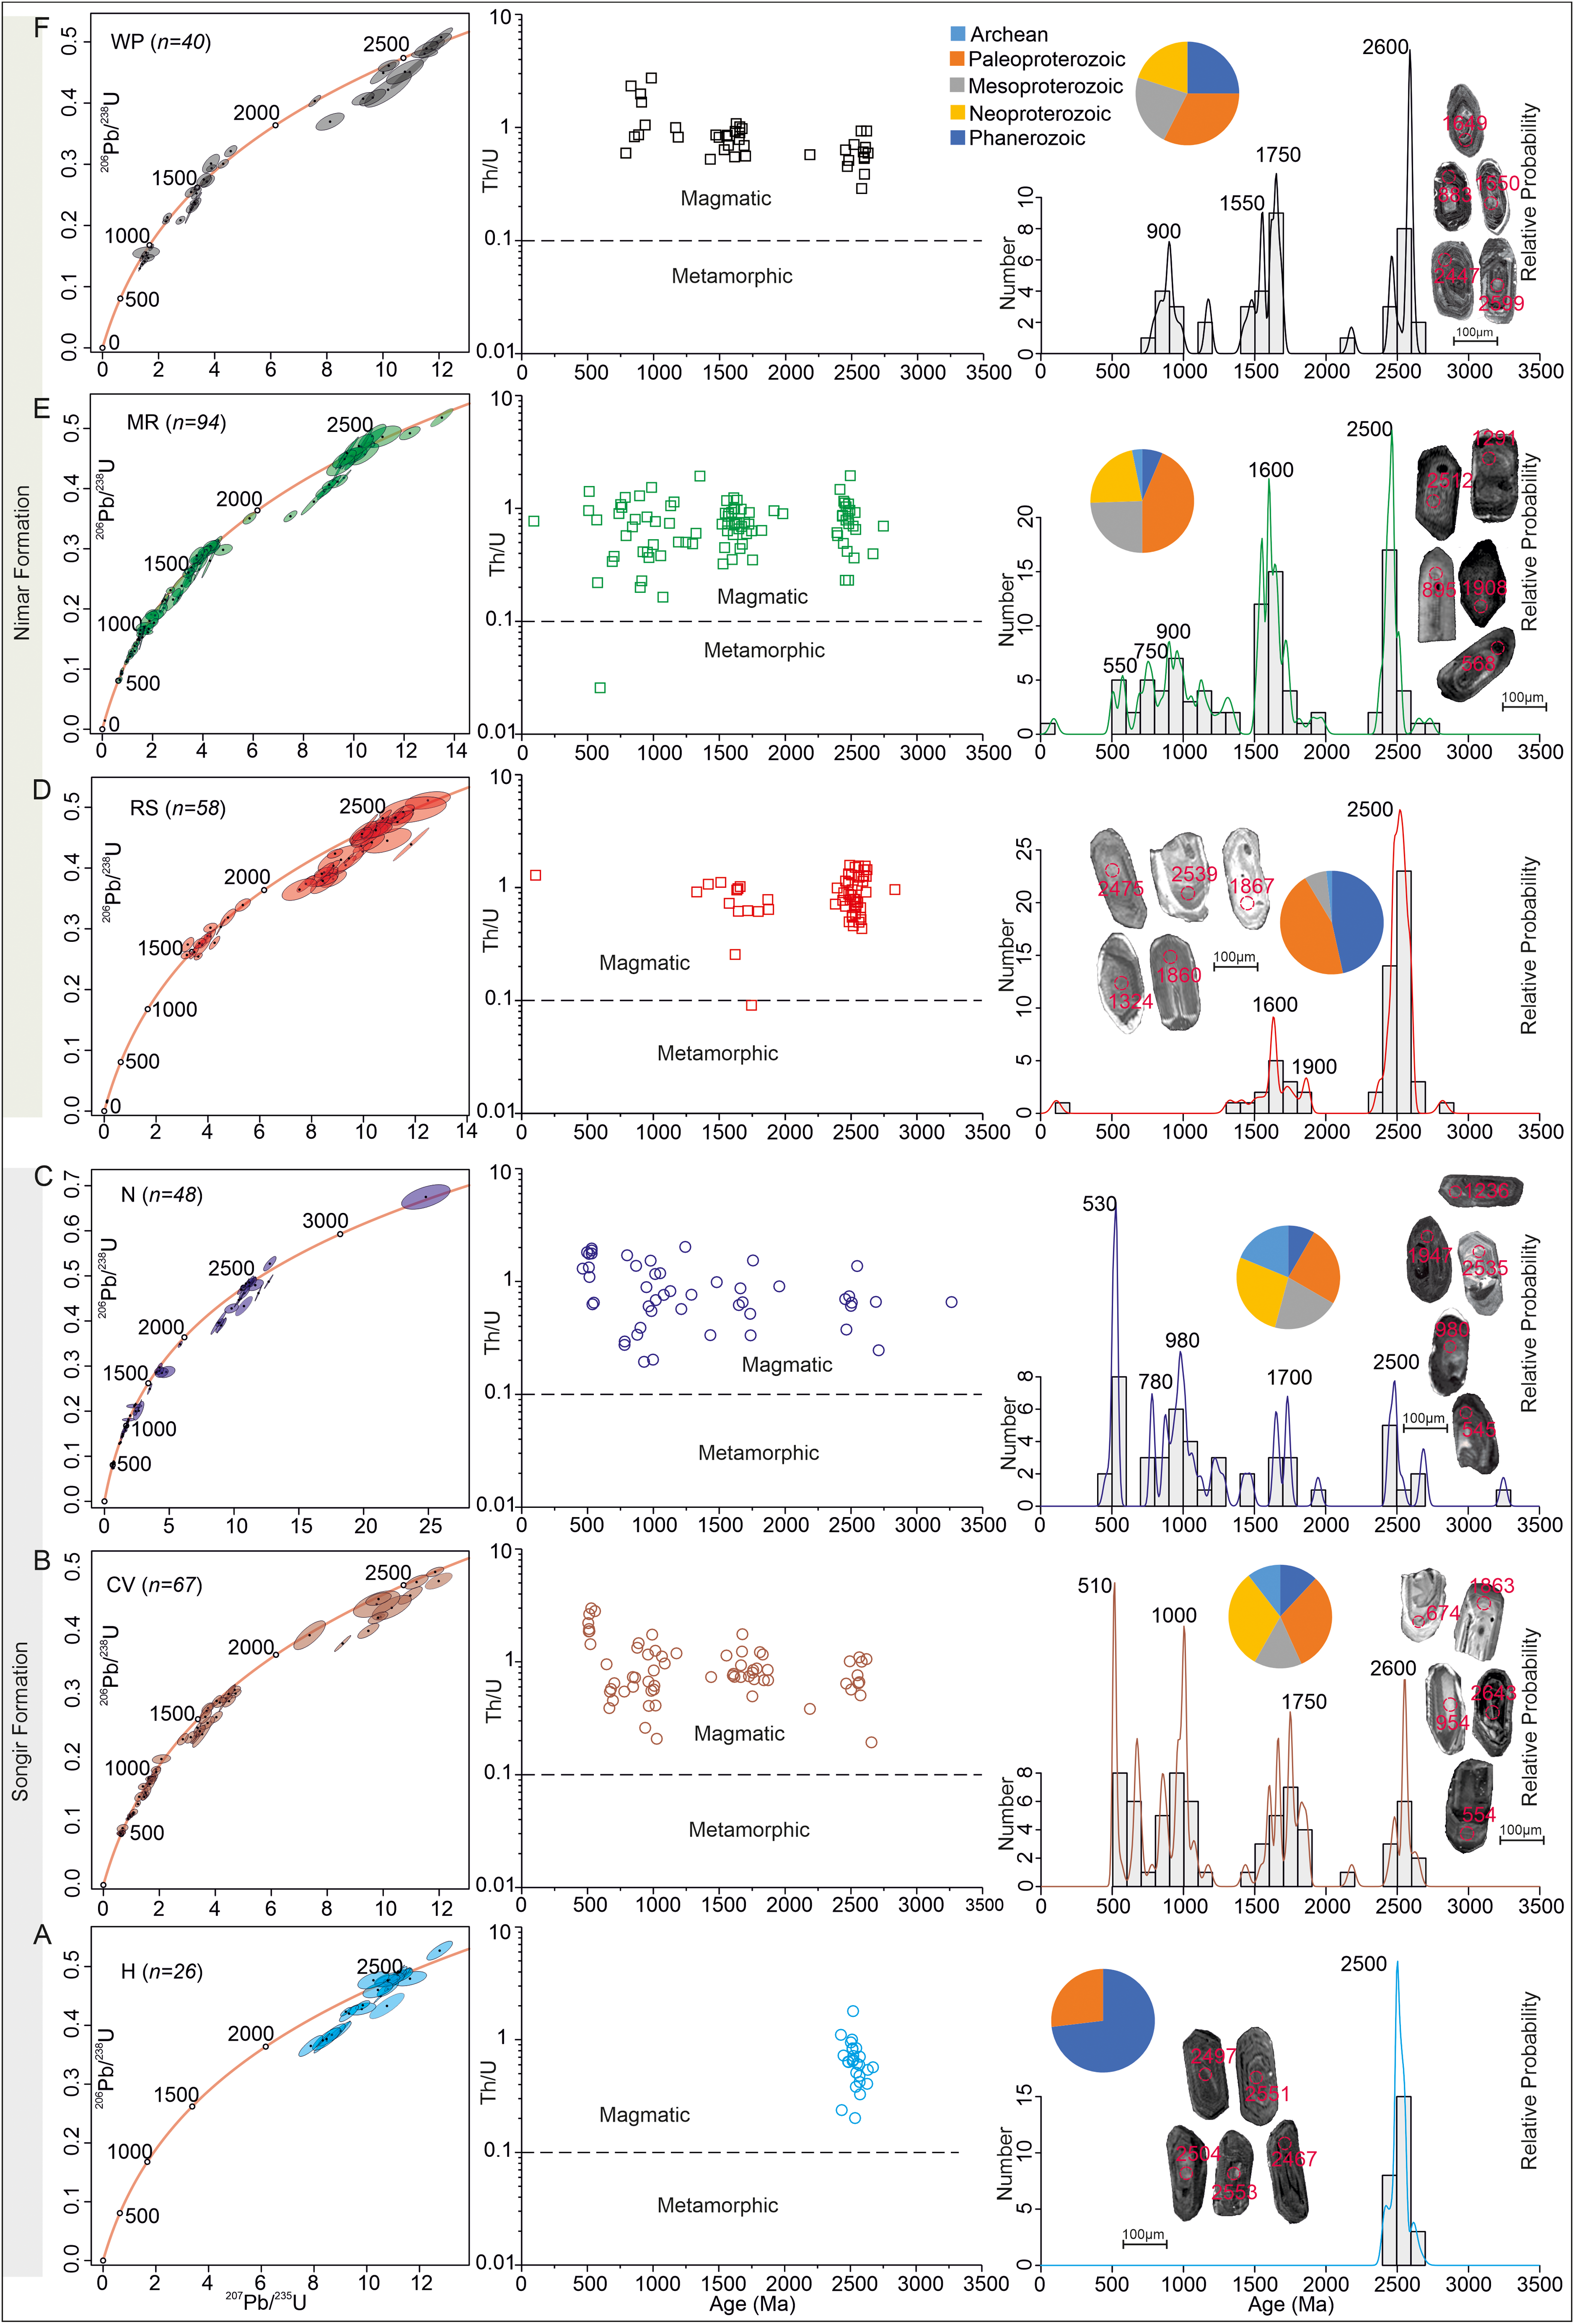
The Sample Naswadi (N) (younger than sample H) was collected from the western Narmada basin. In this sandstone, 57 zircon grains were analysed, of which 50 grains showed concordant ages. The Th/U ratios of the zircon grains range from 0.19 to 1.91. The Archaean zircons in this sample contribute to 8%, with ages ranging from 3249 to 2535 Ma. Palaeoproterozoic zircons (2494 to 1641 Ma) account for 25% of the total analysed grains, with major peaks at 1700 Ma. Additionally, Neoproterozoic (ages from 992 to 545 Ma) and Mesoproterozoic (ages from 1474 to 1009 Ma) zircons comprise 27% and 21% of the population, respectively. The Phanerozoic components constitute 19% of the total, with ages ranging from 535 to 460 Ma and peaking at 530 Ma (Figure 6b).
The sample Chosalpura village (CV) was collected from the western Narmada basin. In this sandstone, 120 zircon grains were analysed, of which 67 grains showed concordant ages. The Th/U ratios of zircons range from 0.19 to 2.90. The Archaean zircons, with ages from 3258 to 2538 Ma (peaking at 2600 Ma), made up 12% of the sample, whereas the Palaeoproterozoic zircons (ages from 2489 to 1600 Ma) contribute 31%, with peaks noted between 1750 and 1650 Ma. The Neoproterozoic (ages from 998 to 554 Ma) and Mesoproterozoic (ages from 1595 to 1003 Ma) zircons account for 31% and 15% of the population, respectively, with a peak at 1000 Ma. The Phanerozoic components contribute 11%, with ages ranging from 525 to 503 Ma and peaking at 510 Ma (Figure 6c).
The sample Raisinghpura (RS) was collected from the central Narmada basin. In this sandstone, 121 grains were analysed, of which 58 grains showed greater than 90% concordance. The Th/U ratios of zircons range from 0.25 to 1.55. The Archaean zircons constitute 46% of the total population, with ages ranging from 2821 to 2501 Ma and a peak at 2500 Ma. The Palaeoproterozoic zircons (ages from 2498 to 1614 Ma) and Mesoproterozoic zircons (ages from 1568 to 1324 Ma) account for 45% and 7%, respectively, with peaks in the Palaeoproterozoic observed at 1600 Ma (Figure 6d). Notably, the Neoproterozoic component was nearly absent, with only one grain dated at 106 ± 13 Ma.
The sample Men River (MR) was collected from the eastern part of the central Narmada basin. In this sandstone, 122 zircon grains were analysed, of which 94 showed concordant ages. The Th/U ratios of zircons range from 0.03 to 1.90. The Archaean zircons represent 6% of the total population, with ages ranging from 2734 to 2505 Ma, peaking at 2500 Ma. The Palaeoproterozoic zircons (ages from 2484 to 1601 Ma) comprise 44% of the sample, with peaks at 1600 Ma. The Neoproterozoic (ages from 996 to 568 Ma) and Mesoproterozoic (ages from 1599 to 1010 Ma) zircons account for 22% and 25% of the grain populations, respectively, with identified peaks at 550, 750 and 900 Ma. Phanerozoic zircons account for 3% and range in age from 511 to 92 Ma (Figure 6e).
Sample Walpur (WP) was collected from the central Narmada basin. In this sandstone 125 zircon grains were analysed, of which only 40 grains show greater than 90% concordance. The Th/U ratios vary from 0.29 to 2.70. The Archaean components constitute 25% of the total population, ranging from 2618 to 2513 Ma, with a peak around 2600 Ma. The Palaeoproterozoic (ages from 2472 to 1610 Ma), Mesoproterozoic (ages from 1562 to 1163 Ma) and Neoproterozoic (ages from 980 to 787 Ma) zircons represent 32%, 23% and 20% of the population, respectively, with corresponding peaks at 1750, 1550 and 900 Ma (Figure 6f).
4.d. Detrital zircon geochemistry
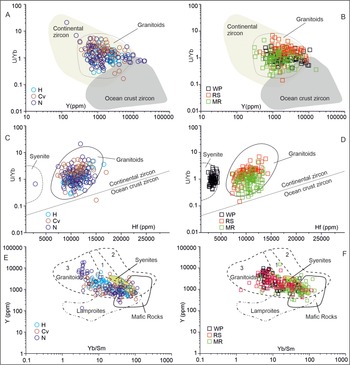
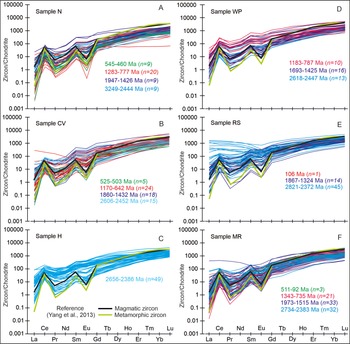
U and Th concentrations in the zircons of the Songir Formation ranged from 54 to 2064 ppm and 29 to 1762 ppm, respectively (see Supplementary Data 3). In contrast, Y and Hf concentrations ranged from 133 to 18491 ppm and from 2886 to 17020 ppm, respectively. Additionally, the total rare earth element (REE) content ranged from 91 to 15941 ppm, whereas the chondrite normalized Lu(N) value varied from 67 to 11959. In contrast, U and Th contents in zircons of the Nimar Formation ranged from 41 to 3390 ppm and 6 to 2192 ppm, respectively. The Y and Hf concentrations of these zircons were between 298 and 14683 ppm and 2473 and 14317 ppm, respectively. In contrast, the total REE content varied between 218 and 7704 ppm, and the chondrite-normalized Lu(n) value ranged from 416 to 7552. The U/Yb vs Y and the U/Yb vs Hf discrimination plots revealed a continental origin for the zircons, sourced primarily from granitoids and gneisses, with minor contributions from syenites (Grimes et al. Reference Grimes, John, Kelemen, Mazdab, Wooden, Cheadle, Hanghøj and Schwartz2007; Figure 7a–d). Additionally, the Y (ppm) vs. Yb/Sm diagram indicated the prominent sourcing of detrital zircon from granites and gneisses (Belousova et al. Reference Belousova, Griffin, O’Reilly and Fisher2002; Figure 7e–f). Chondrite-normalized REE pattern of zircons showed light rare earth element (LREE) depletion with a negative Eu anomaly (Figures 8a–f).
A cross plot of (a–b) Y (ppm) versus Yb/Sm, (c–d) U/Yb vs Hf, and (e–f) Y vs Yb/Sm (Belousova et al. Reference Belousova, Griffin, O’Reilly and Fisher2002; Grimes et al. Reference Grimes, John, Kelemen, Mazdab, Wooden, Cheadle, Hanghøj and Schwartz2007) was used to discriminate against the origin of detrital zircon grains in the formations. The fields of zircon compositions are used as discriminants for different rock types. The granitoid section includes (1) aplites and leucogranites, (2) granites and (3) granodiorites and tonalites. The corresponding REE plot of the zircon shows LREE-depleted and heavy rare earth element (HREE) enriched pattern, suggesting a granitoid source for the sediments (chondrite-normalized values after Taylor & McLennan, Reference Taylor and McLennan1985) (A, C, E: the Songir Formation, B, D, F: the Nimar Formation).
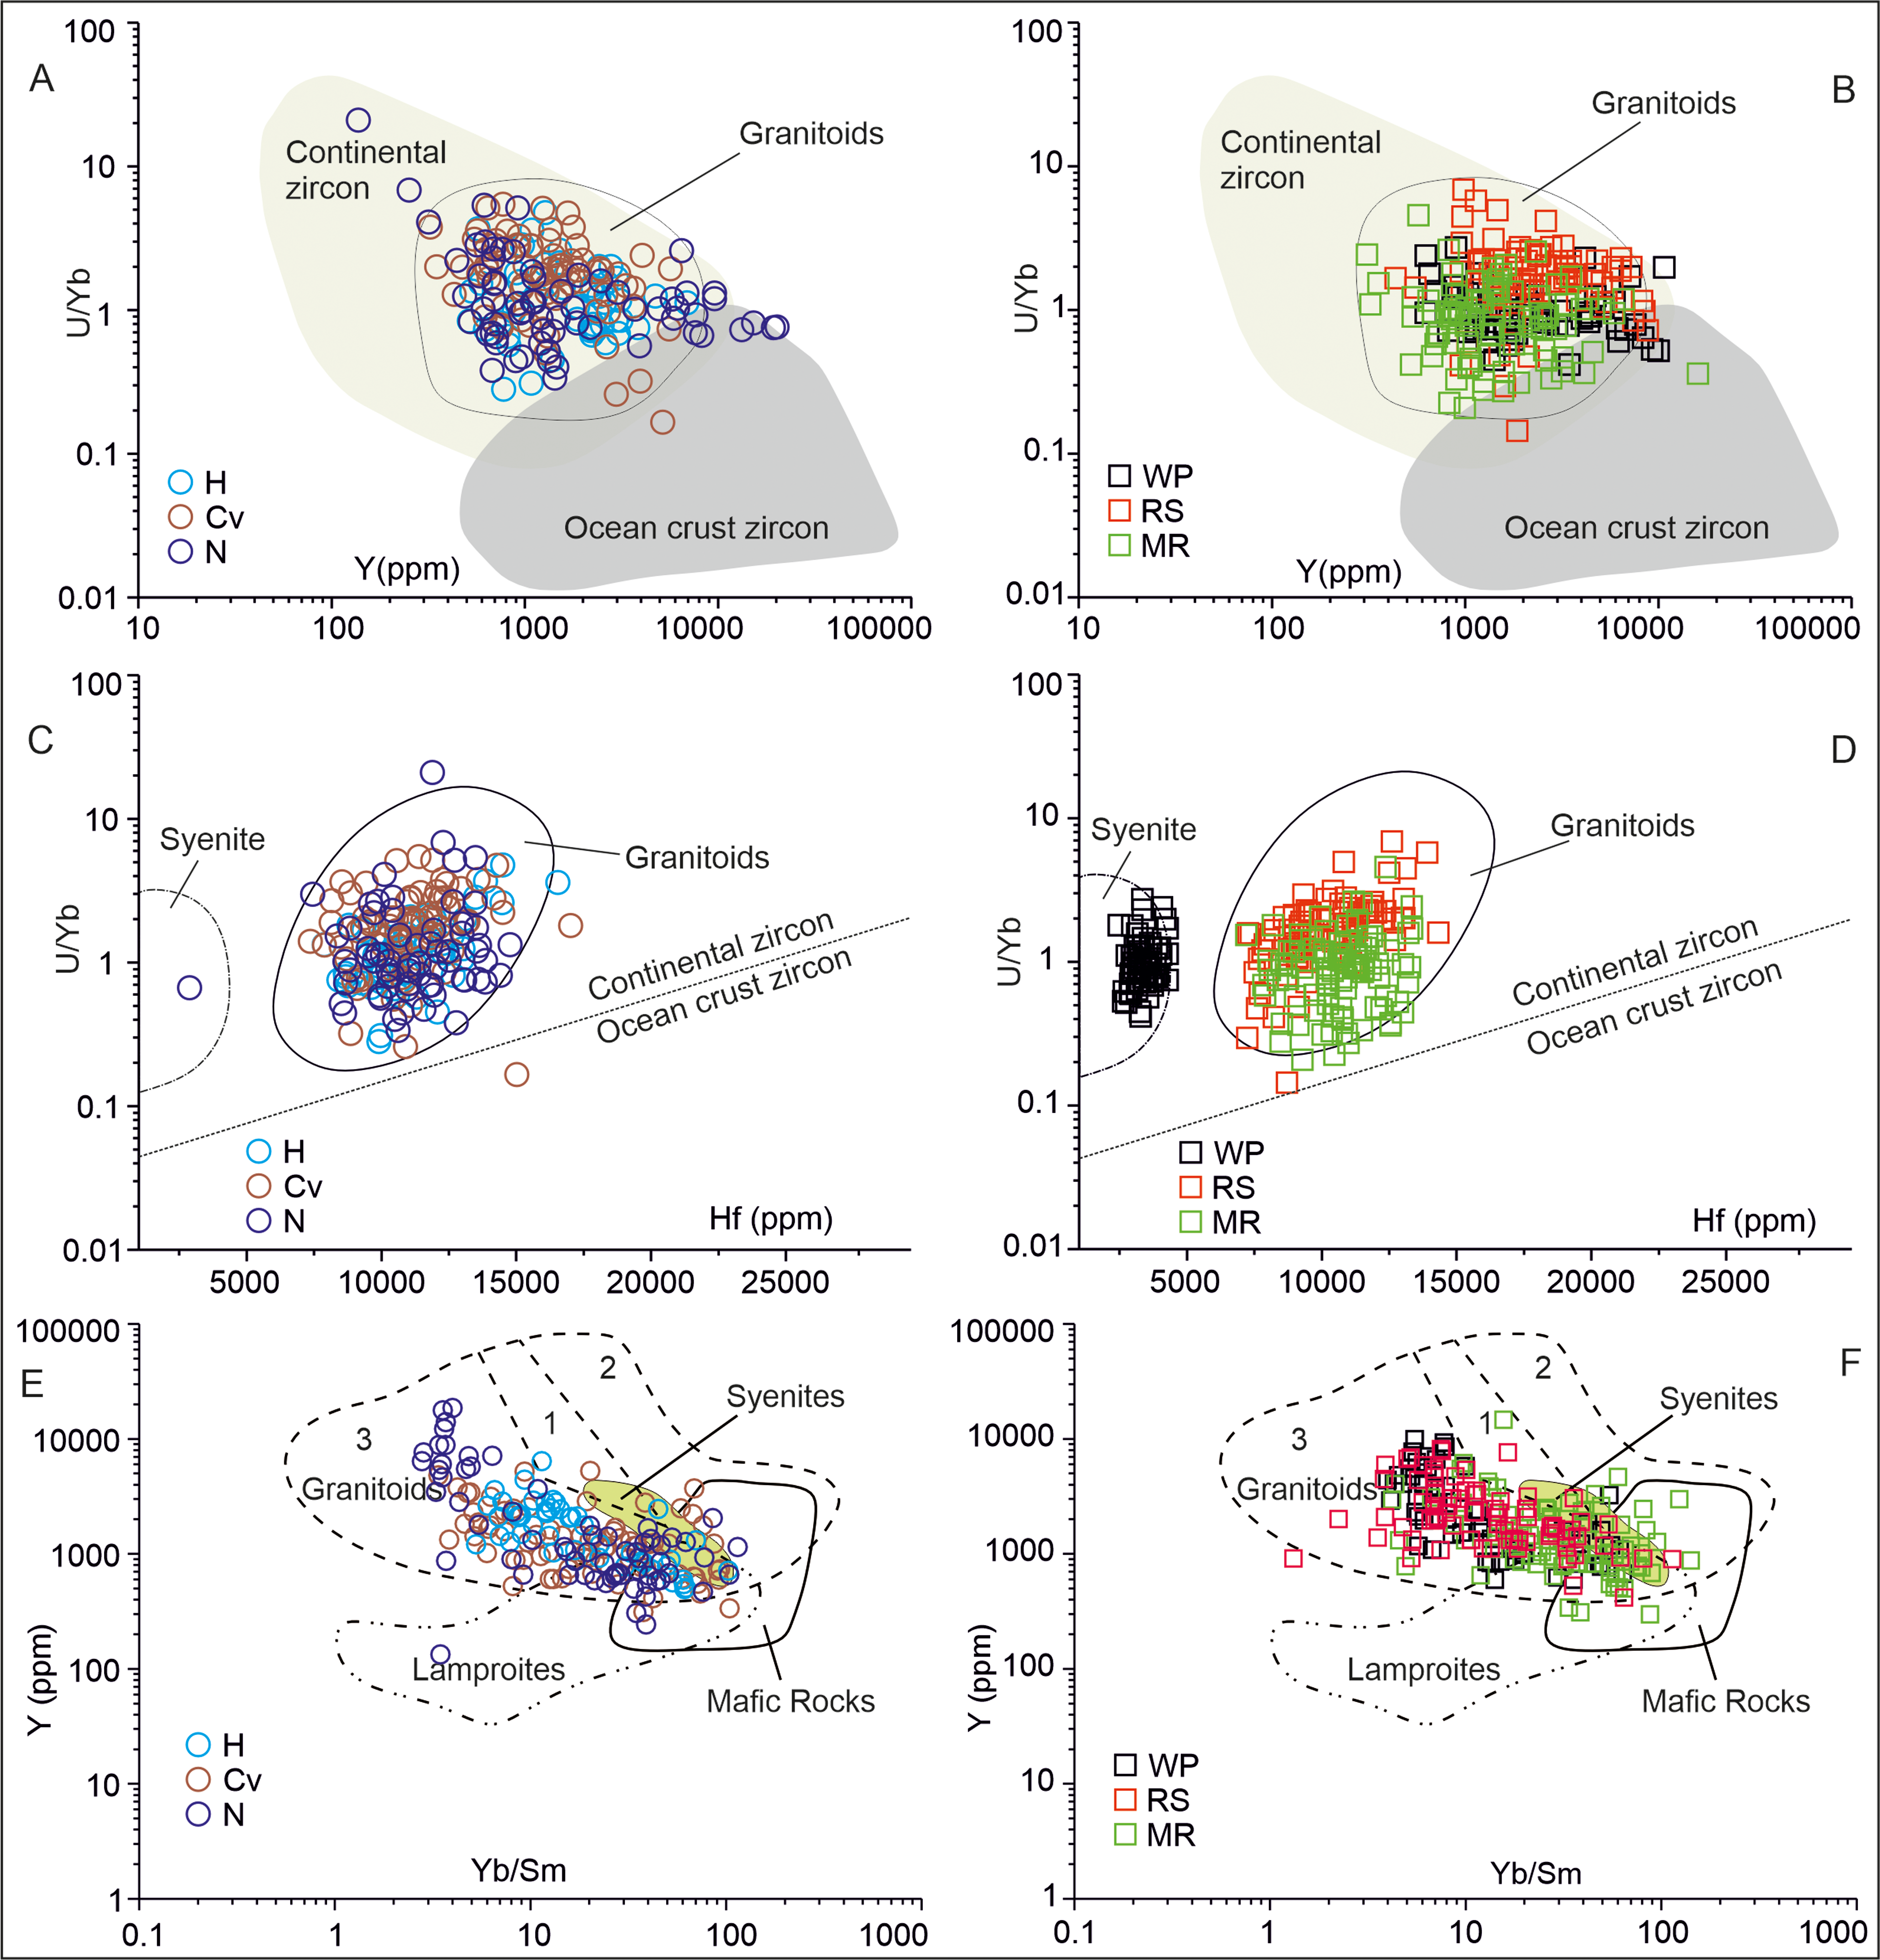
Figure 7. Long description
The image contains six scatter plots arranged in a 2x3 grid. Each plot compares different elemental ratios to discriminate the origin of detrital zircon grains in the Songir and Nimar formations. Panel A: A scatter plot of Y (ppm) versus Yb/Sm for the Songir Formation. The axes are labeled Y (ppm) and Yb/Sm. The plot includes data points for different rock types such as continental zircon, ocean crust zircon, and granitoids. Panel B: A scatter plot of Y (ppm) versus Yb/Sm for the Nimar Formation. The axes are labeled Y (ppm) and Yb/Sm. The plot includes data points for different rock types such as continental zircon, ocean crust zircon, and granitoids. Panel C: A scatter plot of U/Yb versus Hf (ppm) for the Songir Formation. The axes are labeled U/Yb and Hf (ppm). The plot includes data points for different rock types such as syenite, continental zircon, ocean crust zircon, and granitoids. Panel D: A scatter plot of U/Yb versus Hf (ppm) for the Nimar Formation. The axes are labeled U/Yb and Hf (ppm). The plot includes data points for different rock types such as syenite, continental zircon, ocean crust zircon, and granitoids. Panel E: A scatter plot of Y (ppm) versus Yb/Sm for the Songir Formation. The axes are labeled Y (ppm) and Yb/Sm. The plot includes data points for different rock types such as syenites, granitoids, lamproites, and mafic rocks. Panel F: A scatter plot of Y (ppm) versus Yb/Sm for the Nimar Formation. The axes are labeled Y (ppm) and Yb/Sm. The plot includes data points for different rock types such as syenites, granitoids, lamproites, and mafic rocks.
The chondrite-normalized rare earth elements (REE) patterns of detrital zircons from the Lower Narmada basin. The REE pattern of detrital zircons is comparable with the magmatic and metamorphic origin of zircon (Yang et al., Reference Yang, Niu, Shan, Sun, Zhang, Li, Jiang and Yu2013). The chondrite normalization values are from Taylor & McLennan (Reference Taylor and McLennan1985).

5. Discussion
5.a. Source rock composition based on sandstone framework grains and mineral geochemistry
The sandstone is dominated by monocrystalline quartz, with a few quartz grains showing deformation lamellae, suggesting derivation from plutonic and metamorphic rocks (Figure 4; Basu et al. Reference Basu, Young, Suttner, James and Mack1975; Blatt et al. Reference Blatt, Middleton and Murray1980). K-feldspar content indicates the presence of mixed plutonic terranes, such as granite or granodiorite sources (Ingersoll and Suczek, Reference Ingersoll and Suczek1979). The presence of staurolite grains indicates medium- to high-grade metamorphic sources (Basu et al. Reference Basu, Young, Suttner, James and Mack1975; Pettijohn, Reference Pettijohn1975). The heavy mineral assemblages of the Songir and Nimar formations suggest a common sediment source (Figures 2 and 3). The heavy mineral associations of rutile, tourmaline and zircon with staurolite imply a granitoid and metapelite protolith (Rajak et al. Reference Rajak, Chaudhuri, Prabhakar and Banerjee2022). The presence of chert and abraded quartz overgrowths attests to sedimentary sources, possibly from the Vindhyan and Eastern Gondwana sediments of India exposed near the study area. The rounded tourmaline and zircon in the formation corroborate long transportation (Pettijohn et al. Reference Pettijohn, Potter and Siever1987). The textural and mineralogical maturity of sandstones in the Songir Formation reflects intense weathering and long-distance transport. The moderately high ZTR (>55) indices of the Songir sandstones corroborate the presence of highly weathered sources. Therefore, the Songir quartz arenites could be the product of a multicyclic reworking from older siliciclastic strata. The presence of chromite, apatite and ilmenite in the Nimar sandstones indicates the contribution from mafic sources.
The heavy mineral composition provides significant insights into the provenance and nature of the source (Henry and Guidotti, Reference Henry and Guidotti1985; Dutrow and Henry, Reference Dutrow and Henry2011; Rajak et al. Reference Rajak, Chaudhuri, Prabhakar and Banerjee2022, Reference Rajak, Prabhakar and Banerjee2024a, b, c). Tourmaline typically occurs in granites, pegmatites, metamorphosed rocks and hydrothermal deposits (Henry and Guidotti, Reference Henry and Guidotti1985; Dutrow and Henry, Reference Dutrow and Henry2011). The Fe-bearing schorl variety is typically associated with granites and pegmatites. In contrast, Mg-rich dravite is commonly associated with metamorphic rocks, mafic igneous rocks and metamorphosed limestones (Figure 5c). Available palaeocurrent data indicate predominantly westward-directed drainage. The analysed detrital tourmalines reveal schorlitic tourmaline (≥60%) derived from granites and pegmatite sources (Figure 5c–d). Dravitic tourmaline (≤40%) compositions overlap those reported from hornfels and schists of the Champaner Group within the Aravalli Supergroup of the ADFB, reported by Gorania et al. (Reference Gorania, Akolkar, Joshi, Limaye and Singh2024) (Figure 5c–d). The presence of staurolite and rutile grains in the sediments further supports a significant metamorphic contribution. Trace element content in zircon is useful for tracking crustal evolution over time (Mange and Morton, Reference Mange and Morton2007; von Eynatten and Dunkl, Reference von Eynatten and Dunkl2012). The trace element content of zircon suggests a magmatic origin (Figures 6–8), predominantly from granitoid sources (Belousova et al. Reference Belousova, Griffin, O’Reilly and Fisher2002; Grimes et al. Reference Grimes, John, Kelemen, Mazdab, Wooden, Cheadle, Hanghøj and Schwartz2007; Figure 7c–d). The high Y (ppm) and Lu(N) concentrations in zircons corroborate the granitic source (Hoskin and Ireland, Reference Hoskin and Ireland2000). The sandstone petrography, in conjunction with tourmaline and zircon geochemistry, indicates the predominance of felsic magmatic sources, with appreciable metamorphic input.
5.b. Possible source rocks based on zircon geochronology
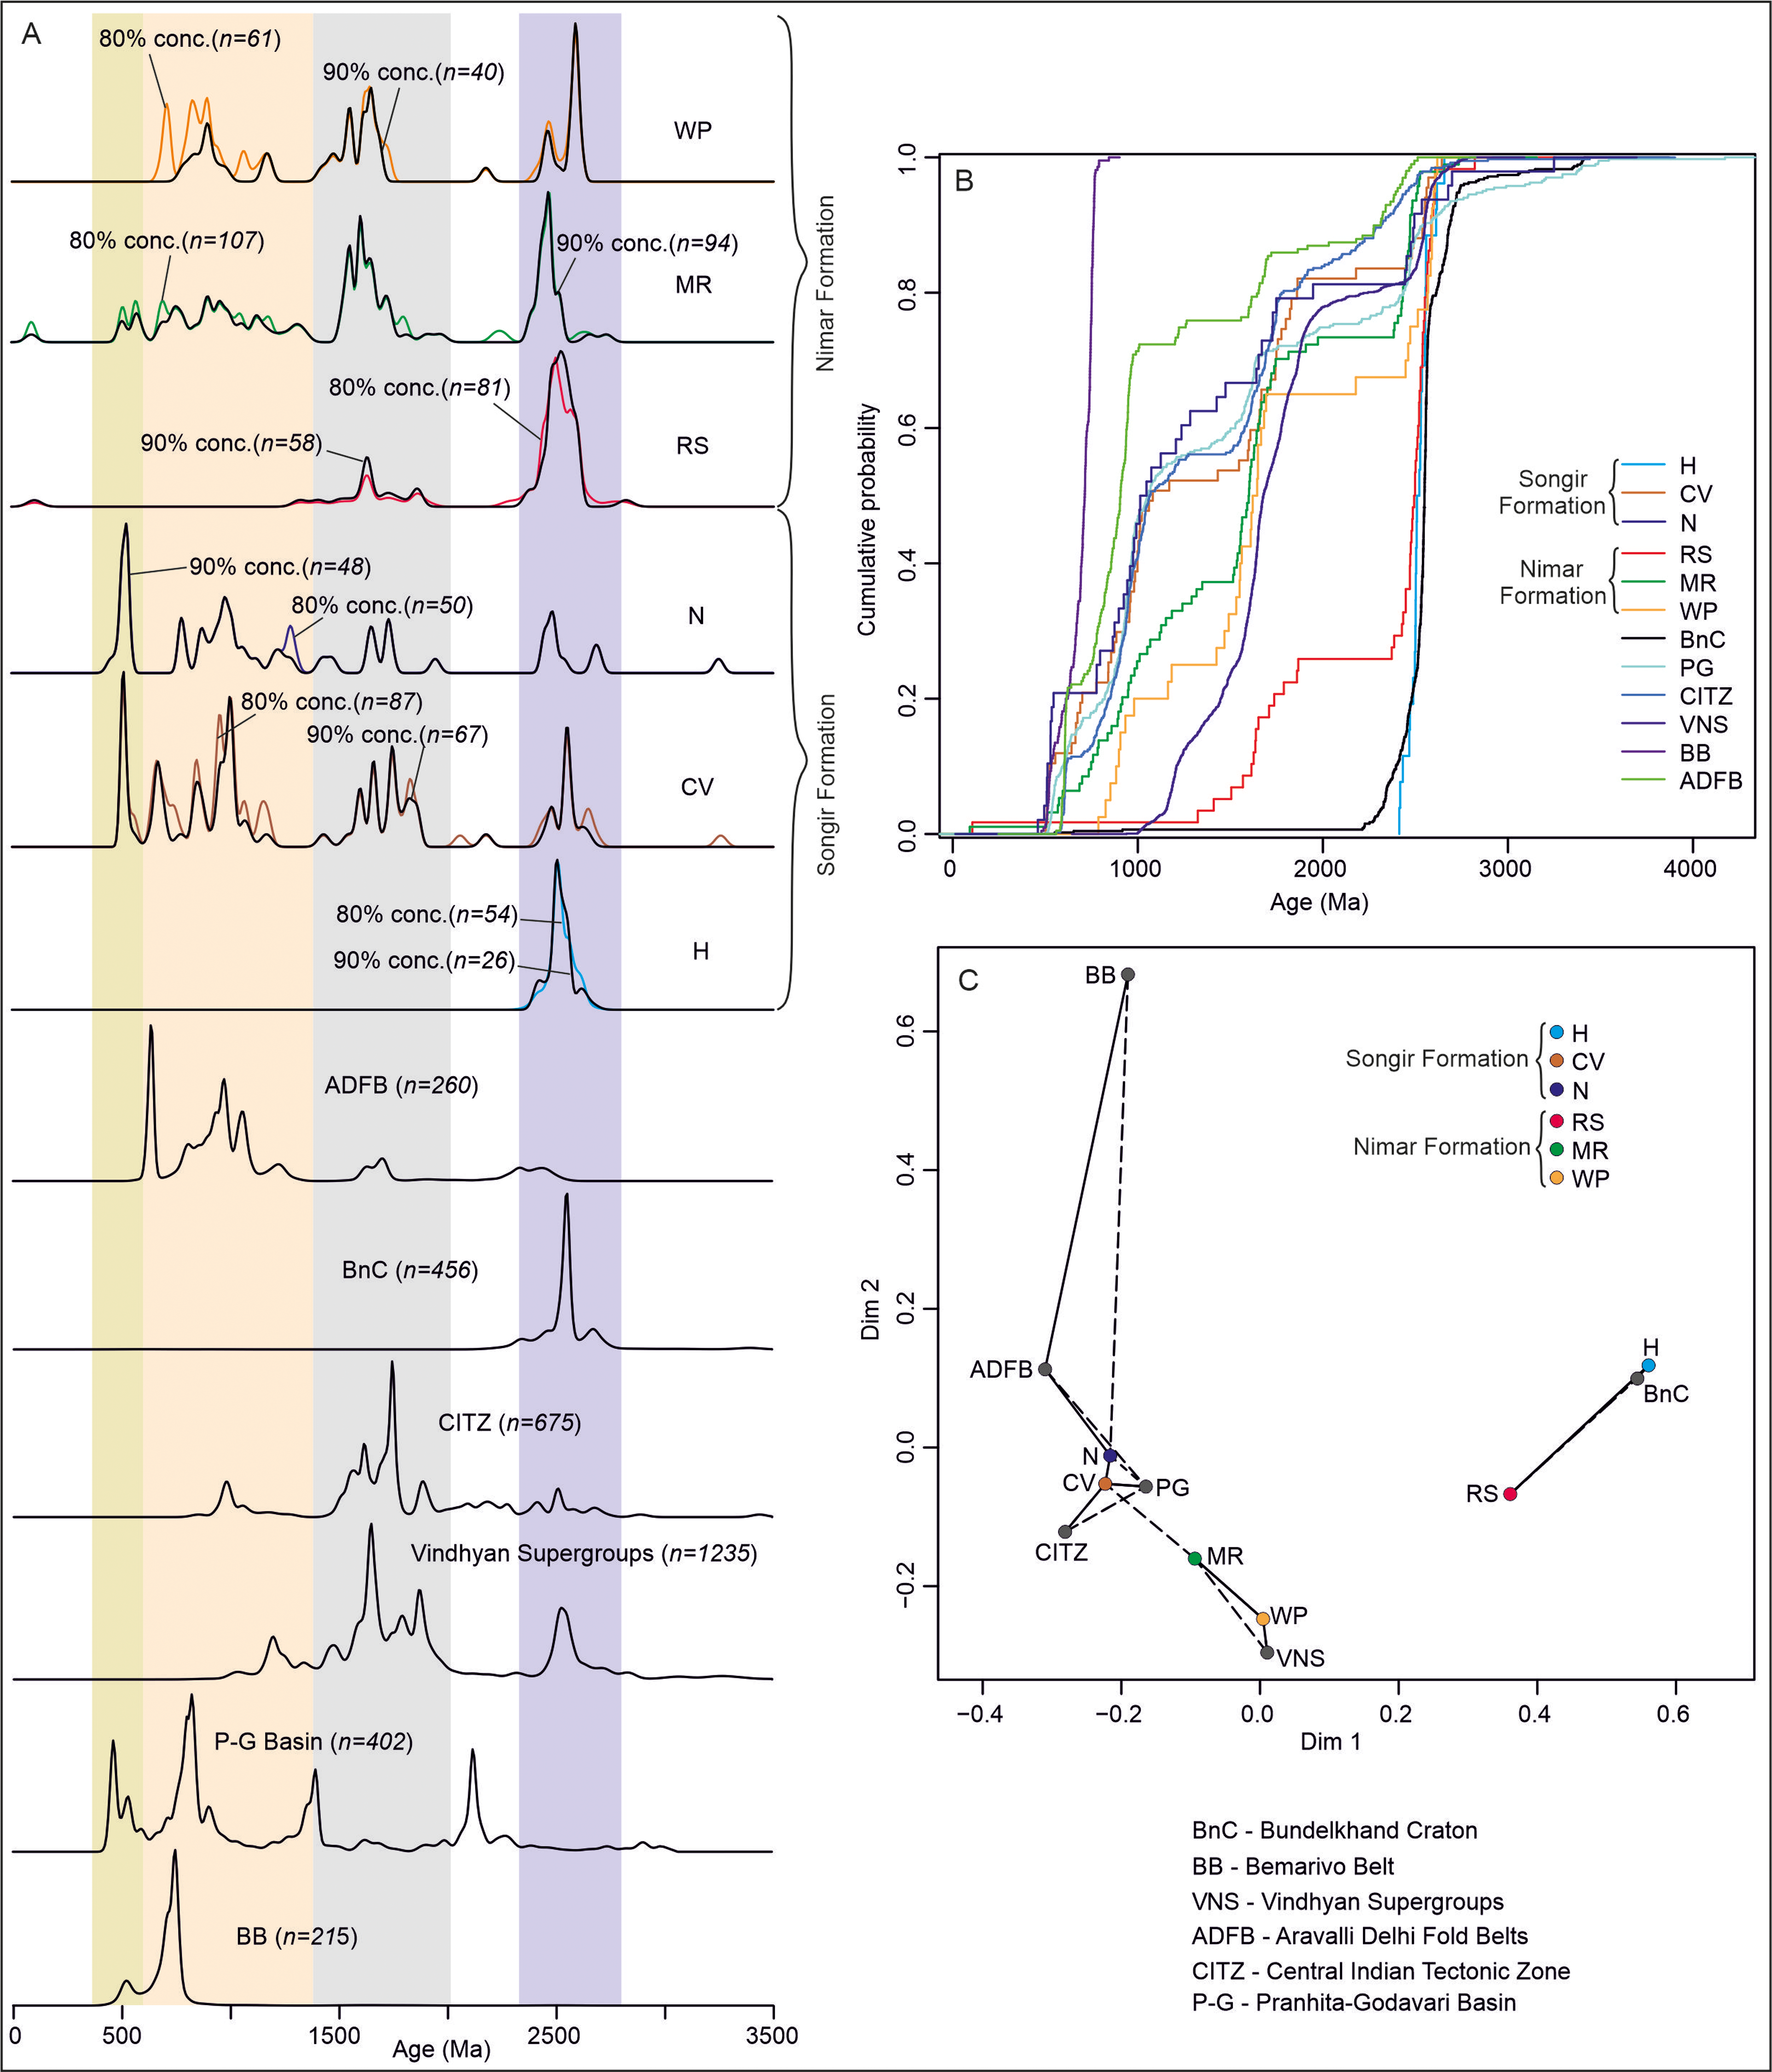
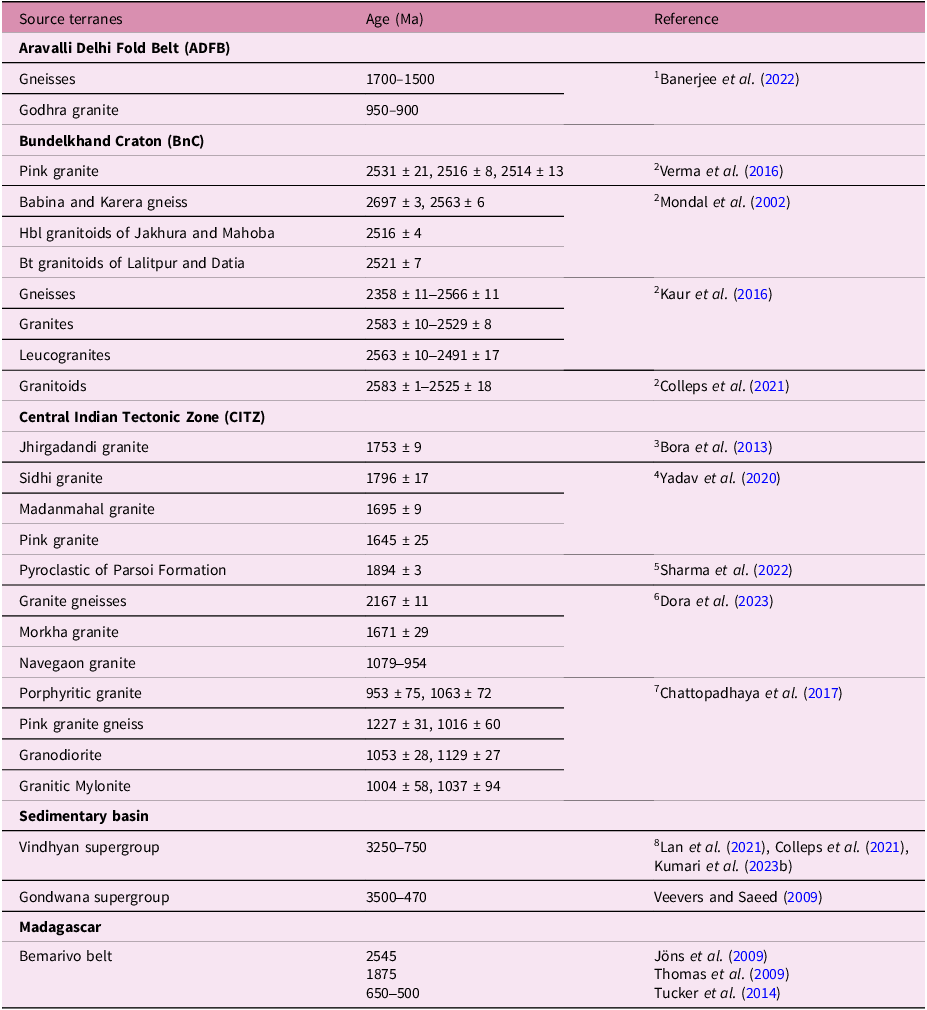
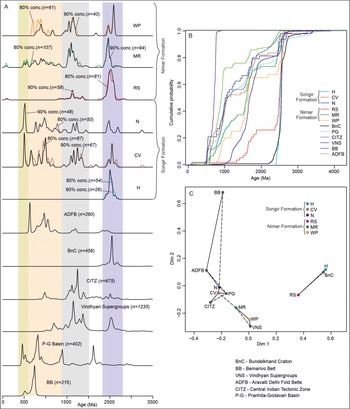
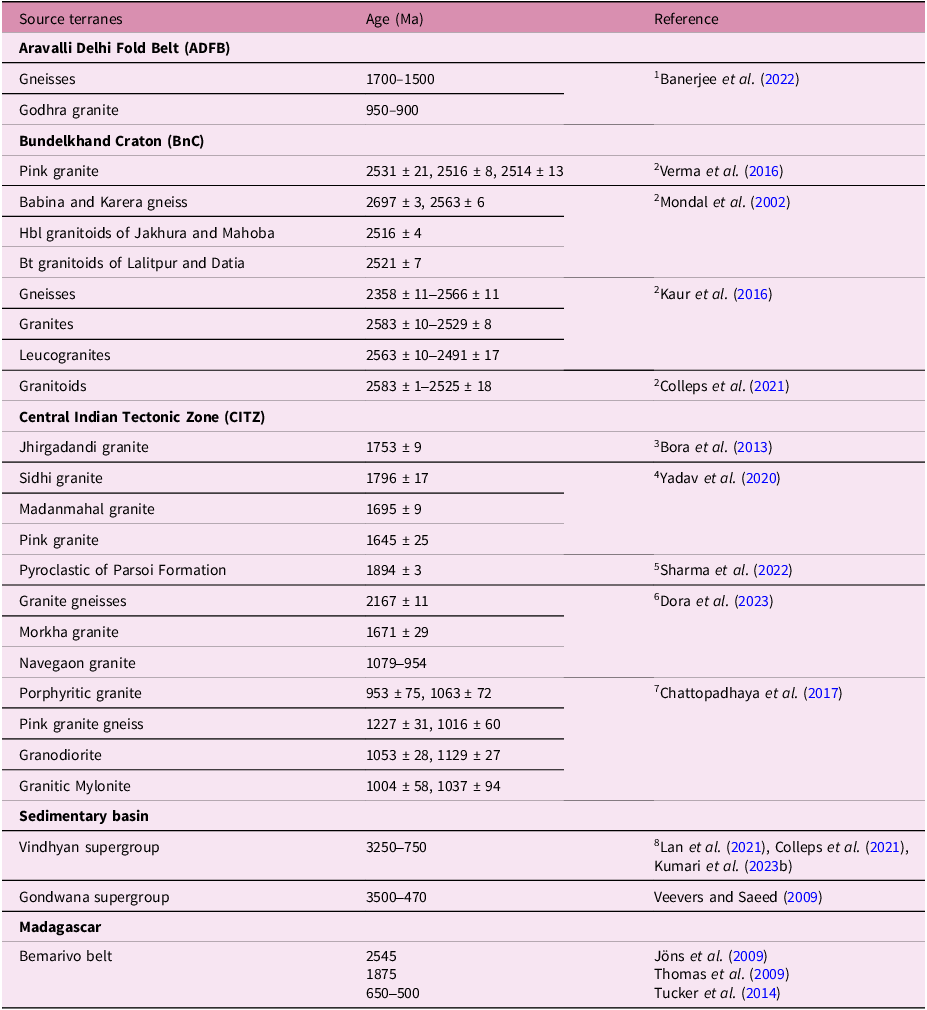
U–Pb dating of zircons by laser ablation inductively coupled plasma mass spectrometry (LA-ICP-MS) is a well-established technique in provenance studies and for constraining sediment routing (Gehrels et al. Reference Gehrels, Dickinson, Ross, Stewart and Howell1995; Critelli and Nilsen, Reference Critelli and Nilsen2000; Belousova et al. Reference Belousova, Griffin, O’Reilly and Fisher2002; Grimes et al. Reference Grimes, John, Kelemen, Mazdab, Wooden, Cheadle, Hanghøj and Schwartz2007; Gehrels, Reference Gehrels2012; Armstrong-Altrin et al. Reference Armstrong-Altrin, Ramos-Vázquez, Zavala-León and Montiel-García2018). The U–Pb ages of detrital zircons of the Songir and Nimar formations were compared with possible source regions (Figure 9a). Moreover, statistical comparisons using CDFs and MDS were conducted to quantify similarities between samples and candidate sources (Figure 9b–c). Detrital zircon U–Pb dating identifies five distinct age populations: (i) >2350 Ma, (ii) 1850–1500 Ma, (iii) 1500–1000 Ma, (iv) 1000–650 Ma and (vi) 650–460 Ma. The zircon population with age ranges between 2750 and 2350 Ma (Figure 9a), found in the Songir and Nimar sandstones, is comparable with U–Pb ages of granitoids and gneisses from Bundelkhand and Aravalli cratons (2.7–2.3 Ga; Mondal et al. Reference Mondal, Goswami, Deomurari and Sharma2002; Kaur et al. Reference Kaur, Zeh, Chaudhri and Eliyas2016; Verma et al. Reference Verma, Verma, Oliveira, Singh and Moreno2016; Banerjee et al. Reference Banerjee, Cogné, Sequeira and Bhattacharya2022; Table 4). The zircons in the Songir and Nimar sandstones indicate a cumulative distribution similar to that of the Bundelkhand sources (>2350 Ma) (Figure 9b). The zircons with a U–Pb age cluster of 1850–1500 Ma (Figure 9a) match those in basement gneisses of the ADFB in the Godhra and Chhota Udepur areas (Banerjee et al. Reference Banerjee, Cogné, Sequeira and Bhattacharya2022). Additionally, the CITZ hosts 1800–1500 Ma magmatic rocks from the basal Chitrangi Formation (Khanna et al. Reference Khanna, Rao, Bizimis, Satyanarayanan, Krishna and Sai2017), Parsoi Formation (Sharma et al. Reference Sharma, Das, Chakraborty, Shiraishi and Kayama2022), Jhirgadandi (Bora et al. Reference Bora, Kumar, Yi, Kim and Lee2013), Madanmahal and Sidhi (Yadav et al. Reference Yadav, Ahmad, Kaulina, Bayanova and Bhutani2020; Parvez et al. Reference Parvez, Mondal, Amal Dev, Ahmad, Khan and Tomson2024) and Betul Belt (Dora et al. Reference Dora, Meshram, Baswani, Malviya, Upadhyay, Shareef, Raza, Ranjan, Meshram, Patnaik and Randive2023), which are also possible sources (Table 4). The 1850–1500 Ma ages are similar to those of the CITZ sources, whereas the 1400–650 Ma ages indicate a contribution from the ADFB, Vindhyan and Gondwana sediments. The significant population of 1500–1000 Ma (Figure 9a) detrital zircons, which peaked at 1200 Ma, are possibly sourced from the granitoids of the Sausar Mobile Belt (Chakrabarty et al. Reference Chakrabarty, Karmakar, Mukherjee, Choudhury, Maiti, Sanyal and Sengupta2022), Gavilgarh Tan Shear Zone (Chattopadhyay et al. Reference Chattopadhyay, Chatterjee, Das and Sarkar2017), and Betul Belt (Dora et al. Reference Dora, Meshram, Baswani, Malviya, Upadhyay, Shareef, Raza, Ranjan, Meshram, Patnaik and Randive2023) (Table 4). Neoproterozoic zircon (1000-650 Ma) population suggests derivation from the Godhra granites of the ADFB (Banerjee et al. Reference Banerjee, Cogné, Sequeira and Bhattacharya2022) and from the granitoids of the CITZ (Chattopadhyay et al. Reference Chattopadhyay, Chatterjee, Das and Sarkar2017). The source of detrital zircon grains of 1400–900 Ma ages may be related to the Rewa and Bhander groups of the Vindhyan Supergroup (Colleps et al. Reference Colleps, McKenzie, Sharma, Liu, Gibson, Chen and Stockli2021; Lan et al. Reference Lan, Pandey, Zhang, Sharma, Gao and Wu2021; Kumari et al. Reference Kumari, Tandon, Kumar and Ghatak2023a; Table 4).
(a) The zircon ages of the formations are compared with available data of zircon ages from the nearby possible source to construct the precise source for the Narmada basin. The pie chart shows the different age sources of zircon contribution in the sediments. ADFB: Banerjee et al. Reference Banerjee, Cogné, Sequeira and Bhattacharya2022; CITZ: Bora et al. Reference Bora, Kumar, Yi, Kim and Lee2013; Chattopadhyay et al. Reference Chattopadhyay, Chatterjee, Das and Sarkar2017; Sharma et al. Reference Sharma, Das, Chakraborty, Shiraishi and Kayama2022; Dora et al. Reference Dora, Meshram, Baswani, Malviya, Upadhyay, Shareef, Raza, Ranjan, Meshram, Patnaik and Randive2023; Bundelkhand Craton: Colleps et al. Reference Colleps, McKenzie, Sharma, Liu, Gibson, Chen and Stockli2021; Kaur et al. Reference Kaur, Zeh, Chaudhri and Eliyas2016; Verma et al. Reference Verma, Verma, Oliveira, Singh and Moreno2016; Vindhyan: Lan et al. Reference Lan, Pandey, Zhang, Sharma, Gao and Wu2021; Colleps et al. Reference Colleps, McKenzie, Sharma, Liu, Gibson, Chen and Stockli2021: Pranhita-Godavari: Veevers & Saeed, Reference Veevers and Saeed2009; Bemarivo Belt, Madagascar: Jöns et al. Reference Jöns, Emmel, Schenk and Razakamanana2009; Thomos et al. Reference Thomas, De Waele, Schofield, Goodenough, Horstwood, Tucker, Bauer, Annells, Howard, Walsh and Rabarimanana2009). (b–c) Cumulative distribution function (CDF) and multi-dimensional scaling (MDS) plots showing detrital zircon U–Pb age distributions in the formations from the present study and possible sources.
Possible magmatic and metamorphic rocks from the Central Indian Tectonic Zone (CITZ), Aravalli Craton, Bundelkhand Craton and Sedimentary basins. Superscripts 1–8 denote the data sources used to compile the ages shown in Figure 1a
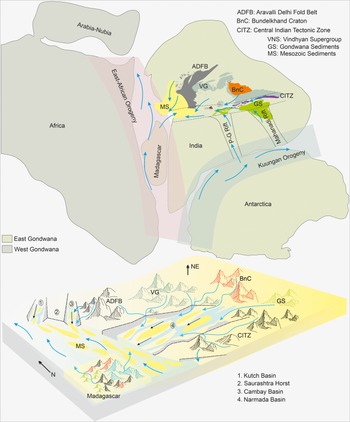
In addition to Indian sources, Madagascar was once part of the Indian Shield before rifting during the Cretaceous. Thus, Madagascar can also be considered a transcontinental potential provenance for sediments deposited in the adjacent western Indian basins (Jöns et al. Reference Jöns, Emmel, Schenk and Razakamanana2009; Thomas et al. Reference Thomas, De Waele, Schofield, Goodenough, Horstwood, Tucker, Bauer, Annells, Howard, Walsh and Rabarimanana2009; Tucker et al. Reference Tucker, Roig, Moine, Delor and Peters2014). Seismic data revealed an north northwest-south southeast (NNW-SSE)-trending asymmetric rift basin at the western margin of India, formed during the India–Madagascar tectonic separation (∼90 Ma) (Vichare et al. Reference Vichare, Mota, Sengupta and Mangaraj2022). Marine incursion into the Narmada basin propagated from the west (Tandon, Reference Tandon2000; Keller et al. Reference Keller, Nagori, Chaudhary, Reddy, Jaiprakash, Spangenberg, Mateo and Adatte2021), potentially making a possible sediment transport from Madagascar by tidal currents (Figure 10). The CDF plots of detrital zircons from the Songir and Nimar formations show a 650–500 Ma range, correlating with the Madagascar and suggesting a limited transcontinental sediment supply (Figure 9b; Table 4). Furthermore, the Indian Gondwana sediments contain Antarctic-linked detrital inputs preserved in <650–500 Ma zircon populations (Veevers and Tiwari, Reference Veevers and Tewari1995; Veevers and Saeed, Reference Veevers and Saeed2009). Moreover, a few studies propose that marine incursion into the Narmada basin in central India occurred via the Godavari rift (Kumari et al. Reference Kumari, Tandon, Kumar and Ghatak2020, Reference Kumari, Tandon, Kallukalam and Ghatak2023b). Consequently, a similar Antarctic contribution to the Narmada basin cannot be ruled out (Figure 10; Table 4). Therefore, the <650 Ma zircon population in the formation may reflect direct delivery from Madagascar and/or recycling from Gondwana strata containing Antarctic-derived detritus. Additionally, the MDS plot of Songir samples shows greater affinity towards the ADFB, CITZ and Gondwana sediment, whereas the Nimar sediments, in contrast, show a relationship with Bundelkhand sources (Figure 9c). The detrital zircon in the Nimar sandstones with an age of around 92 Ma likely records volcanic activity associated with Madagascar–India rifting and the final stages of Eastern Gondwana breakup (DeCelles et al. Reference DeCelles, Gehrels, Quade, LaReau and Spurlin2000).
The palaeogeographical reconstructions of the continents during the Lower Cretaceous (adapted from Gray et al. Reference Gray, Foster, Meert, Goscombe, Armstrong, Trouw and Passchier2008). The possible global and regional palaeodrainage system and source areas that supplied the sediments in the Narmada basin during the Cretaceous (Tandon, Reference Tandon2000; Veevers & Saeed, Reference Veevers and Saeed2009; Kumari et al. Reference Kumari, Tandon, Kumar and Ghatak2020, Reference Kumari, Tandon, Kumar and Ghatak2023a, Reference Kumari, Tandon, Kallukalam and Ghatakb; Cerri et al. Reference Cerri, Warren and Assine2024; Rajak et al. Reference Rajak, Banerjee, George, Dev and Tomson2026). The schematic diagram shows source terrains and sediment distribution in the western Indian basins and the Narmada basin. The possible transcontinental zircon in the Narmada basin is likely from Madagascar based on proximity and tectonic setting.

5.c. Palaeogeographic implications after the final rifting of Eastern Gondwana
India shares significant palaeomagnetic, faunal, sedimentary and stratigraphic similarities with Madagascar. However, the Cretaceous palaeogeography in western India, since the separation from Madagascar, remains poorly understood (Gibbons et al. Reference Gibbons, Whittaker and Müller2013; Shitole et al. Reference Shitole, Patel, Darngawn and Joseph2021; Schneider et al. Reference Schneider, Schetselaar, Powell, Tari, Raharisolofo and Ramboasalama2024). The Lower Cretaceous siliciclastic deposits of Madagascar are similar to those of the western Indian basins in terms of lithology and depositional environments (Biswas, Reference Biswas1999; Rogers et al. Reference Rogers, Hartman and Krause2000; Shitole et al. Reference Shitole, Patel, Darngawn and Joseph2021). Mesozoic rocks in the Morondava basin of Madagascar and Kutch–Saurashtra–Cambay basins of western India contain similar detrital zircon populations of <650 Ma, indicating sediment supply from the same East-African orogeny-related sources (Chaudhuri et al. Reference Chaudhuri, Das, Banerjee and Fitzsimons2020; Rajak et al. Reference Rajak, Prabhakar, Banerjee, Dev, George and Tomson2024b, Reference Rajak, Banerjee, George, Dev and Tomson2026; Schneider et al. Reference Schneider, Schetselaar, Powell, Tari, Raharisolofo and Ramboasalama2024; Figures 9 and 10). The zircon age population <650 Ma supports and strengthens a marine incursion into the Narmada basin during the Cretaceous from the west (Figure 10; Ahmad and Akhtar, Reference Ahmad and Akhtar1990; Tandon, Reference Tandon2000; Keller et al. Reference Keller, Nagori, Chaudhary, Reddy, Jaiprakash, Spangenberg, Mateo and Adatte2021). Furthermore, provenance studies reveal that the western margin of Eastern Gondwana and western Indian basins share the same East-African orogeny sources till the development of drainage barriers (Figure 10; Biswas, Reference Biswas1987; Gombos et al. Reference Gombos, Powell and Norton1995; Chaudhuri et al. Reference Chaudhuri, Das, Banerjee and Fitzsimons2020; Meinhold et al. Reference Meinhold, Bassis, Hinderer, Lewin and Berndt2021; Cerri et al. Reference Cerri, Warren and Assine2024; Rajak et al. Reference Rajak, Prabhakar, Banerjee, Dev, George and Tomson2024b, Reference Rajak, Banerjee, George, Dev and Tomson2026). Moreover, the separation of Madagascar and the opening of rifting-related accommodation along the western Indian margin developed the westerly-sloping palaeodrainage system during the Upper Cretaceous (Gombos et al. Reference Gombos, Powell and Norton1995; Biswas, Reference Biswas1999; Li et al. Reference Li, Hu, Garzanti, Banerjee and BouDagher-Fadel2019). Further, Indian Gondwana basins established sedimentary linkages with Antarctic regions, which may have supplied zircons to central India via westerly-flowing rivers in the Narmada basin (Figure 10; Veevers and Tiwari, Reference Veevers and Tewari1995; Veevers & Saeed, Reference Veevers and Saeed2009; Kumari et al., Reference Kumari, Tandon, Kallukalam and Ghatak2023b) (Figure 10; Veevers and Tiwari, Reference Veevers and Tewari1995; Veevers and Saeed, Reference Veevers and Saeed2009; Kumari et al. Reference Kumari, Tandon, Kallukalam and Ghatak2023b). Hence, integrated detrital zircon record, petrography, heavy-mineral data, palaeogeographic reconstructions and sediment dispersal patterns indicate multiple provenances for the Cretaceous Narmada basin (see arrows in Figure 10). The dominant regional supply was from the Indian craton and CITZ-affiliated terranes, with a limited transcontinental input linked to Madagascar and/or Antarctica. Henceforth, the present study illustrates how provenance studies can enhance our understanding of sediment dispersal patterns in the peri-Gondwana rift basins.
6. Conclusions
-
(a) The Cretaceous sandstones of the Songir and Nimar formations are quartz arenites to subarkose. The petrographic and heavy mineral studies of the sandstone suggest predominant sediment sources from magmatic and metamorphic rocks within the craton interior.
-
(b) Tourmaline geochemistry reveals mixed provenance from hornfels and schist of the Champaner Group of the ADFB and granites.
-
(c) Detrital zircon U–Pb ages (>2350, 1850–1500, 1500–1000 and 1000–650) are consistent with derivation from granitoids sources in Bundelkhand and Aravalli cratons, CITZ and possible recycled sources of the Vindhyan and Gondwana basins.
-
(d) The detrital zircon age population 650–460 Ma suggests minor transcontinental sediment input, possibly from Madagascar and Antarctica.
-
(e) The spatio-temporal and stratigraphic distribution of fluvial siliciclastic sediments within the Narmada basin reflects predominant sediment sources from major highlands located to the east and northeast of the basin. The rifting of Madagascar during the Cretaceous influenced the development of westward-sloping palaeodrainage systems and a marine seaway in central India.
Supplementary material
The supplementary material for this article can be found at https://doi.org/10.1017/S0016756826100818.
Acknowledgements
PKR expressed gratitude to IIT Bombay for providing technical infrastructure and financial support from the CSIR, Govt. of India, New Delhi.
Financial support
SB acknowledges the support from the Department of Science and Technology, Government of India, for establishing the FEG-SEM facility at the Department of Earth Sciences, IIT Bombay, through the FIST grant no. SR/FST/ES-II/2019/63.
Competing interests
The authors declare that they have no known competing financial interests or personal relationships that could have appeared to influence the work reported in this article.



 Open access

