

Among the multiple vulnerabilities low-lying coastal areas face due to climate change, progressive water and soil salinization pose particularly serious threats.Footnote 1 Worldwide, about 600 million people currently inhabit low-elevation coastal zones (Wheeler Reference Wheeler2011, Center for International Earth Science Information Network 2010). Increasing salinity from saltwater intrusion will threaten their livelihoods and public health through its effects on agriculture, aquaculture, infrastructure, coastal ecosystems, and the availability of fresh water for household and commercial use. Therefore, understanding the physical and economic effects of salinity diffusion, and planning for appropriate adaptation, will be critical for long-term development and poverty alleviation in countries with vulnerable coastal regions (Brecht et al. Reference Brecht, Dasgupta, Laplante, Murray and Wheeler2012). Although sporadic measurement of soil and water salinity in coastal zones already indicates saline intrusion in many areas, data scarcity has hindered systematic empirical work on salt water intrusion and its impact on livelihoods and adaptation alternatives.
Bangladesh provides an excellent setting for investigation of these issues, because it is one of the countries most threatened by sea level rise and saltwater intrusion. In Bangladesh, about 30 percent of the cultivable land is in coastal areas where salinity is affected by tidal flooding during the wet season, direct inundation by storm surges, and movement of saline ground water during the dry season (Haque, Reference Haque2006). Furthermore, new research indicates that climate change will cause significant changes in soil salinity and river salinity in coastal districts of Bangladesh during the dry season (October to May) by 2050 (Dasgupta et al. Reference Dasgupta, Kamal, Khan, Choudhury, Nishat, Whalley and Pan2015a, Dasgupta et al. Reference Dasgupta, Hossain, Huq and Wheeler2015b). In consequence, the potential impact of salinity has become a major concern for the Government of Bangladesh. Recently, the Bangladesh Climate Change Resilience Fund Management Committee highlighted salinity intrusion in coastal Bangladesh as a critical part of adaptation to climate change.
Increase in salinity is of special concern for rice productionFootnote 2 in Bangladesh because prior research on the sensitivity of rice grain yieldFootnote 3 to salinity has indicated negative effects on various components including stand establishment, panicles, tillers and spikelets per plant, leaf area index, floret sterility, individual grain size, and even the timing of heading (Hasanuzzaman et al. Reference Hasamuzzaman, Fujita, Islam, Ahamed and Nahar2009, Grattan et al. Reference Grattan, Zeng and Roberts2002, Kahtun and Flowers Reference Khatun, Rizzo and Flowers1995). Severely salt-stressed seedlings have smaller and fewer tillers; less root mass; and shorter, thinner, chlorotic leaves compared to control plants not exposed to salinity (Grattan et al. Reference Grattan, Zeng and Roberts2002). Hasanuzzaman et al. (Reference Hasamuzzaman, Fujita, Islam, Ahamed and Nahar2009) reported a decrease in the leaf area index of different varieties of rice with an increase in salinity. The percentage of sterile florets in a given panicle increases with increasing salinity, resulting in reduced rice yield (Grattan, Zhen and Roberts Reference Grattan, Zeng and Roberts2002, Kahtun and Flowers Reference Khatun, Rizzo and Flowers1995, Khatun, Rizzo and Flowers Reference Khatun, Rizzo and Flowers1995). Salinity delays flowering and reduces productive tiller number, fertile florets per panicle, weight per grain, and overall rice grain yield (Khatun et al. Reference Khatun and Flowers1995). In light of these findings, the Ministry of Agriculture in Bangladesh is especially concerned about the likely impact of progressive salinization on rice production in coastal sub-districts (upazilas).
In its National Adaptation Programme of Action (Government of the People's Republic of Bangladesh, Ministry of Environment and Forest 2005), the Government of Bangladesh has assigned high priority to projects related to adaptation of coastal agriculture to increased salinity. Resources will remain scarce, and mobilizing a cost-effective response will require an integrated spatial analysis of salinity diffusion, its socioeconomic and ecological impacts, and the costs of prevention, adaptation, and remediation. The temporal and geographic pattern of appropriate adaptive investments will depend critically on the expected economic effects of salinization in different locations. Our paper attempts to contribute by addressing the consequences of rising soil salinity in Bangladesh's coastal sub-districts for high-yielding-variety (HYV) rice production.
Rice accounts for around 71 percent of the field crop sector, and HYV Boro rice is the highest contributor to rice production of Bangladesh (Shahid Reference Shahid2011). In light of its importance, several studies have assessed the expected impacts of changes in temperature and rainfall on the yield of HYV Boro. For example, a time series analysis for 1972–2002 conducted by Sarker, Alam, and Gow (Reference Sarker, Alam and Gow2012) concluded that maximum temperature had a statistically significant negative effect on the yield of Boro, minimum temperature had a statistically significant positive effect on yield, and rainfall had no effect. Basak et al. (Reference Basak, Ali, Islam and Rashid2010) predicted a 20-percent decline in yield of two varieties of Boro by 2050 in 12 districts of Bangladesh, primarily due to increase in maximum and minimum temperatures. For their research, Basak et al. used the Decision Support System for Agrotechnology Transfer (DSATT) and the regional climate model Providing Regional Climates for Impact Studies (PRECIS).
On the other hand, Thomas et al. (Reference Thomas, Mainuddin, Chiang, Rahman, Haque, Islam, Quasem and Sun2013), using the DSATT crop-modeling software, projected improved Boro yield for IPCC emission scenario A1B by 2050 with high fertilizer levels and variations in planting dates. In their analysis, Thomas et al. first modeled historic crop yield during 1950–2000, and then made projections for four global climate models (GCMs): CNRM, CSIRO, ECHAM5 and MIROC3.2. They found the greatest yield increases for ECHAM, very few areas with declining yields, some areas with yield increases of greater than 20 percent, and the majority of the country with yield increases between 10 percent and 20 percent. The results from CNRM were more pessimistic, with some areas showing yield losses between 10 percent and 20 percent. The CSIRO results were similar to those of CNRM, while the MIROC results were similar to those of ECHAM.
As a winter crop, Boro is primarily dependent on irrigation. Maniruzzaman et al. (Reference Maniruzzaman, Humphreys, Tuong, Buisson, Pukinskis and Phillips2015) examined the availability of surface water and the net irrigation requirement of rice crops in the future under IPCC emission scenarios A1B and A2. They found limited change in irrigation water demand and surface water availability for Boro in their study areas of southern Bangladesh. Shahid's study on irrigation water demand for Boro rice in northwest Bangladesh also concluded that there will be no appreciable changes in total irrigation water requirements due to climate change (Shahid Reference Shahid2011). However, none of these studies accounted for the expected impact of salinity change on Boro yield in a changing climate, and this paper extends the research frontier in that direction.
We conduct our analysis in two steps. First, we focus on the relationship between increased soil salinity and the physical productivity of rice land. Our econometric analysis tests whether or not the yield of HYV rice has been significantly affected by variations in soil salinity across upazilas and over time. Then, with those results in hand, we investigate the impact of future salinity increases. Our findings paint a sobering picture of the impact of rising soil salinity on HYV rice production in the coastal region of Bangladesh. Many upazilas have already suffered large yield losses from rising salinity, and losses will be compounded by further salinity increases in the coming decades. Our estimates suggest that HYV rice output will decline by 15.6 percent in nine coastal upazilas where soil salinity is expected to exceed 4 deciSiemens per meterFootnote 4 before 2050.
The remainder of the paper is organized as follows. Section 2 describes the data and assesses current salinity levels and agricultural production in the coastal region; Section 3 lays the groundwork for our agricultural impact analysis by specifying and estimating an econometric model that measures the upazila-level effect of soil salinity on rice yield. In Section 4, we combine soil salinity projections with econometric estimates from Section 3 to forecast the impact of rising salinity on rice output through 2050. We discuss our findings and conclude the paper in Section 5.
Data
For this research, we assembled a large panel database that includes previously unavailable information on soil salinity and the yield of HYV rice production in 140 upazilas in four regions of southern Bangladesh: Barisal (38 upazilas), Chittagong (30), Dhaka (13), and Khulna (59). Figure 1 identifies the 140 upazilas in the study area, which spans the southern coastal regions of Bangladesh, with extensions to permit assessment of current and future salinity further inland.
Study Regions and Upazilas in Bangladesh

Study teams collected data from local offices in each upazila on HYV rice production and prices, as well as the quantities and prices of inputs (land, labor, seeds, fertilizer, pesticide, and power tillage) for the period 2000–2012.Footnote 5
Figure 2 shows that upazila-level mean yields for the period 2000–2012 vary from 1.2–2.8 tons/acre within the study area, with a particularly heavy concentration of low yields (1.2–1.5 tons/acre) in southern Khulna. In contrast, several upazilas in the northern tier of the study region (central Khulna, southern Dhaka, northern Barisal) have among the highest observed yields (2.3–2.8 tons/acre). Although there is a tendency for low-yield areas to concentrate near the coast and in coastal river estuaries, an evident counter-example is in southern Barisal, where the coastal area includes a cluster of upazilas with relatively high yields.
Mean Yield, HYV Rice (tons/acre): 2000–2012

For soil salinity in coastal Bangladesh, the Soil Research Development Institute (SRDI) provided information recorded at 41 soil monitoring stations for the period 2001–2009. These data have not previously been available for empirical research. Figure 3 presents average monthly station soil salinity measures for 2001–2009, color-coded in five groups for visual comparison. Soil salinity is particularly high in the southwestern coastal region and in Khulna and Satkhira districts.Footnote 6
Mean Salinity Measures for Land Stations (dS/m): 2001–2009

For upazila-level soil salinity, we calculate the weighted mean of measures from monitoring stations within 30 km of the upazila centroid, using weights that are inversely proportional to squared distances.
Our database also includes measures of temperature and rainfall recorded by the Bangladesh Meteorological Department (BMD)’s monitoring stations. For upazila-level temperature and rainfall, we calculate the measures for upazila centroids using data from proximate stations. We calculate weighted mean temperature and rainfall at the upazila centroid using the same distance-weighting approach for GDM weather stations within 50 km. All upazila centroids fall within 50 km of at least one BMD weather station, so our coverage is complete for rainfall and temperature.
For soil salinity, a binding constraint is imposed by the need for observations from monitors within 30 km of upazila centroids, limiting our soil salinity measures to 69 upazilas. Although our data provide a new view of local agricultural production, records obtained from many upazilas have significant gaps in coverage. For the upazila-supplied variables, observations increase by year, from 76 in 2001 to 94 in 2012. The dominant constraint is imposed by land rent, which has far fewer observations than the other variables. Overall, a critical constraint for multivariate estimation is imposed by the requirement of availability for all variables. Complete data are available for only 14 upazilas for eleven years, and 13 in 2011. This limitation has strongly affected the estimation strategy described in the following section.
Relationship between Soil Salinity and HYV Rice Yield
Salinity adversely affects the growth and yield of a rice plant in two main ways: (i) The plant must spend more energy to draw water from the soil into its roots due to osmotic effects of salt, and the process diverts some of the energy that a plant otherwise would use to survive and grow (Bernstein 1995); and (ii) the ion-excess effect of salinity may lead to leaf necrosis, premature leaf drop, lower growth, and reduced yield (Greenway and Munns Reference Greenway and Munns1980).
To test the relationship between soil salinity and HYV rice yield, we maximize degrees of freedom by estimating a reduced-form model that links yield per acre to soil salinity, temperature, and rainfall:Footnote 7, Footnote 8
 $$\eqalign{& ln\; Y_{it} = \beta _0 + \beta _1\; lnT_{it} + \beta _2\; ln\; R_{it} + \beta _3\; ln\; S_{it} + \varepsilon _{it} \cr & {\rm Expectations \!\! :\;} {\rm \beta} _{\rm 1}{ ,} \; {\rm \beta} _{\rm 2}{\rm \lt 0}} $$
where, for upazila i in year t:
Yit = HYV paddy production per acre
Tit = Mean maximum temperature
Rit = Mean rainfall
Sit = Mean soil salinity during the four most saline months, measured by sample electrical conductivity (dS/m)Footnote 9
εit = Random error term with upazila and yearly components
We estimate the effect of soil salinity using both continuous and threshold specifications.Footnote 10 Table 1 presents our estimates for five cases: OLS, two panel estimators (RE, FE), and two spatial panel estimators (Sp,RE; Sp,FE). Panel estimation employs the standard xtreg estimator in Stata. Spatial econometric estimation employs the xsmle estimator in Stata, developed by Belotti, Hughes, and Mortari (Reference Belotti, Hughes and Mortari2014, Reference Belotti, Hughes and Mortari2016), who draw on Cameron, Gelbach and Miller (Reference Cameron, Gelbach and Miller2011), Elhorst (Reference Elhorst, Fisher and Getis2010), Lee and Yu (Reference Lee and Yu2010), and earlier work by Anselin (Reference Anselin2001, Reference Anselin2002), Barrios et al. (Reference Barrios, Diamond, Imbens and Kolesár2010), Kapoor, Kelejian and Prucha (Reference Kapoor, Kelejian and Prucha2007), Kelejian and Prucha (Reference Kelejian and Prucha1998), Kelejian, Prucha, and Yuzefovich (Reference Kelejian, Prucha, Yuzefovich, LeSage and Pace2004), and Kelejian and Prucha (Reference Kelejian and Prucha2006).
Soil Salinity and Yield per Acre in HYV Rice Production
All variables in logs except threshold salinity dummy variables in (6–10)
Dependent variable: Rice yield (metric tons/acre)

Absolute value of t statistics in parentheses
*significant at 5%; ** significant at 1%
Prior experimentation has suggested that 4.0 dS/m is an appropriate bound for estimating salinity threshold effects. Table 2 presents comparative parameter estimates and significance levels for soil salinity using thresholds in the range [1 dS/m – 6 dS/m]. Classical significance is first achieved at 4 dS/m, so we have chosen that threshold for the final regressions.Footnote 11
Spatial Regression Parameter Estimates (Fixed Effects): HYV Yield Impact, Mean Soil Salinity, Highest 4 Months (N = 468)

* significant at 5%
In both continuous and threshold cases, we find highly significant spatial autocorrelation for the 39 upazilas in the sample. The relevant spatial autocorrelation parameters and t-statistics are reported in Table 1. Our estimation exercise incorporates an inverse-distance spatial weights matrix; reported standard errors are robust to spatial autocorrelation (Belotti, et al. Reference Belotti, Hughes and Mortari2016). Inspection of the continuous and threshold results for the spatial estimators shows that the threshold specification is clearly stronger. It produces results for salinity that are highly significant in all cases, while salinity achieves significance in only one of five continuous cases (OLS).Footnote 12 As we note in footnote 12, our results dovetail with field research that finds significant salinity effects only above a threshold value of 4.0 dS/m. In contrast, the continuous model posits a linear relationship between yield and below-threshold salinity that is not consistent with technical research.
Results for the two threshold spatial estimators are nearly identical; we choose fixed effects as the preferred estimator. Table 3 provides information on relative yield sensitivity to salinity, rainfall, and temperature. For each determinant, we use the spatial autocorrelation (FE) results to estimate yields for sample minimum and maximum values, holding the other two determinants constant at their mean levels. Increases from minimum to maximum values produce yield changes of −60.0 percent for soil salinity, −46.3 percent for rainfall, and 80.3 percent for temperature. We conclude that the impact of soil salinity on yields in our sample of upazilas is comparable in magnitude to the impacts of rainfall and temperature.
HYV Yield Impacts: Temperature, Rainfall, Salinity
(Regression-Estimated Impacts at Mean Values for Other Variables)

Our results for temperature and rainfall illustrate the effect of adjusting for spatial autocorrelation in this context. In the continuous and threshold cases, both weather variables are statistically significant in most of the OLS and panel estimates. In the FE panel estimate (8) for threshold salinity, for example, each 1 percent increase in temperature is associated with a 0.94 percent increase in rice yield; each 1 percent increase in rainfall lowers yield by 0.07 percent. After adjustment for spatial autocorrelation in (9) and (10), the estimated impacts of temperature and rainfall remain virtually identical to the panel estimates (7 and 8). The estimated standard errors are larger, however, so both variables lose classical significance.Footnote 13
In summary, our investigation of the relationships linking soil salinity to the yield of HYV rice production indicates that the best-fit relationship between yield and soil salinity is a threshold model in which upazilas whose soil salinity exceeds 4 dS/m have substantially lower yield than their counterparts. With constant acreage and constant priceFootnote 14, lower yield implies that income from rice production declines with salinity. The magnitude of the impact can be expected to vary by upazila, according to local conditions.
Future Salinity and HYV Rice Productivity
The southwest coastal region of Bangladesh already has a serious soil salinity problem from tidal effects, storm surges, and the spread and increasing intensity of river water salinity. The problem is expected to worsen as climate change proceeds (SRDI 2000, SRDI 2010, Dasgupta et al. Reference Dasgupta, Hossain, Huq and Wheeler2014).
Past assessments of salinization have employed a variety of methods. Sarwar (Reference Sarwar2005) and SRDI (1998a, 1998b, 2000, 2010) documented changes in salinity that have accompanied coastal subsidence and thermal expansion of the ocean. These studies typically simulated salinity change in rivers and estuaries using hydraulic engineering models and compared the results with actual measures (Bhuiyan and Dutta Reference Bhuiyan and Dutta2011, Aerts et al. Reference Aerts, Hassan, Savenije and Khan2000, Nobi and Das Gupta Reference Nobi and Gupta1997). In the most comprehensive study to date, Dasgupta et al. (Reference Dasgupta, Kamal, Khan, Choudhury, Nishat, Whalley and Pan2015a) extended recent salinity trends in coastal rivers to 2050 with a projection model that links the spread and intensity of salinity to changes in sea level, temperature, rainfall, and altered riverine flows from the Himalayas for twenty-seven alternative scenarios of climate change. The study provides new estimates of location-specific river salinity through 2050.
In another recent study, Dasgupta et al. (Reference Dasgupta, Hossain, Huq and Wheeler2015b) developed location-specific soil salinity projections for 69 upazilas of coastal Bangladesh through 2050 from climate-induced changes in river salinity and projections of rainfall and temperature based on time trends for 20 Bangladesh Meteorological Department weather stations in the coastal region. The projections are based on a spatial econometric model linking soil salinity to proximate river salinity, land elevation, rainfall, and temperature. The findings indicate that climate change poses a major soil salinization risk for coastal Bangladesh.
In this section, we explore the potential consequences of increased soil salinity for rice yields using soil salinity projections from Dasgupta et al. (Reference Dasgupta, Hossain, Huq and Wheeler2015b). Our sample comprises 69 upazilas with the requisite data in Khulna (29), Barisal (27), Chittagong (9), and Dhaka (4).
To project rice yields, we use the fixed-effects parameter estimates from (10) in Table 1. We incorporate long-term projections of rainfall and temperature that we have produced using data from 20 coastal region BMD weather stations for the period 1990–2012.Footnote 15 The temperature analysis estimates a time trend in a panel regression that includes both station fixed effects and station-specific monthly variations. The rainfall analysis uses the same approach but performs the estimation for log rainfall to ensure positive projections in drier months. Robust regression is employed to ensure against any additional outlier effects. The full results are not reported here, because the regressions include 11 monthly dummies, 19 weather station dummies, and 209 interactions of the monthly and weather station dummies, as well as the time trend.Footnote 16 Table 4 presents the estimates of primary interest: monthly time trends for temperature and rainfall.
Robust Panel Regression Estimates: Temperature and rainfall at 20 BMD weather stations, 1990–2010

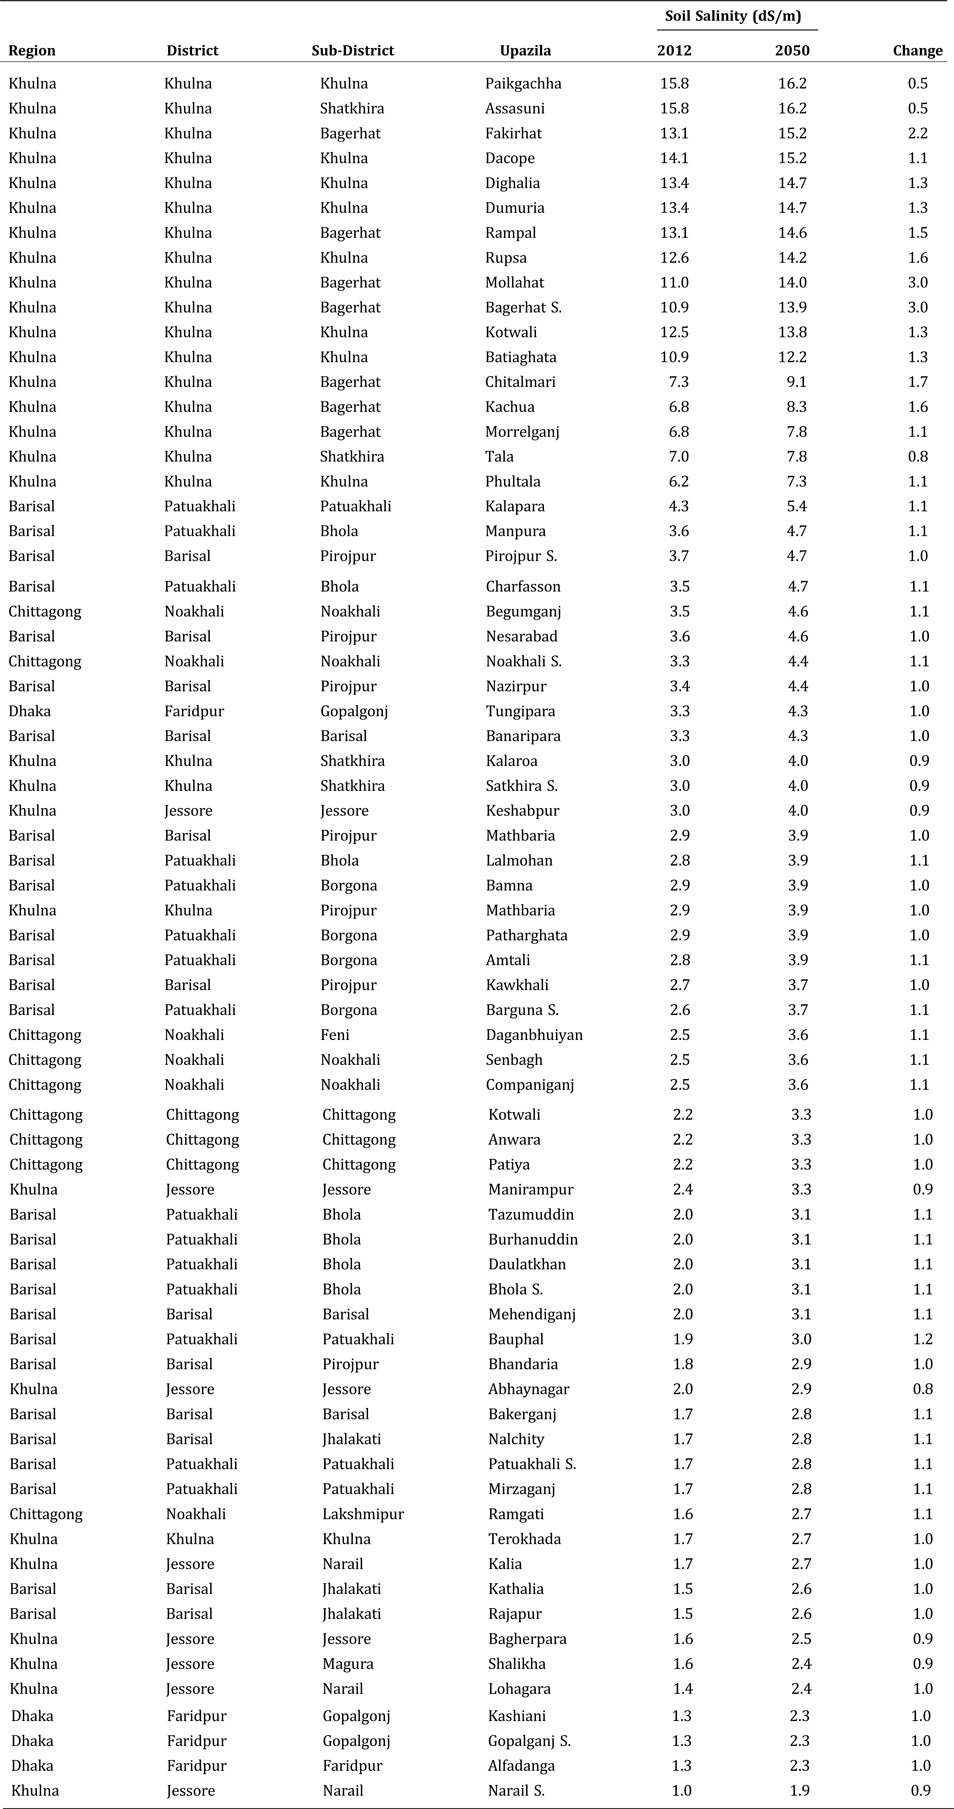
We use the soil salinity estimates from Dasgupta et al. (Reference Dasgupta, Hossain, Huq and Wheeler2015b) (see Appendix Table A1Footnote 17) to project mean soil salinity in the four most saline months from 2012 to 2050. For the 56 upazilas with observations for rice output and acreage in 2012, we calculate initial yield for our projection directly. The remaining 13 upazilas have no yield observations for 2000–2012, so we use mean 2012 yield in their respective regions.
Our exercise sets baseline yield as equal to the yield in 2012 for the entire projection period. For comparison, we identify upazilas with salinity measures lower than 4 dS/m in 2012 and higher than this threshold in 2050. We apply our econometric resultFootnote 18 to these upazilas, reducing baseline yield by 15.55 percent in each year after the 4 dS/m threshold is exceeded.
Table 5 provides information on the threshold status of our sample upazilas. By 2012, 18 have already exceeded the threshold (17 in Khulna and 1 in Barisal). Because the yield-reducing effects have already occurred for these upazilas, their baseline and comparative yields are both set at their 2012 yields for the projection. During the period 2013–2050, soil salinity goes past the threshold value of 4 dS/m in 9 upazilas (Barisal (6), Chittagong (2), Dhaka (1)). For these areas, we reduce baseline yield by 15.55 percent for each year after the threshold is exceeded.
Upazila Salinity Threshold Status by Period

The remaining 42 upazilas remain below the threshold in 2050, so their baseline and comparative yields are set at their 2012 levels. As expected, our output results are skew-distributed, with large declines confined to upazilas that pass the 4 dS/m threshold during the projection period.
We consolidate the upazila projections into projections at the regional level. In Barisal, where 6 upazilas reach the threshold of 4 dS/m during the projection period, the impact on yields is sufficient to reduce output by 7.7 percent. In Chittagong, which has fewer upazilas in the sample, rising soil salinity in two upazilas exceeds the 4 dS/m threshold before 2050. The result is a 5.6 percent reduction in output for the region. Dhaka has only one upazila that crosses the threshold during the projection period, so its output declines by 1.1 percent. Finally, Khulna begins the projection period with several upazilas already beyond the salinity threshold. No upazila crosses the threshold during the projection period, so Kulna's output decline is 0 percent.
Potential future changes in soil salinity are also highlighted in Table 6, which tabulates upazilas by soil salinity group in 2012 and 2050.
Upazilas by Soil Salinity Class, 2012 and 2015

There are 21 upazilas with measures between 1.0 and 2.0 dS/m in 2012, but only 1 upazila remains in this group by 2050. The number of upazilas in the next group (2.0–3.0 dS/m) remains nearly constant during the projection period, but the population of the near-threshold group (3.0–4.0 dS/m) doubles, from 12 to 24. Although the period after 2050 is beyond our projection interval, these results strongly suggest that 24 more upazilas will cross the threshold within a few decades after 2050 and therefore experience significant decline in the output of HYV rice.
Discussion and Conclusions
Agriculture is an important economic sector in Bangladesh, contributing 13.1 percent of gross domestic product and employing 47.5 percent of the labor force (BBS 2010). In 2012–2013, Bangladesh produced 33.8 million tons of rice, including 18.8 million tons of winter rice. Therefore, the potential impact of salinity on HYV winter rice has become a major concern for the government of Bangladesh and its affiliated research institutions.
Prior research on this issue using local surveys and descriptive statistics suggests significant agricultural productivity losses from rising soil salinity (Karim, Hussain and Ahmed Reference Karim, Hussain and Ahmed1990, World Bank 2000, Rahman and Ahsan Reference Rahman and Ahsan2001, Petersen and Shireen Reference Petersen and Shireen2001, Hassan and Shah Reference Hassan and Shah2006, Haque Reference Haque2006, UK DEFR 2007, Mahmood et al. Reference Mahmood, Najneen, Hoque, Rahman and Shamim2010, Thomas et al. Reference Thomas, Mainuddin, Chiang, Rahman, Haque, Islam, Quasem and Sun2013).Footnote 19 Thomas et al. (Reference Thomas, Mainuddin, Chiang, Rahman, Haque, Islam, Quasem and Sun2013) provided a detailed technical assessment of potential climate impacts on agriculture in Bangladesh, using projections from several global climate models and technical parameters incorporated in available crop-modeling software. While the authors provide results from a survey of farmers on sources of crop losses,Footnote 20 including soil salinity, they do not attempt to mobilize the requisite data for direct estimation of salinity impacts.
In this paper, we have developed, estimated, and applied a system for projecting the impact of rising soil salinity on outputs of HYV rice in the upazilas of coastal Bangladesh. We estimate the impact of soil salinity on agriculture using spatial econometric methods. Our estimation exercise indicates that HYV rice yield is significantly (15.6 percent) lower in upazilas where soil salinity is greater than 4 dS/m.
In the projection section of the paper, we use our econometric yield model to forecast the future impact of soil salinity on rice outputs. We project output declines of 15.6 percent in 9 upazilas that cross the 4 dS/m salinity threshold before 2050. Our results also suggest that losses beyond 2050 are likely to exceed the projected losses before 2050, because the number of upazilas crossing the 4 dS/m threshold after 2050 (24) greatly exceeds the number projected to cross the threshold between 2012 and 2050 (9).
Our results paint a sobering picture of the impact of rising soil salinity on HYV rice production in the coastal region of Bangladesh. The problem is most severe in the southwest coastal regionFootnote 21, as the region already has a serious problem from the spread and increasing intensity of salinization of river water and soil, and it is feared that the problem of salinity will worsen due to the changing climate.Footnote 22 Many upazilas in the southwest coastal region have already suffered large yield losses from rising salinity, and coastal region losses will be compounded by further salinity increases in the coming decades. This inexorable process will continue as long as the sea continues to rise and salinity increases in coastal rivers. We see no prospect for near-term relief, because rising global greenhouse gas emissions continue to propel rapid climate change and melting of the polar ice caps.
In densely populated and land-scarce Bangladesh, poor households are disadvantaged with respect to land access. Many end up settling in low-lying coastal areas that are vulnerable to salinity incursion and inundation from sea level rise and storm surges. A poverty-mapping exercise by the Bureau of Statistics in Bangladesh, the World Bank, and the World Food Programme (World Bank, World Food Programme, and Bangladesh Bureau of Statistics 2010) estimates that around 11.8 million poor people were located in 19 coastal districts in 2010. Alarmingly, this figure includes many extremely poor households that are not even able to afford adequate nutrition. This problem will almost certainly be aggravated by declining rice productivity as soil salinization increases. Other health- and infrastructure-related impacts are also likely, and future research should focus on their implications for poor households.
The government of Bangladesh is aware of the expected adverse effects of climate change on HYV rice production in the coastal region, and it has invested in promoting suitable adaptation measures. The Bangladesh Rice Research Institute is conducting research on salt-resistant varieties of rice. One salt-resistant strain, BRRI Dhan 47, was released by the country's National Seed Board in 2007, and it can be found in a growing number of coastal community markets at the same price as conventional rice.Footnote 23 Another salt resistant variety, BINA Dhan 10, was introduced by the Bangladesh Institute of Nuclear Agriculture in 2012. Government agricultural extension officials are providing training in cultivation of salt-resistant varieties. However, the future of these initiatives will depend on their relative profitability as well as on the adaptability of farmers and acceptance by consumers (for example, see Greiner and Gregg Reference Greiner and Gregg2011). Compilation of location-specific adaptation alternatives and the cost of adaptation options are subjects of our ongoing research.
We believe the analysis in this paper also will be of interest to other developing countries with low-lying coastal areas. Given the general lack of studies on diffusion and impacts of salinity in the developing world, we hope that our analysis will raise awareness and prompt countries (at least those for which inundation from SLR has been identified as a major problem associated with climate change) to initiate detailed, location-specific assessments of potential impacts of salinity in coastal areas, including analyses of the impacts on agriculture and other socioeconomic impacts of salinity changes.Footnote 24 Such estimates may then trigger actions aimed at facilitating increased resilience of coastal agriculture and developing alternative livelihood options for coastal communities exposed to imminent salinity risks.
Soil Salinity by Upazila, 2012 and 2050


 Open access

