


Introduction
Lentil (Lens culinaris Medik.) is an important protein crop. It is a diploid (2n = 2x = 14) and possesses a large genome (~4 Gbp) (Arumuganathan and Earle, Reference Arumuganathan and Earle1991). It ranks fifth, after dry beans, chickpea, dry peas and cowpea, for pulses production in the world (FAOSTAT, 2017). The current global lentil production is estimated at 6.33 million metric tons and falls short of the global demand which is expected to increase soon due to rapid population growth and plant protein market (Reda, Reference Reda2015). In order to bridge the demand-supply gap, efforts are required to accelerate the genetic gain, which is abysmally low mainly due to the narrow genetic base of cultivated lentil. This presents a serious barrier towards developing cultivars for future needs (Lombardi et al., Reference Lombardi, Materne, Cogan, Rodda, Daetwyler, Slater, Forster and Kaur2014; Khazaei et al., Reference Khazaei, Caron, Fedoruk, Diapari, Vandenberg, Coyne, McGee and Bett2016). Integration of genomic tools with conventional breeding approaches would help to alleviate bottlenecks by improving selection efficiency and speed up the breeding process in developing improved cultivars.
Recent efforts on increasing the utilization of plant genetic resources (PGRs) has focused on leveraging genomic tools to unlock the genetic potential of ex situ collections held in national and international gene banks all over the world (McCouch et al., Reference McCouch, McNally, Wang and Hamilton2012, Reference McCouch, Baute, Bradeen, Bramel, Bretting, Buckler, Burke, Charest, Cloutier, Cole, Dempewolf, Dingkuhn, Feuillet, Gepts, Grattapaglia, Guarino, Jackson, Knapp, Langridge, Lawton-Rauh, Lijua, Lusty, Michael, Myles, Naito, Nelson, Pontarollo, Richards, Rieseberg, Ross-Ibarra, Rounsley, Hamilton, Schurr, Stein, Tomooka, van der Knaap, van Tassel, Toll, Valls, Varshney, Ward, Waugh, Wenzl and Zamir2013; Mascher et al., Reference Mascher, Schreiber, Scholz, Graner, Reif and Stein2019). The linkage between genomic characterization and PGR on a global scale can assist with the future challenges to agricultural production such as climate change (Zimmerer and De Haan, Reference Zimmerer and De Haan2017). Even without significant genotypic information for most crops, the USDA germplasm distributions doubled from 2006 to 2012 (Heisey and Rubenstein, Reference Heisey and Rubenstein2015). For plant scientists, and especially plant breeders, access to new positive alleles is paramount for gradual and sustainable genetic gains over the breeding cycles. This requires the utilizing genomic-based tools specifically for genomic-assisted breeding (Varshney et al., Reference Varshney, Singh, Hickey, Xun, Marshall, Wang, Edwards and Ribaut2015), genomic selection (Annicchiarico et al., Reference Annicchiarico, Nazzicari, Pecetti, Romani, Ferrari, Wei and Brummer2017) and breeding-assisted genomics, the recent paradigm switch suggested by Poland (Reference Poland2015).
Recent technological advances are facilitating the expansion of genomic resources for food crops, particularly for pulse crops, in recent years (Varshney, Reference Varshney2016). It is mainly due to the notable reduced costs in sequencing and a surge in bioinformatics tool development (Varshney et al., Reference Varshney, Sinha, Singh, Kumar, Zhang and Bennetzen2020). Many pulse genomes that have been sequenced include pea, lentil, common bean, kabuli chickpea, desi chickpea, cowpea and pigeonpea (Varshney et al., Reference Varshney, Chen, Li, Bharti, Saxena, Schlueter, Donoghue, Azam, Fan, Whaley and Farmer2012, Reference Varshney, Song, Saxena, Azam, Yu, Sharpe, Cannon, Baek, Rosen, Tar'an and Millan2013; Jain et al., Reference Jain, Misra, Patel, Priya, Jhanwar, Khan, Shah, Singh, Garg, Jeena and Yadav2013; Schmutz et al., Reference Schmutz, McClean, Mamidi, Wu, Cannon, Grimwood, Jenkins, Shu, Song, Chavarro, Torres-Torres, Geffroy, Moghaddam, Gao, Abernathy, Barry, Blair, Brick, Chovatia, Gepts, Goodstein, Gonzales, Hellsten, Hyten, Jia, Kelly, Kudrna, Lee, Richard, Miklas, Osorno, Rodrigues, Thareau, Urrea, Wang, Yu, Zhang, Wing, Cregan, Rokhsar and Jackson2014; Ogutcen et al., Reference Ogutcen, Ramsey, von Wettberg and Bett2018; Kreplak et al., Reference Kreplak, Madoui, Cápal, Novák, Labadie, Aubert, Bayer, Kishore, Symes, Main, Klein, Bérard, Fukova, Fournier, d'Agata, Belser, Berrabah, Šimková, Lee, Kougbeadjo, Térézol, Huneau, Turo, Mohellibi, Neumann, Falque, Gallardo-Guerrero, McGee, Tar'an, Bendahmane, Aury, Batley, Le Paslier, Ellis, Warkentin, Coyne, Salse, Edwards, Lichtenzveig, Macas, Doležel, Wincker and Burstin2019; Lonardi et al., Reference Lonardi, Muñoz-Amatriaín, Liang, Shu, Wanamaker, Lo, Tanskanen, Schulman, Zhu, Luo, Alhakami, Ounit, Hasan, Verdier, Roberts, Santos, Ndeve, Doležel, Vrána, Hokin, Farmer, Cannon and Close2019, respectively). Currently, genotyping by sequencing (GBS) is increasingly popular among pulse breeders to screen germplasm quickly and inexpensively (e.g. Guindon et al., Reference Guindon, Martin, Cravero, Gali, Warkentin and Cointry2019; Ma et al., Reference Ma, Marzougui, Coyne, Sankaran, Main, Porter, Mugabe, Smitchger, Zhang, Amin and Rasheed2020). As a high throughput approach, GBS in lentil has facilitated the discovery of genome-wide (SNPs), development of high-density linkage maps and assessment of the genetic diversity in the germplasm collection (Temel et al., Reference Temel, Göl, Akkale, Kahriman and Tanyolac2015; Wong et al., Reference Wong, Verma, Ramsay, Yuan, Caron, Diapari, Vandenberg and Bett2015; Khazaei et al., Reference Khazaei, Fedoruk, Caron, Vandenberg and Bett2017a, Reference Khazaei, Podder, Caron, Kundu, Diapari, Vandenberg and Bettb; Ma et al., Reference Ma, Marzougui, Coyne, Sankaran, Main, Porter, Mugabe, Smitchger, Zhang, Amin and Rasheed2020).
The International Centre for Agricultural Research in the Dry Areas (ICARDA) has a global mandate for the genetic improvement of lentil. The ICARDA lentil reference set (Kumar et al., Reference Kumar, Rajendran, Kumar, Hamwieh and Baum2015), representing the major production and geographical (51 countries) regions, was phenotyped for economically important traits, but was genotyped with only microsatellites. The objectives of this project were to (1) construct a public available lentil SNP genotype set for internationally available lentil PGRs, (2) explore the population structure and diversity, and (3) assess the genotyped collection for possible marker identification (allelic contribution/function) for agronomic traits using genome-wide association study (GWAS) by data mining historical data collected by ICARDA.
Materials and methods
Plant material and field data
In this study, the ICARDA Reference Plus collection of 176 lentil lines (130 Generation Challenge Program (GCP)) reference set (Furman, Reference Furman2006; Kumar et al., Reference Kumar, Rajendran, Kumar, Hamwieh and Baum2015), plus 39 abiotic stress-tolerant lines and seven recombinant inbred lines parents were selected based on phenotypic diversity from the world lentil germplasm collection held by ICARDA (online Supplementary Table S1). The field data presented in online Supplementary Table S2 were historic data collected by ICARDA (e.g. Migicovsky et al., Reference Migicovsky, Gardner, Money, Sawler, Bloom, Moffett, Chao, Schwaninger, Fazio, Zhong and Myles2016; González et al., Reference González, Weise, Zhao, Philipp, Arend, Börner, Oppermann, Graner, Reif and Schulthess2018a). Plant materials were grown using an α-lattice design with two replicates at two ICARDA experiment stations: (1) Tel Hadya, Syria and (2) Terbol, Lebanon, from 2007 to 2011. During the crop growing period, all crop management practices typical for the area were followed. Lines were phenotyped for days to first flower (number of days from sowing to the appearance of the first flower); plant height (average height of five plants from the ground to the tip of the foliage at maturity); seeds per pod (average number of seeds in 10 randomly chosen dry pods); days to maturity (number of days from sowing until 90% of the pods were golden brown); biomass yield of each plot (weight of dried mature plants in a plot); seed yield (seed yield of a plot after threshing, expressed as kg/ha); straw yield (calculated as the difference between biomass yield and seed yield); harvest index (calculated as the ratio of seed to biomass yield); and hundred-seed weight (average weight of two samples of 100 randomly chosen seeds in g). Phenotypic values were also combined across years and averaged in cases of replication for a particular accession (online Supplementary Table S2; Supplementary Fig. S1).
Genotyping
DNA was extracted, using a DNeasy Plant Kit (QIAGEN, Valencia, CA), from a single plant per accession grown in the greenhouse at the USDA-ARS Western Regional Plant Introduction Station in Pullman, WA in 2013. DNA was quantified using a spectrophotometer (Nano-Drop Technologies, Wilmington, DE, USA).
The two-enzyme genotyping-by-sequencing procedure of Poland et al. (Reference Poland, Brown, Sorrells and Jannink2012) was followed using the modifications of Wong et al. (Reference Wong, Verma, Ramsay, Yuan, Caron, Diapari, Vandenberg and Bett2015). Briefly, 200 ng of genomic DNA was double-digested with PstI and MspI and ligated to two adapters, of which one contained a barcode sequence. Samples were pooled, PCR amplified and cleaned up using a column (Qiagen QIAquick PCR Purification Kit). Four libraries of 48 bar-coded samples were sequenced in four lanes using an Illumina HiSeq2000 by the Vincent J. Coates Genomics Sequencing Laboratory at the University of California, Berkeley.
Genotypic data analysis
The sequencing data were processed to remove low-quality data and analysed using ‘Stacks’ software (Catchen et al., Reference Catchen, Hohenlohe, Bassham, Amores and Cresko2013). Unfiltered Fastq sequence Illumina data were assigned to individual samples via the barcode sequence using ‘Stacks’ software (Catchen et al., Reference Catchen, Amores, Hohenlohe, Cresko and Postlethwait2011, Reference Catchen, Hohenlohe, Bassham, Amores and Cresko2013). The RAD-Tags algorithm was used to examine raw reads from Illumina sequencing runs by checking that the barcode and the RAD cut-site are intact, and at the same time de-multiplex the data. The default parameters of the ‘Stack’ software were used to call the SNPs. ‘Stacks’ uses short-read sequence data to identify and genotype loci in a set of individuals and in-house scripts generated a VCF format genotype data file.
A second analysis was conducted using FreeBayes software (Garrison and Marth, Reference Garrison and Marth2012) to call the variants using the lentil reference genome, Lc1.2 of ‘CDC Redberry’ (Ramsay et al., Reference Ramsay, Chan, Sharpe, Cook, Penmetsa, Chang, Coyne, McGee, Main, Edwards, Kaur, Vandenberg and Bett2016; Bett, Reference Bett2020). Analyses of pipeline details are presented in Yu et al. (Reference Yu, Zheng, Bhamidimarri, Liu and Main2017). Briefly, the SNPs were identified with the lentil reference genome version Lc1.2 using BamTools (Barnett et al., Reference Barnett, Garrison, Quinlan, Strömberg and Marth2011) and the FreeBayes variant caller (https://github.com/ekg/freebayes) (Garrison, Reference Garrison2012; Garrison and Marth, Reference Garrison and Marth2012). The 50% missing data were used as a minimum to keep the variant in the final filtered VCF file to give future users of the SNP data flexibility on filtering without resorting to reanalysing the raw data (Glaubitz et al., Reference Glaubitz, Casstevens, Lu, Harriman, Elshire, Sun and Buckler2014; O'Leary et al., Reference O'Leary, Puritz, Willis, Hollenbeck and Portnoy2018).
Structure and diversity
The genetic structure of the collection was determined using the software STRUCTURE (Pritchard et al., Reference Pritchard, Stephens and Donnelly2000). PGDSpider software was used to convert the *.VCF file to the STRUCTURE software format (Lischer and Excoffier, Reference Lischer and Excoffier2012). Parameter set included a 10,000 burn-in period, 10,000 Markov Chain Monte Carlo (MCMC) replications, admixture model, run for each subpopulation (K) value ranging from 1 to 7. The best K value was determined by plotting the rate of change in the log probability of data (ΔK) against the successive K values (Evanno et al., Reference Evanno, Regnaut and Goudet2005) implemented in STRUCTURE HARVESTER (Earl and von Holdt, Reference Earl and von Holdt2012). The K value was considered to be optimum while ΔK reaches the maximum. A tree was constructed in NTSys-pc using Prevosti's Distance substituting the probability of assignment to each population at K = 3 for allele frequency (Rohlf Reference Rohlf2009). The distance matrices were used to produce a dendrogram based on clustering using the unweighted pair-group method with arithmetic averages (UMGMA) in the SAHN module of NTSYS-PC program version 2.02 k (Rohlf, Reference Rohlf2009). A tree view was created using the distance matrix and UPGMA (Sneath and Sokal, Reference Sneath and Sokal1973) clustering method modules in STRUCTURE. Genetic diversity between subpopulations as determined by the STRUCTURE software was calculated using Analysis of Molecular Variance (AMOVA) which calculates PhiPT (Excoffier et al., Reference Excoffier, Smouse and Quattro1992). Phi-statistics is a modified version of Wright's F that refers to the relative contributions of between-subpopulation separation to the overall genetic variation in the whole sample. The variance components are used to calculate phi-statistics which are analogous to Wright's F-statistics, ΦST = (σ 2a + σ 2b)/σ 2T (Schneider et al., Reference Schneider, Roessli and Excoffier2000). AMOVA was calculated using the ‘Distance’ and ‘AMOVA’ functions in GenAlEx 6.5 (Peakall and Smouse, Reference Peakall and Smouse2006, Reference Peakall and Smouse2012). Principal component analysis (PCA) was conducted using the ‘PCA’ module in TASSEL using the SNP data and graphed using SigmaPlot Version 13.0 (Systat Software, San Jose, CA, USA) (Bradbury et al., Reference Bradbury, Zhang, Kroon, Casstevens, Ramdoss and Buckler2007).
GWAS
The GWAS was conducted using phenotypic data means collected from 2007 to 2011 (online Supplementary Table S2) held in the lentil germplasm database of ICARDA using the GLM-PCA batch commands in the software TASSEL 5.2.29 (Bradbury et al., Reference Bradbury, Zhang, Kroon, Casstevens, Ramdoss and Buckler2007). SNPs were filtered to a maximum of 15% of the lines missing the SNP call with a minimum allele frequency of 0.05 (Glaubitz et al., Reference Glaubitz, Casstevens, Lu, Harriman, Elshire, Sun and Buckler2014; O'Leary et al., Reference O'Leary, Puritz, Willis, Hollenbeck and Portnoy2018). Marker-trait associations (MTAs) were analysed for hundred-seed weight, days to flower, plant height, days to maturity, seeds per pod, biomass yield, seed yield, and harvest index using a generalized linear model and a population stratification (structure) correction based on principal component (3) analysis (PCA) (Price et al., Reference Price, Patterson, Plenge, Weinblatt, Shadick and Reich2006). The significance of associations between SNPs and traits was based on the threshold P < 1.57 × 10⁻⁴, a modified Bonferroni correction calculated by dividing 1 by the total number of SNPs (6373) in the analysis (Li et al., Reference Li, Chen, Xu, Gao, Yan, Qiao, Li, Li, Li, Xiao and Zhang2016).
Results
The non-reference (de novo) pipeline identified 11,225 SNPs in the 176 accessions originating from 51 countries. The SNP dataset from the de novo analysis was further filtered allowing for 15% missing data which left 1021 SNPs, i.e. SNP calls were available in 85% of the accessions. Reanalysing the variants using FreeBayes and the lentil reference genome version Lc1.2 (Ramsay et al., Reference Ramsay, Chan, Sharpe, Cook, Penmetsa, Chang, Coyne, McGee, Main, Edwards, Kaur, Vandenberg and Bett2016; Ogutcen et al., Reference Ogutcen, Ramsey, von Wettberg and Bett2018) increased the SNPs identified to 22,555. These SNPs were filtered allowing for the same 15% missing data and increased the SNPs sixfold to 6373 versus 1021 de novo called variants. Finally, allowing for no missing data, the number of SNPs was 4195 using the reference-based FreeBayes analysis versus zero SNPs for the de novo Stack pipeline.
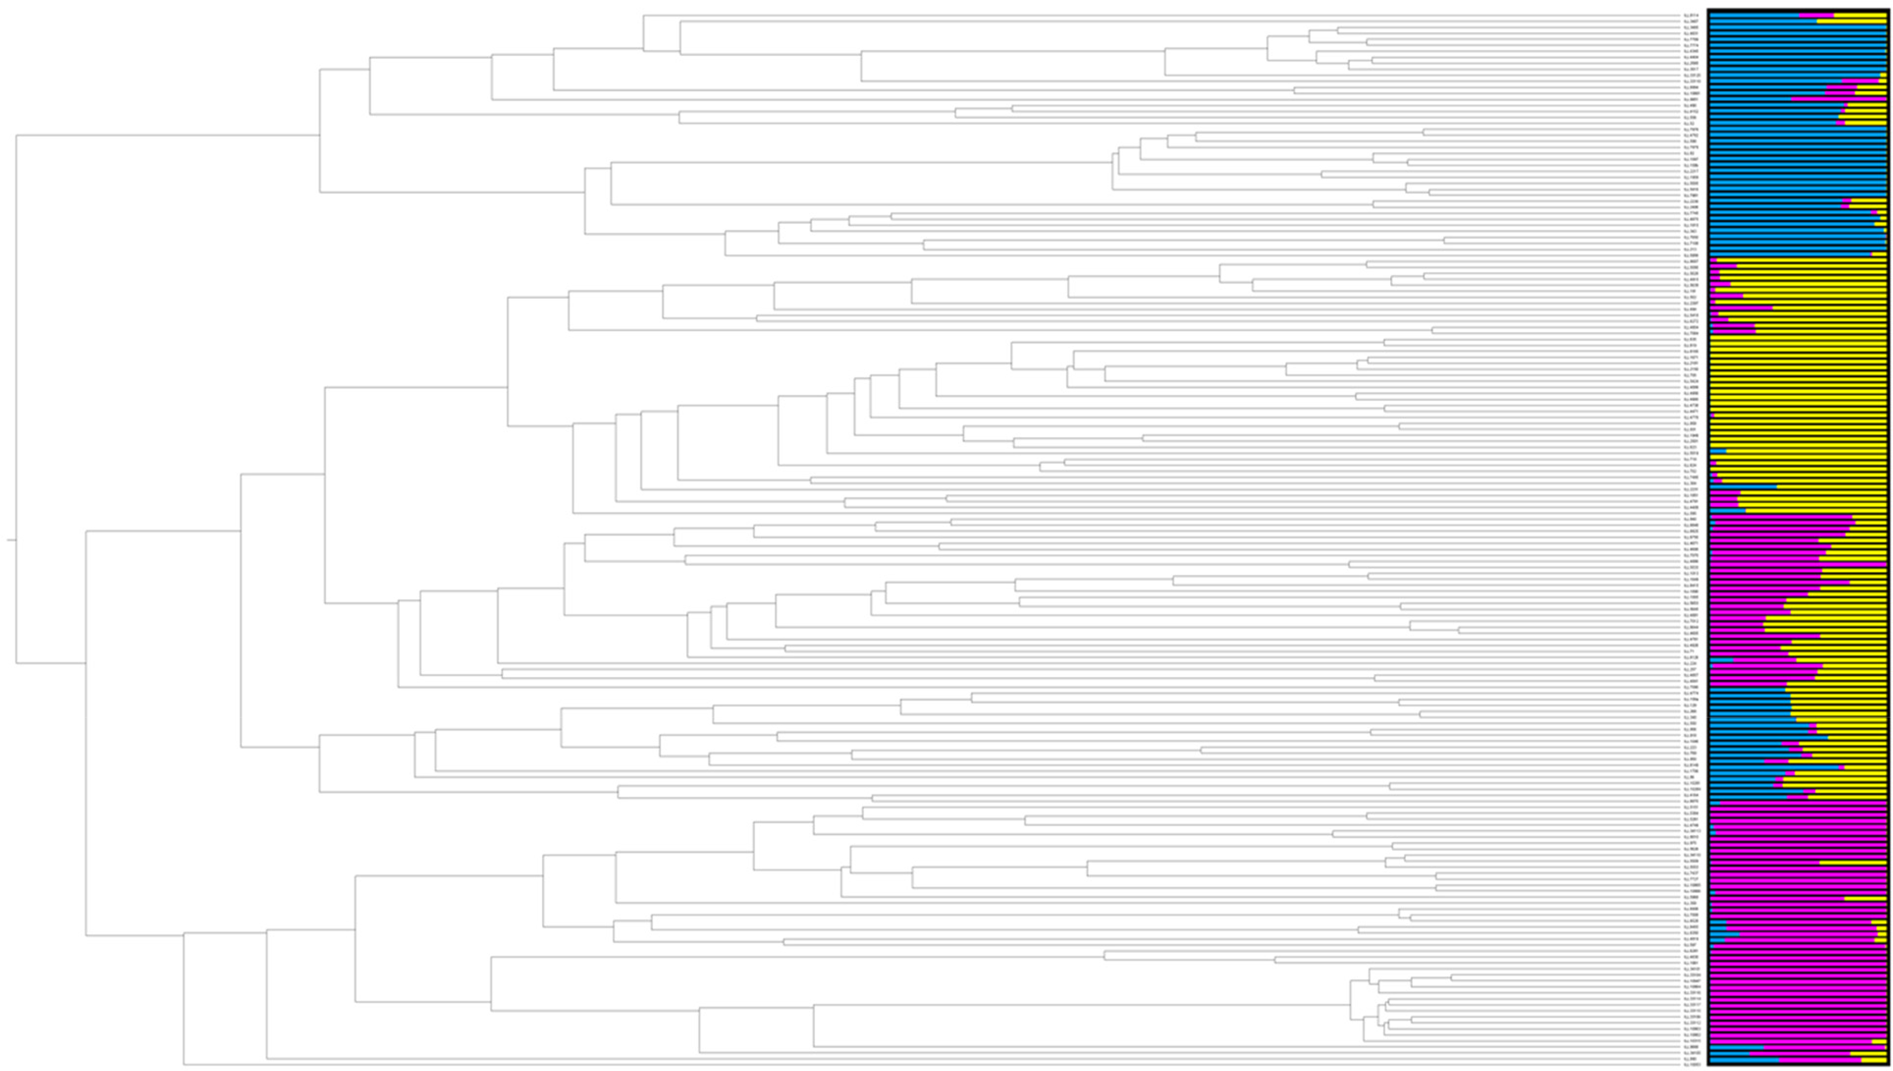
The collection of 176 accessions was analysed for subpopulation structure using two methods: a Bayesian clustering method (online Supplementary Table S3) and PCA based on the SNP genotypes. In the Bayesian approach, first proposed by Pritchard et al. (Reference Pritchard, Stephens and Donnelly2000), the Evanno method used to determine the number of subpopulations supports k = 3 with far lower support for k = 5 (Evanno et al., Reference Evanno, Regnaut and Goudet2005). Both Bayesian and PCA methods indicated three subpopulations (Figs. 1 and 2). Further, the UPGMA tree is also in agreement with the STRUCTURE software clustering subpopulations (Fig. 3; online Supplementary Figs. S1, S2; Supplementary Table S3). One cluster of the dendrogram contained most of the admixture accessions (Fig. 1). Genetic diversity among and between subpopulations was calculated using AMOVA (Excoffier et al., Reference Excoffier, Smouse and Quattro1992). The partition of total genetic diversity within the three (k = 3) subpopulations was 74% and among the three subpopulations was 26%. ΦPT value was 0.256, P > 0.001.
The subpopulations of K = 3 as determined by the ad hoc statistic ΔK based on the rate of change in the log probability of data between successive K = 1–7 (Evanno et al., Reference Evanno, Regnaut and Goudet2005).

Dendrogram based on UPGMA and the subpopulations (K = 3) calculated using the Bayesian clustering method of the software STRUCTURE based on SNP data for 176 lentil accessions (Pritchard et al., Reference Pritchard, Stephens and Donnelly2000).
Principal component analysis of 176 lentil accessions at K = 3 based on SNP genotyping. Colours correspond to greater than 50% association with a subpopulation and colours correspond to Fig. 3. White accessions are admixtures. Further views available in online Supplementary Material (Fig. S2).

Frequency histograms of the phenotypic data are presented in online Supplementary Fig. S1. The MTAs were identified across five chromosomes for four traits: days to first flower, days to maturity, seeds per pod, and 100-seed weight (Table 1; online Supplementary Fig. S3). The range of variance explained by the MTAs for the four traits ranged from R 2 = 0.10 to 0.17. The associations are moderate (Table 1). For days to flower, two MTAs were found on chromosome 3. The most MTAs were found for days to maturity, eight MTAs on chromosomes 2, 3, 5, 6 and 7. Two MTAs were found for seeds per pod on chromosomes 2 and 7. For 100-seed weight, one MTA was identified on chromosome 2.
Significant SNP markers identified using genome-wide associations for four traits based on ICARDA's historical phenotypic data collected from 2007 to 2011

Discussion
Genotyping of PGRs has spurred discoveries of the genetic control of important agronomic traits in several crops. For example, SNP genotyping of the entire USDA + 18 K soybean collection has been used in 124 research studies (Song et al., Reference Song, Hyten, Jia, Quigley, Fickus, Nelson and Cregan2015). Genotyping-by-sequencing has been a useful approach for genotyping and analysis of lentil PGRs. Wong et al. (Reference Wong, Verma, Ramsay, Yuan, Caron, Diapari, Vandenberg and Bett2015) were the first to report the use of the two-enzyme GBS approach of Poland et al. (Reference Poland, Brown, Sorrells and Jannink2012) in lentil and identified 266,356 genome-wide SNPs before filtering. After filtering to 20% missing SNP data, the final dataset was 32,019 SNPs. In comparison, filtering the ICARDA Lentil Reference Plus SNP set to 20% missing data in the present study resulted in fewer SNPs but still a useful set of 11,171. Recently, a single enzyme GBS of lentil resulted in the discovery of 6693 SNPs (Pavan et al., Reference Pavan, Bardaro, Fanelli, Marcotrigiano, Mangini, Taranto, Catalano, Montemurro, De Giovanni, Lotti and Ricciardi2019). While fair genome coverage was gained through these GBS experimental designs, a lentil exome capture resource has now been developed (Ogutcen et al., Reference Ogutcen, Ramsey, von Wettberg and Bett2018). This approach will enhance the coverage of the transcribed genes and perhaps improve the success in identifying causal genes and alleles. However, the cost is significantly higher for the lentil exome capture sequencing approach compared to GBS. Therefore, GBS is still a good option for SNP discovery and diversity studies in lentil.
The ICARDA Lentil Reference Plus collection subpopulation (K = 3) result is similar to a larger lentil genetic diversity study of 352 accessions by Khazaei et al. (Reference Khazaei, Caron, Fedoruk, Diapari, Vandenberg, Coyne, McGee and Bett2016). However, the populations they reported (K = 3) separated into three geographic regions: South Asia, Mediterranean and northern temperate. In contrast, the ICARDA Reference Plus collection's subpopulations did not stratify geographically. One aspect to consider is the ICARDA Reference Plus collection includes 20% breeding lines involving parents from different geography and elite lines thus listed as unknown origin in the ICARDA database. Lombardi et al. (Reference Lombardi, Materne, Cogan, Rodda, Daetwyler, Slater, Forster and Kaur2014) also reported three subpopulations studying 505 cultivars and landraces but found weaker geographic clustering outside of a breeding program cluster. Idrissi et al. (Reference Idrissi, Piergiovanni, Toklu, Houasli, Udupa, De Keyser, Van Damme and De Riek2018) reported subpopulations of two studying 74 Mediterranean lentil landraces stratifying geographically detecting a northern gene pool composed of Turkish, Italian and Greek landraces, and a southern gene pool composed of Moroccan landraces. A larger study of the genetic diversity of the Mediterranean ex situ lentil collection (n = 349) held at the Italian National Research Council also partitioned into two subpopulations with lower support for three and five subpopulations using the Evanno method (Pavan et al., Reference Pavan, Bardaro, Fanelli, Marcotrigiano, Mangini, Taranto, Catalano, Montemurro, De Giovanni, Lotti and Ricciardi2019).
Two other diversity studies have been published on the ICARDA lentil collection using genetic markers. The work of Hamwieh et al. (Reference Hamwieh, Udupa, Sarker, Jung and Baum2009) detected two clusters in the ICARDA core collection using 26 microsatellites and UPGMA and PCA analyses. Their collection of 109 accessions (52% wild Lens spp.) overlaps our set by only five accessions. An earlier study of an ICARDA set (308 accessions) that included the Lens wild relatives (175 accessions) used 22 expressed sequence tags (ESTs) and found eight subpopulations (K = 8) using the same Evanno method to select the best fitting model (Alo et al., Reference Alo, Furman, Akhunov, Dvorak and Gepts2011). Lens culinaris ssp. culinaris accessions clustered into two subpopulations, the other six subpopulations were single taxon wild accessions. The Alo et al. (Reference Alo, Furman, Akhunov, Dvorak and Gepts2011) ICARDA set overlaps our study by nine accessions.
For GWAS, precise phenotypic quantitative trait values are required. The data available for our test were the historical data from ICARDA collected over 5 years, not an experiment per se. Further, quantitative trait data, particularly days to flower, days to maturity and seed weight are known to have a genotype by environment interaction (Abbo et al., Reference Abbo, Ladizinsky and Weeden1992; Singh et al., Reference Singh, Singh, Gil, Kumar and Sarker2009; Kahriman et al., Reference Kahriman, Temel, Aydogan and Tanyolac2015). Also, our GWAS experiment might have been affected by the use of phenotypic means from different years. Nonetheless, interesting single-SNP defined regions were identified for four traits: days to first flower, days to maturity, seeds per pod and seed weight. These results will be useful for future meta-analyses as more lentil GWAS studies are published for agronomic traits. Days to first flower was highly significantly correlated with days to maturity and the chromosome 3 MTAs for these two traits are in the same region. One hundred seed weight was significantly negatively correlated with seeds per pod and had no correlation to days to maturity. Comparison with earlier QTL studies is limited by the lack previously of a lentil consensus linkage map so numbering of linkage groups was not consistent. An early genetic study using isozymes, RAPDs and RFLPs, found four linkage groups with factors controlling seed weight in three wide crosses with contrasting seed sizes (L. culinaris × L. orientalis) (Abbo et al., Reference Abbo, Ladizinsky and Weeden1992). A major QTL for seed weight was identified using SSRs explaining 48.4% of the variance (Verma et al., Reference Verma, Goyal, Chahota, Sharma, Abdin and Bhatia2015). Three QTL for seed weight were reported on two linkage groups with one QTL explaining 34–50% of the variance (Jha et al., Reference Jha, Bohra, Jha, Rana, Chahota, Kumar and Sharma2017). Our GWAS MTA on chromosome 2 explains less of the variance (12.9%) than these other studies. However, another lentil GWAS study recently found one significant MTA lentil seed weight using SSRs which explained a similar amount of the variance (Singh et al., Reference Singh, Dikshit, Mishra, Aski and Kumar2019).
Days to flowering has been an important selection criterion for lentil breeders (Erskine et al., Reference Erskine, Ellis, Summerfield, Roberts and Hussain1990). Sarker et al. (Reference Sarker, Erskine, Sharma and Tyagi1999) originally reported and named a lentil early flowering gene (sn). Weller et al. (Reference Weller, Liew, Hecht, Rajandran, Laurie, Ridge, Wenden, Vander Schoor, Jaminon, Blassiau and Dalmais2012) establish the importance of the Hr locus (orthologue of Early Flowering 3) on photoperiod response of flowering in lentil located on chromosome 3 (Bett, unpublished data). The one significant MTA for days to flowering identified in the ICARDA Reference Plus collection was located also on chromosome 3 in our study. Once the lentil reference genome is published, it can be determined if this MTA maps close to the Hr locus. A bi-parental mapping population reported a major flowering time QTL explained 60% of the variance (Kahriman et al., Reference Kahriman, Temel, Aydogan and Tanyolac2015). Three other QTL for days to flower have been reported on a bi-parental SNP-based map (Fedoruk et al., Reference Fedoruk, Vandenberg and Bett2013). A single major locus for days to flower was recently reported in a wide cross between L. culinaris × L. odemensis (Polanco et al., Reference Polanco, de Miera, González, García, Fratini, Vaquero, Vences and de la Vega2019). A lentil GWAS study on flowering time in 324 L. culinaris lines using 255,714 SNP markers identified three MTAs (two on chromosome 2, one on chromosome 5) using the CDC Redberry Lc1.2 assembly (Ramsay et al., Reference Ramsay, Chan, Sharpe, Cook, Penmetsa, Chang, Coyne, McGee, Main, Edwards, Kaur, Vandenberg and Bett2016; Neupane, Reference Neupane2019). Flowering time MTAs were also reported for days to flower and days to maturity using GWAS with unmapped SSR and EST markers by Kumar et al. (Reference Kumar, Gupta, Biradar, Gupta, Dubey and Singh2018a, Reference Kumar, Gupta, Gupta and Singhb).
The data mining of historical genebank phenotypic data for GWAS is relatively new and mostly untested. Nguyen and Norton (Reference Nguyen and Norton2020) recently reviewed this approach for GWAS and genomic selection. Two examples of this wealth of data on barley and wheat were published by Leibniz Institute of Plant Genetics and Crop Plant Research (IPK) (González et al., Reference González, Weise, Zhao, Philipp, Arend, Börner, Oppermann, Graner, Reif and Schulthess2018a; Philipp et al., Reference Philipp, Weise, Oppermann, Börner, Graner, Keilwagen, Kilian, Zhao, Reif and Schulthess2018). González et al. (Reference González, Philipp, Schulthess, Weise, Zhao, Börner, Oppermann, Graner and Reif2018b) published a strategy to utilize historical phenotypic data collected during seed regeneration to assemble large mapping populations of accessions to discover the genetic effects. Their proposed strategy is not crop-specific and can be used as a guide for the phenotypic evaluation of basically any collection with quality phenotypic data. Utilizing phenotypic historic data from ex situ genebanks was thought to ‘elevate them to bio-digital resource centres’. A successful application of the historical data approach was used for a GWAS study confirming the association between fruit colour and the MYB1 locus in apple (Migicovsky et al., Reference Migicovsky, Gardner, Money, Sawler, Bloom, Moffett, Chao, Schwaninger, Fazio, Zhong and Myles2016).
Incorporating this genotype data of the ICARDA Reference Plus collection into genebank databases will bring the world's plant science research community closer to ‘unlocking’ genetic diversity within these collections (Tanksley and McCouch, Reference Tanksley and McCouch1997). Linking the genotypic data to ex situ PGR accessions has been limited based on current genebank database software schema (Postman et al., Reference Postman, Hummer, Bretting, Kinard, Bohning, Emberland, Sinnott, Mackay, Cyr, Millard, Gardner, Weaver, Ayala-Silva, Franko, Mackay and Guarino2010; van Treuren and van Hintum, Reference van Treuren and van Hintum2014). Finkers et al. (Reference Finkers, Chibon, van Treuren, Visser and Hintum2015) proposed using semantic web technology. A USDA effort (www.breedinginsight.org) was undertaken to link genomic data directly to GRIN Global databases. The most advanced effort to link genotypes to PGR accessions has been developed, the database ‘Germinate’ (Raubach et al., Reference Raubach, Kilian, Dreher, Amri, Bassi, Boukar, Cook, Cruickshank, Fatokun, El Haddad, Humphries, Jordan, Kehel, Kumar, Labarosa, Loi, Mace, McCouch, McNally, Marshall, Mikwa, Milne, Odeny, Plazas, Prohens, Rieseberg, Schafleitner, Sharma, Stephen, Tin, Abou Togola, Emily Warchefsky, Peter Werner and Shaw2021). This version integrates both the phenotypic and genotypic data with the PGR accession. Currently, this lentil accession genotypic data is available for download from the PulseDB database and in the future will be linked to the ICARDA genebank database. Seed of the ICARDA Reference Plus collection is available for requestors directly from ICARDA (https://www.icarda.org/).
Data availability
The lentil SNP data set in vcf format file as well as corresponding FASTA sequences are available for downloading on the Pulse Crops Database (https://www.pulsedb.org/). All raw sequence data are available through the National Center for Biotechnology Information (NCBI) Sequence Read Archive (SRA) with BioProject number: PRJNA639210 (http://www.ncbi.nlm.nih.gov/bioproject/639210).
Supplementary material
The supplementary material for this article can be found at https://doi.org/10.1017/S147926212100006X
Acknowledgements
The authors thank the USAID for a linkage grant (KR, SK, RJM, CJC), CRP-Grain Legumes (KR, SK) and the Northern Pulse Growers Association (DM, RJM, CJC) and for funding and support from USDA ARS Project Nos. 5348-21000-017-00D (CJC), #5348-21000-024-00D (RJM). The authors further thank the ‘Lentil Genome Sequencing (LenGen) Project’ and its Project Leaders (KE Bett and DR Cook), and the researcher(s) responsible for generating the data. This work used the Vincent J. Coates Genomics Sequencing Laboratory at UC Berkeley, supported by NIH S10 Instrumentation Grants S10RR029668 and S10RR027303.


 Open access