





A core challenge to resolve in spoken word recognition is to distinguish the target word among similar-sounding words (Dahan & Magnuson, Reference Dahan, Magnuson, Traxler and Gernsbacher2006; Pisoni & McLennan, Reference Pisoni, McLennan, Hickok and Small2016). To this end, it becomes vital to understand the extent to which similar-sounding words, or phonological neighbors, interact with each other to either hinder or aid our recognition of spoken words. Psycholinguists hypothesize the presence of a mental lexicon in our minds that contains all the words we know and encodes their phonological similarities (Aitchison, Reference Aitchison2012), which can be formally represented as a network model using methods from the field of Network Science. Such a network model enables researchers to study the underlying mechanisms of language processing (Weber & Scharenborg, Reference Weber and Scharenborg2012). More specifically, a phonological network can be constructed to visualize the connectivity structure of the mental lexicon (Vitevitch, Reference Vitevitch2022).
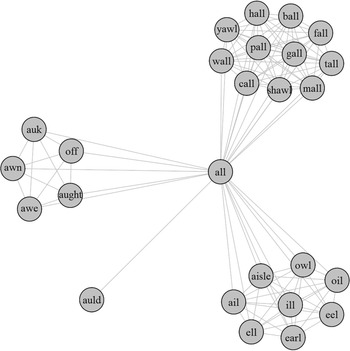
Network science involves the construction of networks from individual entities called nodes. Relationships between pairs of individual nodes are identified, and connections (also called edges or links) are placed between them. Prominent examples of real-world networks include social or computer networks and networks of the World Wide Web (Newman, Reference Newman2006). In psycholinguistics, phonological networks serve to illustrate the relationships between words in our mental lexicon (Figure 1). Each node is the pronunciation of a word (i.e., its phonological representation), and edges are present between words whose pronunciations differ by a single phoneme, which are also known as phonological neighbors in the psycholinguistic literature (Luce & Pisoni, Reference Luce and Pisoni1998). Such an approach may be particularly appropriate for psycholinguistics, as previous studies have demonstrated a significant influence of neighboring words during spoken word recognition (Luce et al., Reference Luce, Goldinger, Auer and Vitevitch2000; Pisoni & Luce, Reference Pisoni, Luce, Schwab and Nusbaum1986; Vitevitch, Reference Vitevitch2002, Reference Vitevitch2007).
Neighbors of the word “all” and its phonological neighbors in a phonological network.
Note. Produced from the American English phonological network as described in this paper.
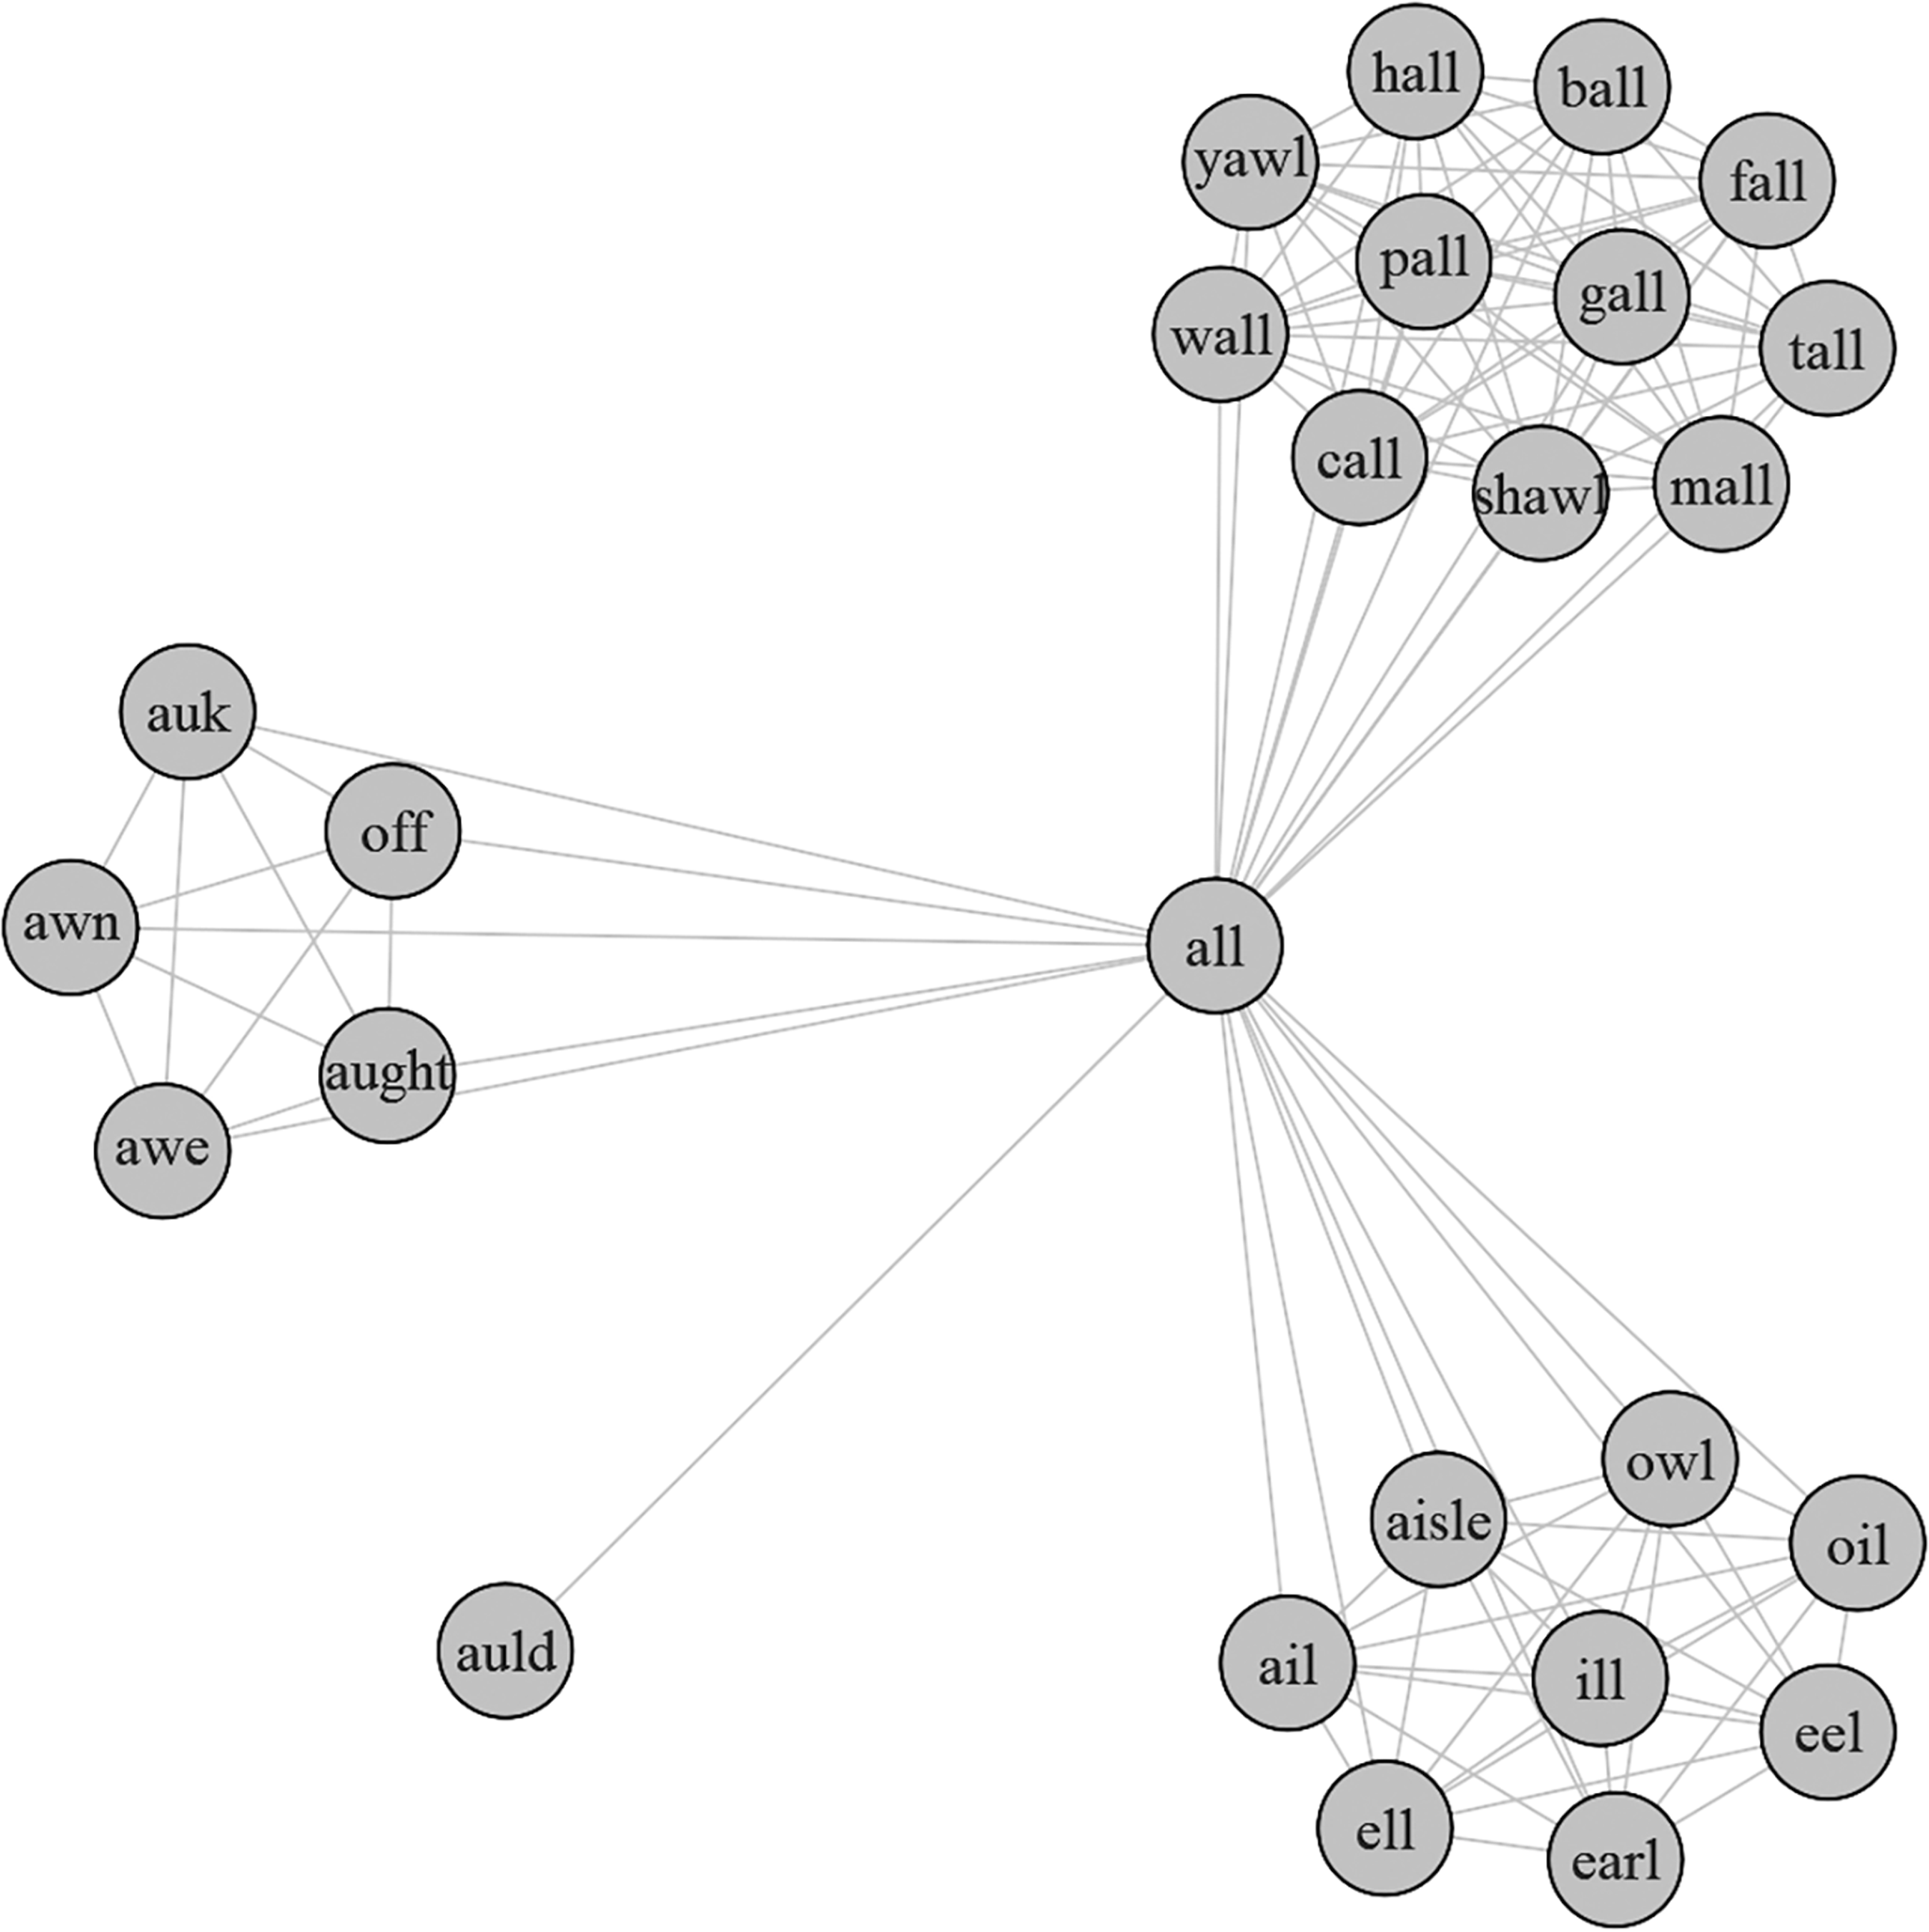
Figure 1. Long description
A diagram of the phonological network of the word all and its neighbors. The central node is labeled all, connected to various phonological neighbors. The neighbors are grouped into clusters based on their phonological similarity. The top-right cluster includes words like hall, ball, fall, pall, gall, tall, call, shawl, mall, and yawl. The bottom-left cluster includes words like auk, awn, awe, off, and aught. The bottom-right cluster includes words like aisle, ail, ill, ell, earl, owl, oil, and eel. The word auld is connected directly to all but is not part of any cluster. Each node represents a word, and the lines connecting the nodes represent phonological similarities.
Certain properties of phonological networks influence performance in various spoken word recognition paradigms, such as the Auditory Lexical Decision Task and the Perceptual Identification Task (Jusczyk & Luce, Reference Jusczyk and Luce2002; Vitevitch, Reference Vitevitch2022). For instance, Siew (Reference Siew2017b) found that even distant (i.e., indirectly connected) neighbors of the target word in the phonological network appear to have an effect on spoken word recognition, a finding that cannot be easily explained using conventional psycholinguistic models that do not take into account the overall structure of the phonological lexicon.
In this article, we focus on two micro-level network properties in the phonological network that have previously been shown to affect language processing: degree and local clustering coefficient (LCC). The degree value of a node is the number of other nodes connected directly to it. For phonological networks, such connections are between nodes with similar-sounding pronunciations (Stella et al., Reference Stella, Beckage and Brede2017). This is identical to the definition of phonological neighborhood density (Luce & Pisoni, Reference Luce and Pisoni1998). Words with sparse phonological neighborhoods (low degree) were found to have higher accuracy and faster response times than words with dense phonological neighborhoods (high degree) in an Auditory Lexical Decision Task (LDT) (Pisoni & McLennan, Reference Pisoni, McLennan, Hickok and Small2016; Vitevitch et al., Reference Vitevitch, Ercal and Adagarla2011).
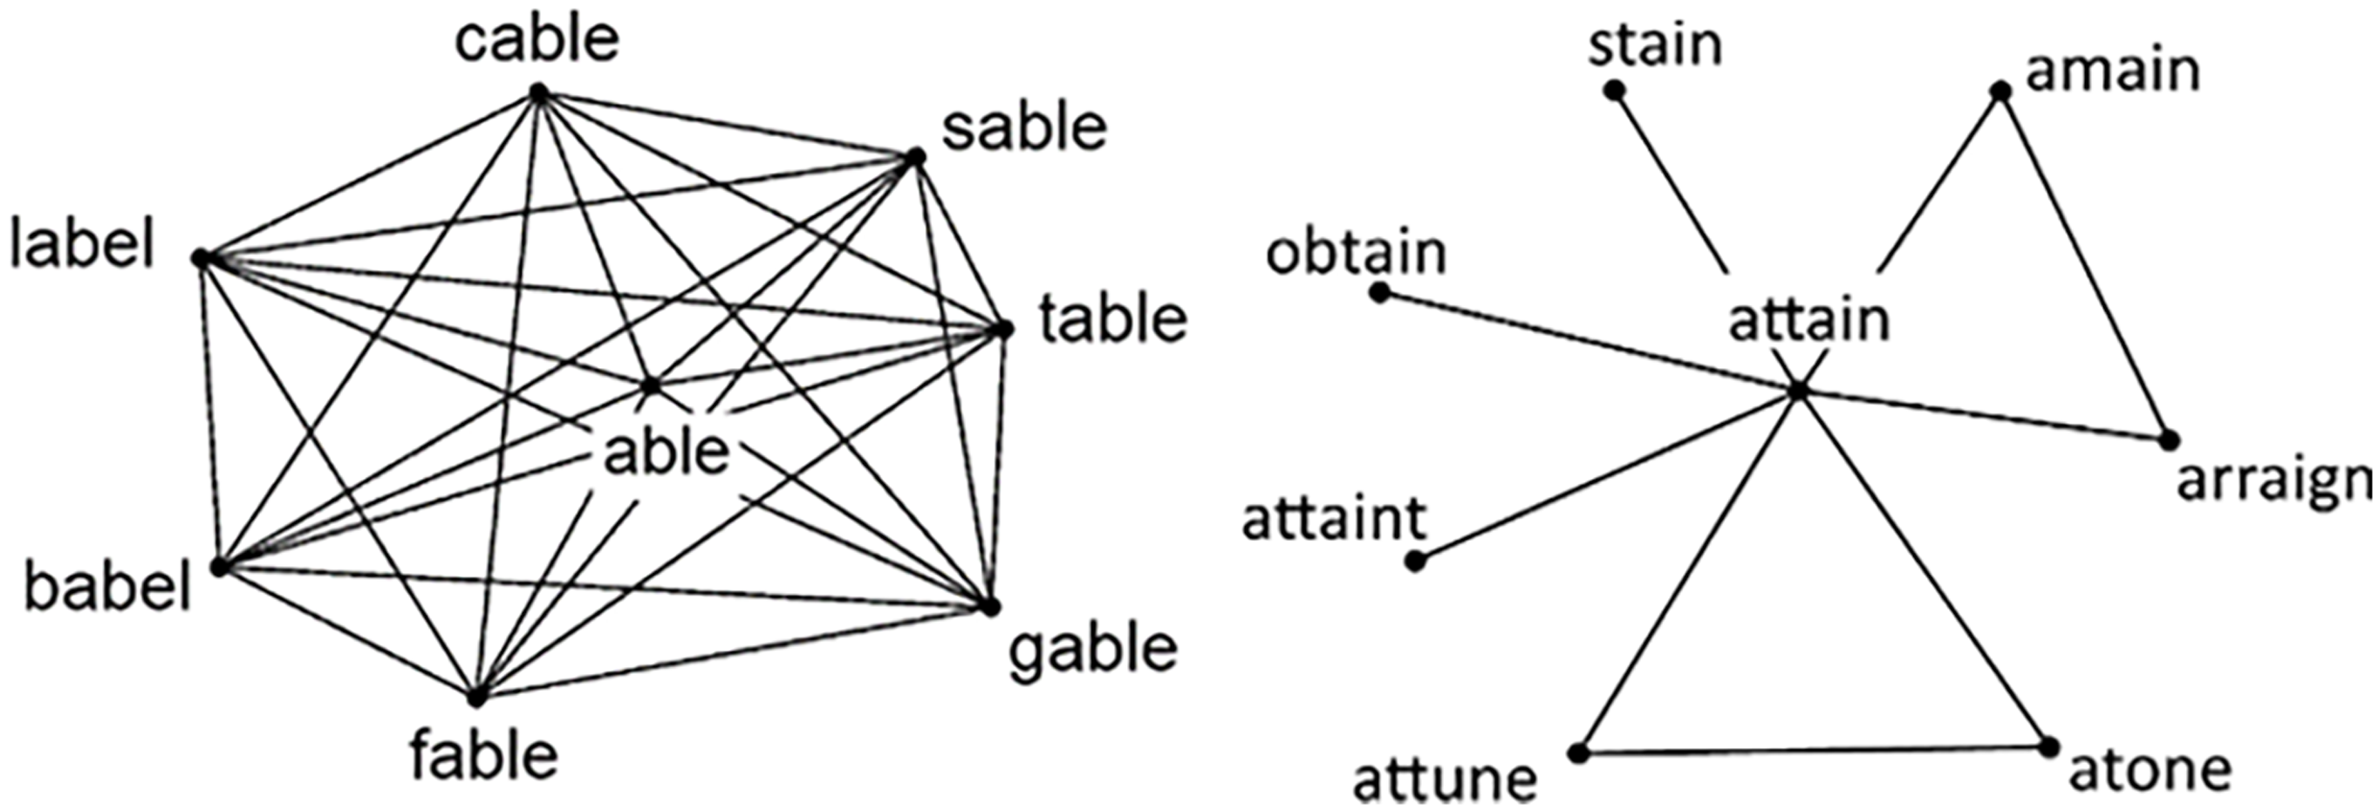
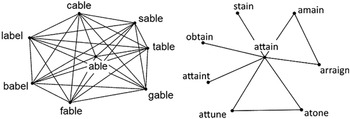
Turning to LCC, the LCC value of a node is the proportion of its neighbors that are also neighbors of each other (Opsahl, Reference Opsahl2013). LCC ranges from 0 to 1, with higher values corresponding to a higher proportion of neighbors of a target node also being neighbors of each other (Figure 2).
Neighbors of a word (“able”) with high LCC (left) and a word (“amend”) with low LCC (right) in a phonological network.
Note. Produced from the American English phonological network as described in this paper.
Previous research found that low LCC words were identified at a higher accuracy than high LCC words in the Perceptual Identification Task, and low LCC words were recognized more quickly than high LCC words in LDT (Chan & Vitevitch, Reference Chan and Vitevitch2009). To explain these effects, the authors suggested that words that are more densely connected in their immediate vicinity tend to restrict the spread of activation to a more confined area of the network. Consequently, it becomes harder to differentiate the target word from its neighbors (Siew, Reference Siew2019; Vitevitch et al., Reference Vitevitch, Ercal and Adagarla2011).
Despite some preliminary work comparing phonological networks of different languages (Arbesman et al., Reference Arbesman, Strogatz and Vitevitch2010), to date, current research has not yet explicitly considered the extent that phonological networks differ across different dialects of the same language. As dialects vary in their phonemic inventories, participants hearing a particular word spoken in a different dialect generally take longer to recognize it as compared to hearing that same word in their native dialect (Le et al., Reference Le, Best, Tyler and Kroos2007). Notably, unfamiliar accents could impede language processing resulting in the performance of native listeners being reduced to a level similar to that of second-language listeners (Arnhold et al., Reference Arnhold, Porretta, Chen, Verstegen, Mok and Järvikivi2020). Additionally, phonological differences in dialects may activate different brain structures in speakers of different dialects. As noted in Schmitt et al. (Reference Schmitt, Auer and Ferstl2019), bidialectal listeners of German had stronger left Anterior Temporal Lobe activation when they heard fairy tales spoken in their own dialect, as compared to monolectals. Similar findings were observed in long-term repetition priming experiments. Participants born and raised in New York effectively encoded and recalled two separate variants of the final “-er” form (New York accent and Standard American English), whereas participants from other regions in the US could only recall the latter AmE “-er” form (Sumner & Samuel, Reference Sumner and Samuel2009). This suggests that dialectal differences in phonemes, and even of identical words, are potentially stored as separate representations in the mental lexicon. Consequently, an important yet unaddressed research question is whether dialectal variations in mental lexicon structure have any observable influences on language processing.
It is thus important to determine whether such differences hinder our ability to generalize past findings obtained from phonological networks of a particular dialect to other dialects. This is relevant for English language research as most studies (e.g., Siew (Reference Siew2013) and Vitevitch (Reference Vitevitch2008)) analyzed phonological networks constructed from American English (AmE), and to the best of our knowledge, no study has conducted an explicit comparison of the AmE phonological network to networks constructed using other English dialects. The present study is thus focused on elucidating the influence of phonological differences between AmE-Net and Singapore English (SgE) on their phonological network structures. SgE is the dialect of English spoken by people living in Singapore and comprises two varieties: Singapore Standard English (SSE), the “higher” variety spoken in formal or professional contexts, and Singapore Colloquial English (more popularly known as “Singlish”), the “lower” variety spoken in informal contexts (Gupta, Reference Gupta1994). These two varieties have been noted to lack a clear division; while they are generally diglossic, Singlish has been observed to be “leaky” with instances of its usage even in formal settings (Gupta, Reference Gupta, Hashim and Hassan2006). While Singapore exists as a multicultural and multilingual society, English proficiency is generally high across the various ethnic groups. In the 2020 national census, 71.4% of the population was noted as being fluent in English and at least one other language and 10.8% fluent in only English.Footnote 1 This can be explained from the use of English as the medium of instruction in schools and the lingua franca in both formal and informal settings (Leimgruber, Reference Leimgruber2011). Hence, the widespread exposure of English in Singapore means that our prototypical conception of an SgE phonological network likely applies to the majority of Singaporeans. For our present purpose of conducting a comparison across English dialects, this study will focus on only comparing the standard (i.e., SSE) variety of English in Singapore with the standard (i.e., General AmE-Net) accent of English in America.
Although the pronunciation of SgE (particularly that of the SSE variety) is generally considered to be similar to that of dominant English dialects such as American and British English, it is worth highlighting that there are some notable features of SgE that are absent in AmE, such as the avoidance of reduced vowels (e.g., [ϵ] is preferred over [ə]) (Deterding, Reference Deterding2007) and the DRESS-TRAP vowel merger (i.e., the [e] for DRESS and [æ] for TRAP in AmE both resolve to [ϵ] in SgE) (Leimgruber, Reference Leimgruber2011). These differences suggest that the phonological network representation of SgE is not likely to be identical to the AmE phonological network.
Hence, to determine the effects of dialectical variability in phonological networks on spoken word recognition performance, the present study constructed and compared two phonological networks (SgE-Net and AmE-Net) representing two different dialects of English (SgE and AmE). By comparing the predictive power of these two networks in the performance of both Singaporean and American participants in an Auditory Lexical Decision Task, we can determine whether a network localized to a regional dialect is better at predicting spoken word recognition performance in talkers of that same dialect than a network of a different dialect. To ensure that both dialects were equally represented, the Auditory Lexical Decision Task conducted in this study used auditory tokens spoken by multiple talkers, with one talker for each dialect and both talkers producing the same set of target words. We hypothesized the following: (1) network measures (degree and LCC) generated from both networks should both be significant predictors of task performance and subsequently show significant interactions with both the dialect of participants and the dialect of talkers who produced the auditory tokens. (2) Singaporean participants should have the strongest effect of degree and LCC on both accuracy and response time in the task when they are exposed to the Singaporean talker and the network measures were obtained from SgE-Net. (3) American participants should have the strongest effect of degree and LCC on both accuracy and response time in the task when they are exposed to the American talker and the network measures were obtained from AmE-Net.
Method
Network construction
Phonological network of Singapore English (SgE-Net)
Phonological transcriptions of words in SgE were obtained from the Infocomm Media Development Authority (IMDA) National Speech Corpus (NSC).Footnote 2 This is a corpus containing words spoken by Singaporeans during natural, unscripted conversations. In it, 2,000 hours of speech data from 1,379 Singaporean participants were phonetically and orthographically transcribed (Koh et al., Reference Koh, Mislan, Khoo, Ang, Ang, Ng and Tan2019). Only the phonetic transcriptions of words were used for the construction of the phonological network. The use of this corpus for research purposes is permitted under the Singapore Open Data License.Footnote 3
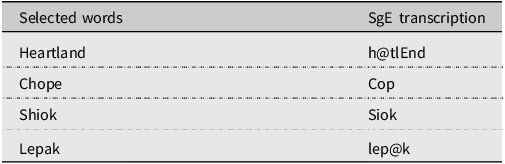
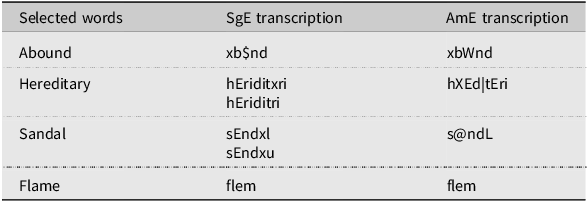
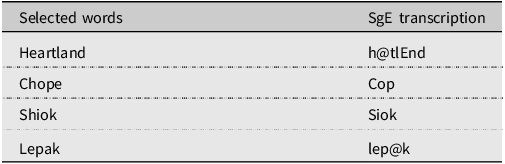
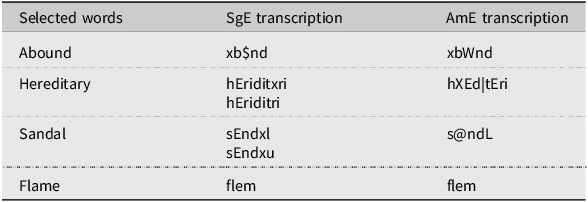
The SAMPA transcription of each word in the NSC lexicon list was first converted to its equivalent Klattese transcription (which has a single character representation for each phoneme); an extended list of Klattese transcriptions was constructed to capture unique phonemes present in SgE. This transcription conversion list can be found on the study’s OSF page. Table 1 shows some words that are unique to SgE, and Table 2 shows examples of words present in both SgE and AmE. Notably, Table 2 demonstrates some instances where SgE pronunciations are not fully equivalent to AmE and also highlights some words in SgE with multiple equally valid pronunciations.
Examples of unique words present in SgE only and their Klattese transcriptions
Examples of words found in SgE and AmE and their Klattese transcriptions for both accents
To ensure that later comparisons with AmE-Net would be accurate, only valid words in the list of words from IMDA NSC were retained for SgE-Net network generation. To achieve this, all words were first separated into words or non-words using the Natural Language Toolkit (NLTK) package in Python (Bird et al., Reference Bird, Loper and Klein2009). In this article, words are defined as the lemmas of adjectives, adverbs, nouns, and verbs. Conversion of words to their lemmas was done using the WordNet corpus reader (Princeton University, 2010) and OpenWordNet (McCrae et al., Reference McCrae, Rademaker, Bond, Rudnicka and Fellbaum2019). Additional valid words in SgE were added based on a Singlish word list developed by our research lab; these are lexical items unique to SCE and not found in other English dialects. Words with multiple pronunciations (e.g., “house” has both /haʊs/ and /haʊz/) have all their pronunciations retained in SgE-Net. Words absent in dictionaries as well as proper nouns and parts of speech (e.g., determiners and prepositions) were not included in the network construction.
Phonological network of American English (AmE-Net)
The AmE-Net used as a basis of comparison with SgE-Net was generated from a list of 19,340 words taken from the 1964 Merriam-Webster Pocket Dictionary, as outlined in Vitevitch (Reference Vitevitch2008), which built on previous work on the Hoosier Mental Lexicon by Nusbaum et al. (Reference Nusbaum, Pisoni and Davis1984). The pronunciations were of a standard Midwestern North American accent.
Comparing the overall network structure of SgE-Net and AmE-Net networks
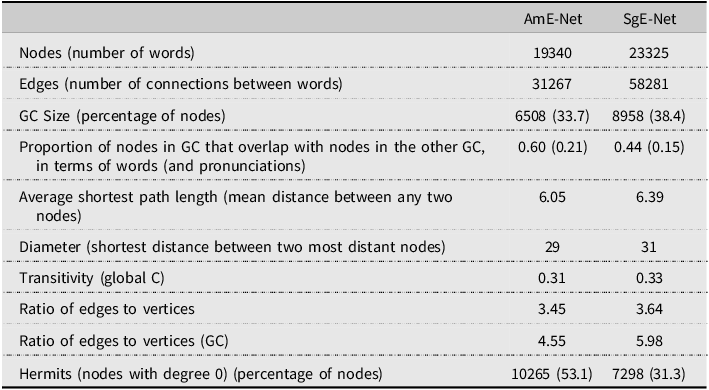
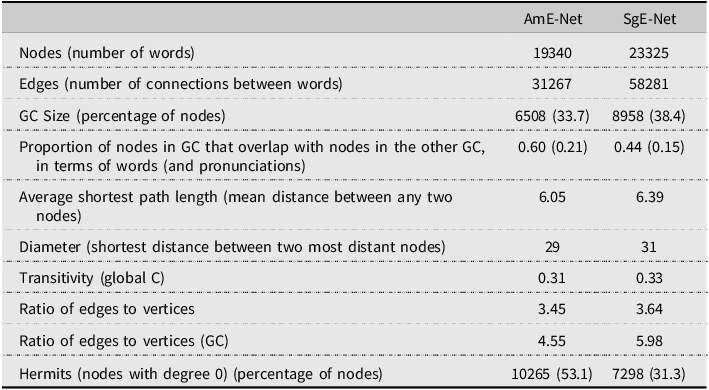
Both networks were generated using the langnetr (Siew, Reference Siew2017a) and igraph (Csardi & Nepusz, Reference Csardi and Nepusz2006) packages in R. In SgE-Net, each node is defined as a single phonological transcription of a valid word. For words with several pronunciations (17.1% of all words), each pronunciation had its own unique node. In AmE-Net, each word had only one node since all words only had a single pronunciation. In both networks, an edge connected every two words that are phonological neighbors (i.e., via the deletion, addition, or substitution of one phoneme, in any position, in the phonological transcriptions) (Luce & Large, Reference Luce and Large2001). Table 3 shows the network measures that quantify the macro-level or overall structure of AmE-Net and SgE-Net. Overall, it appears that both phonological networks are comparable in their size, but SgE-Net has almost double the number of edges than AmE-Net. Their values on a range of macro-level network metrics are generally similar, but AmE-Net has a higher proportion of nodes as hermits than SgE-Net. This suggests that nodes in SgE-Net may be more well-connected than their corresponding counterparts in AmE-Net. In addition, one notable finding is that there does not appear to be a large overlap in the words present in the giant component of both networks, and a large majority of words present in both giant components differ greatly in their pronunciations.
Network measures of AmE-Net and SgE-Net (GC refers to the Giant Component of each network)
Stimuli generation
Potential candidates for the Auditory Lexical Decision Task word list were first identified by selecting words in the giant components of both AmE-Net and SgE-Net. Unlike other real-world networks, phonological networks of various languages consist of a unique structure that has one large component with the most connections (known as the giant component) and many smaller, isolated components (known as lexical islands) and hermit nodes with no connections (Arbesman et al., Reference Arbesman, Strogatz and Vitevitch2010; Vitevitch, Reference Vitevitch2008).
Beyond this criterion, an additional criterion was imposed on SgE-Net, which was to only consider words with a single pronunciation; this was done to avoid ambiguity in the identification of words with multiple pronunciations. This list of words was then further filtered to only contain words that were also found in the Auditory English Lexicon Project (AELP), an Auditory Lexical Decision Task megastudy (Goh et al., Reference Goh, Yap and Chee2020). Finally, following Chan and Vitevitch (Reference Chan and Vitevitch2015), only monosyllabic words with consonant-vowel-consonant structure were retained.
The AELP is a multi-talker, multi-region psycholinguistic database of 10,170 spoken words and 10,170 spoken non-words (Goh et al., Reference Goh, Yap and Chee2020). Because the participants who contributed their data to this megastudy were all native speakers of SgE, we elected to save resources and reanalyze a subset of their data, rather than recollect the data in a new study (Keuleers & Balota, Reference Keuleers and Balota2015). Although there were two talkers (of both genders) from each of the three regions (Singapore, Britain, and America), only the audio recordings of selected words spoken by the male Singaporean and American talkers and the performance of Singaporean participants when presented with those words were analyzed here.
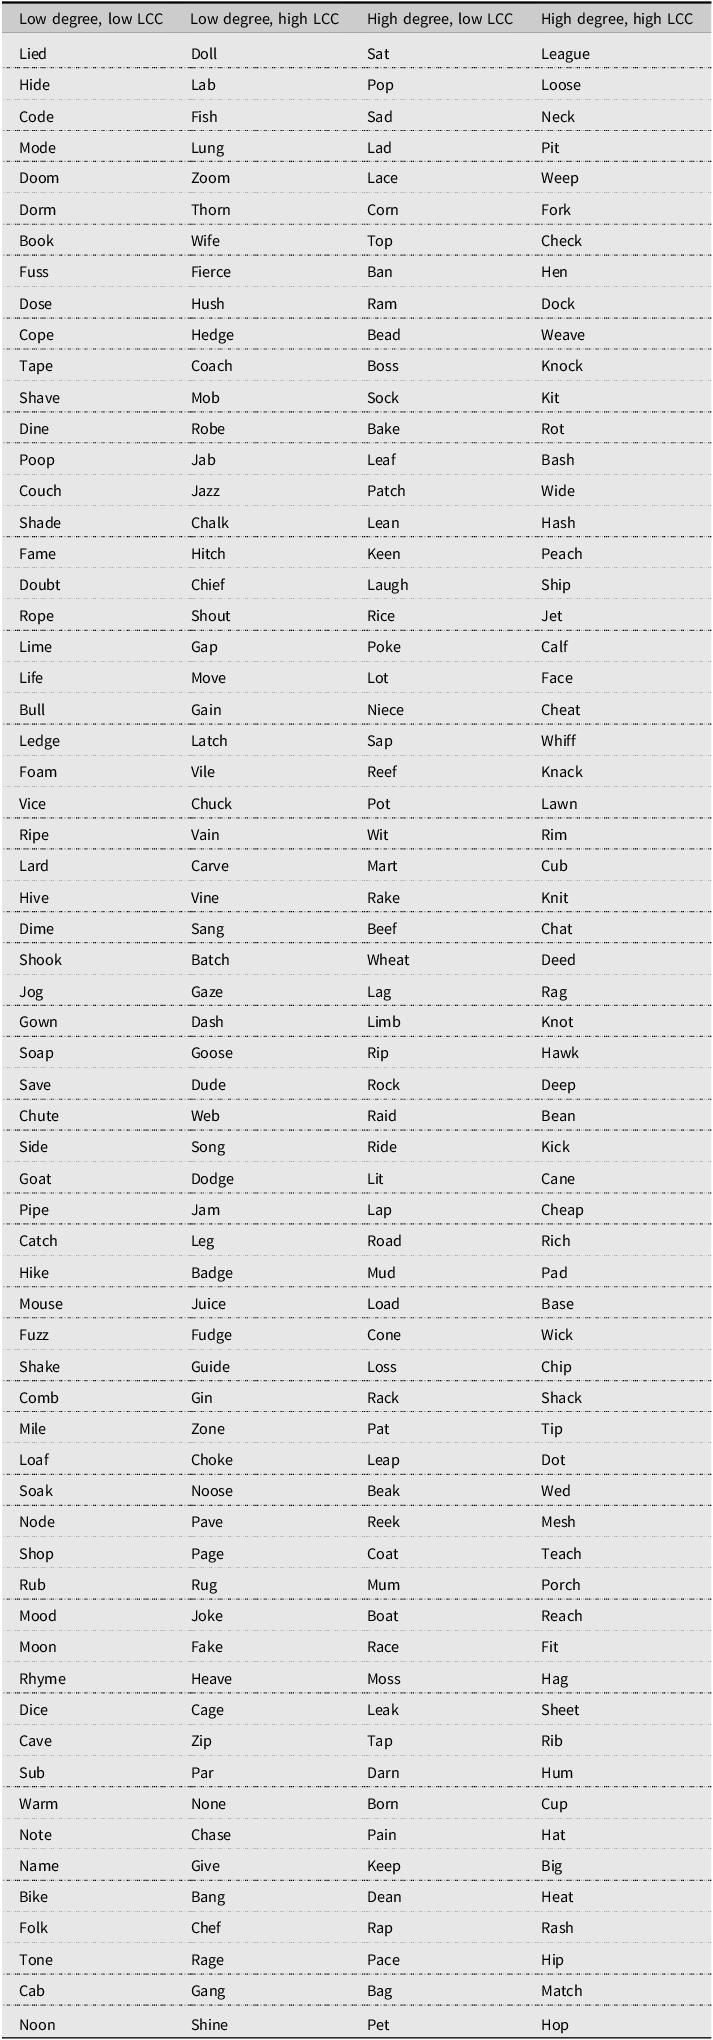
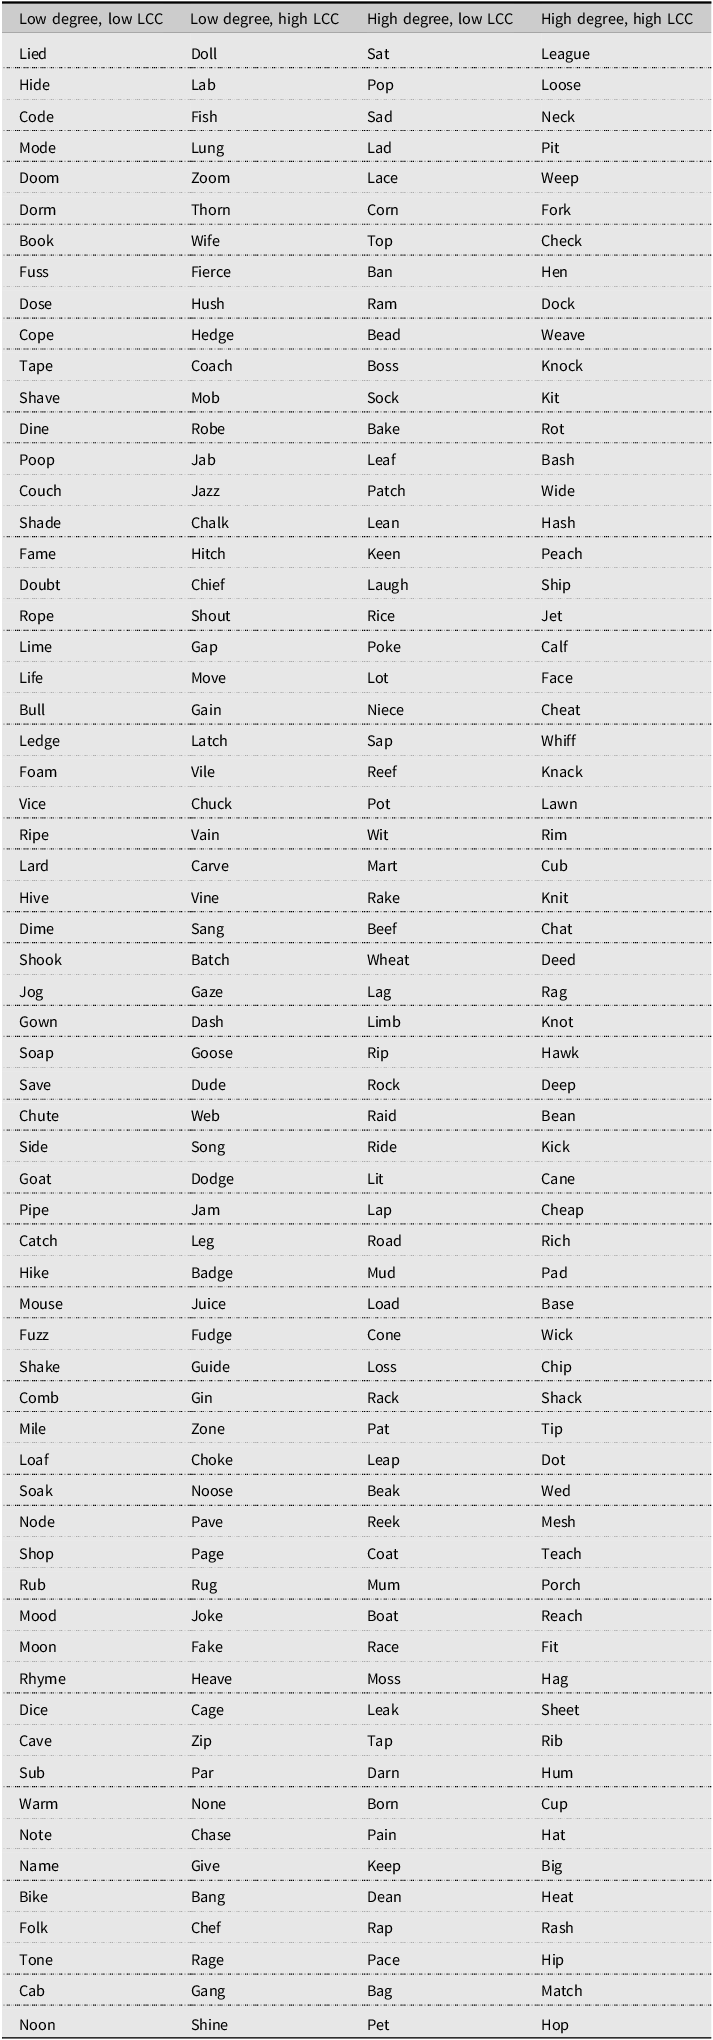
After implementing these criteria, the final selection of 256 target words (see Appendix 1) was completed using the LexOPS package in R (Taylor et al., Reference Taylor, Beith and Sereno2020). The decision to select 256 words was motivated by Brysbaert and Stevens’s (Reference Brysbaert and Stevens2018) recommendation that a sample should minimally consist of 40 stimuli (target words) in each condition for sufficient power in psycholinguistic studies. The medians of their degrees (Mdn = 29) and LCC (Mdn = .31) (as measured in SgE-Net) were used to split the words to produce four conditions: “Low Degree, Low LCC,” “Low Degree, High LCC,” “High Degree, Low LCC,” and “High Degree, High LCC.”
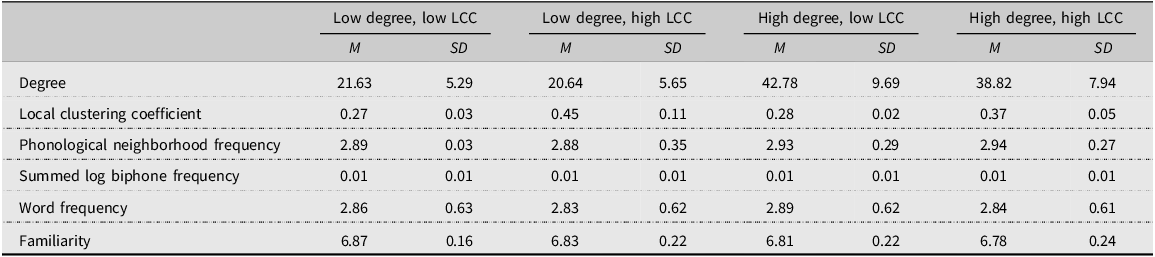
All words were then controlled on four variables: Phonological Neighborhood Frequency, Summed Log Biphone Frequency, and Word Frequency and Familiarity. Phonological Neighborhood Frequency refers to the average word frequency of each word’s neighbors when considering a single phoneme addition, deletion, or substitution. Summed Log Biphone Frequency refers to the position-specific summed co-occurrence probability of segment-to-segment sounds within each word (Vitevitch & Luce, Reference Vitevitch and Luce2004). Word Frequency is the summed occurrence of words as they appear in corpora, whose values were taken from Brysbaert and New (Reference Brysbaert and New2009). Familiarity of words was obtained from Nusbaum et al. (Reference Nusbaum, Pisoni and Davis1984), where participants were asked to rate their perceived familiarity of dictionary words on a seven-point scale, with higher values indicating greater understanding of the word and its meaning(s). Their values were obtained from the AELP (Goh et al., Reference Goh, Yap and Chee2020). These measures were used as controls to ensure that items in each group had comparable values and reduce potential confounding effects in spoken word recognition experiments (Chan & Vitevitch, Reference Chan and Vitevitch2015). Table 4 shows the breakdown of these measures by the four conditions.
Descriptive statistics of lexical characteristics of all four conditions
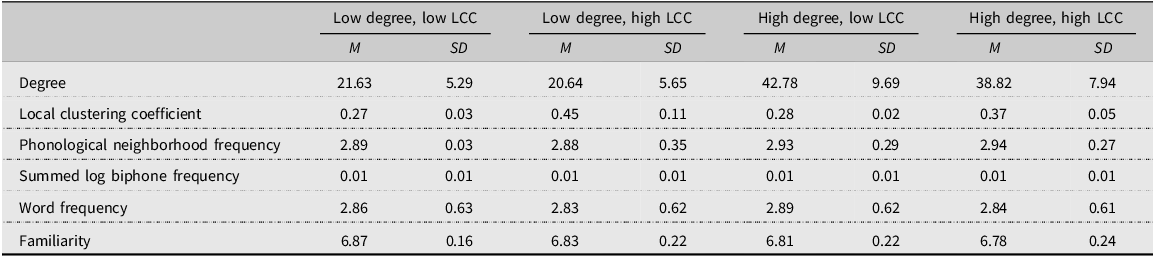
One-way ANOVA tests revealed that Phonological Neighborhood Frequency (F[3, 252] = .69, p = .56), Phonological Summed Log Biphone Frequency (F[3, 252] = 1.46, p = .23), Word Frequency (F[3, 252] = .14, p = .94), and Familiarity (F[3, 252] = 1.85, p = .14) were not significantly different among all conditions, whereas degree (F[3, 252] = 155.6, p < .001) and LCC (F[3, 252] = 122.1, p < .001) were significantly different among all conditions. Further post hoc pairwise t-tests with Holm adjustment identified that differences in degree between conditions were all significant (p < .05) aside from “Low Degree, Low LCC” and “Low Degree, High LCC,” and differences in LCC between conditions were all significant (p < .05) aside from “Low Degree, Low LCC” and “High Degree, Low LCC.” As expected, all four conditions were similar in the four control variables and different in the two predictors (Table 4). Note that although the stimuli were selected in a factorial approach to ensure a good level of diversity in the stimuli generation process, the data were eventually analyzed using linear mixed-effects models where degree and LCC were entered as fixed, continuous predictors into the models.
Following final selection of the list of target words for the Auditory Lexical Decision Task in this study, their matching non-words were then obtained from AELP (Goh et al., Reference Goh, Yap and Chee2020). In this dataset, each non-word was yoked to their matching word. First, the WUGGY pseudoword generator (Keuleers & Brysbaert, Reference Keuleers and Brysbaert2010) was used to produce an orthographically plausible word. The non-word that was formed was then modified to match the original word as much as possible, with changes only made near the end of the phoneme sequence. This ensured that the final non-words were phonologically plausible to their corresponding words and could not be anticipated from the start of the phoneme sequence alone.
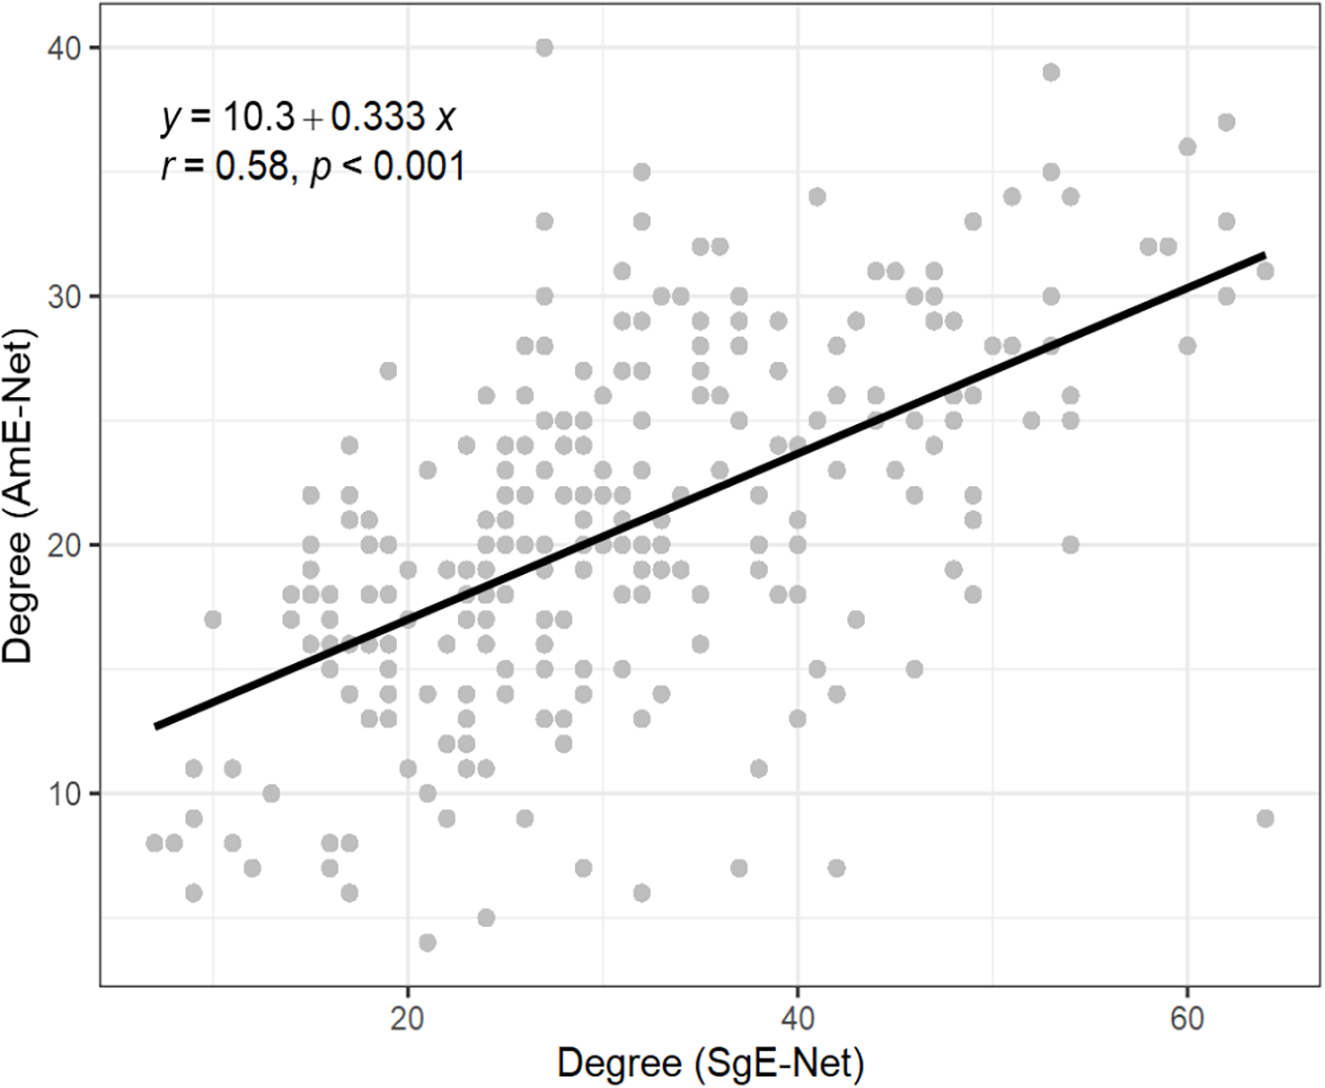
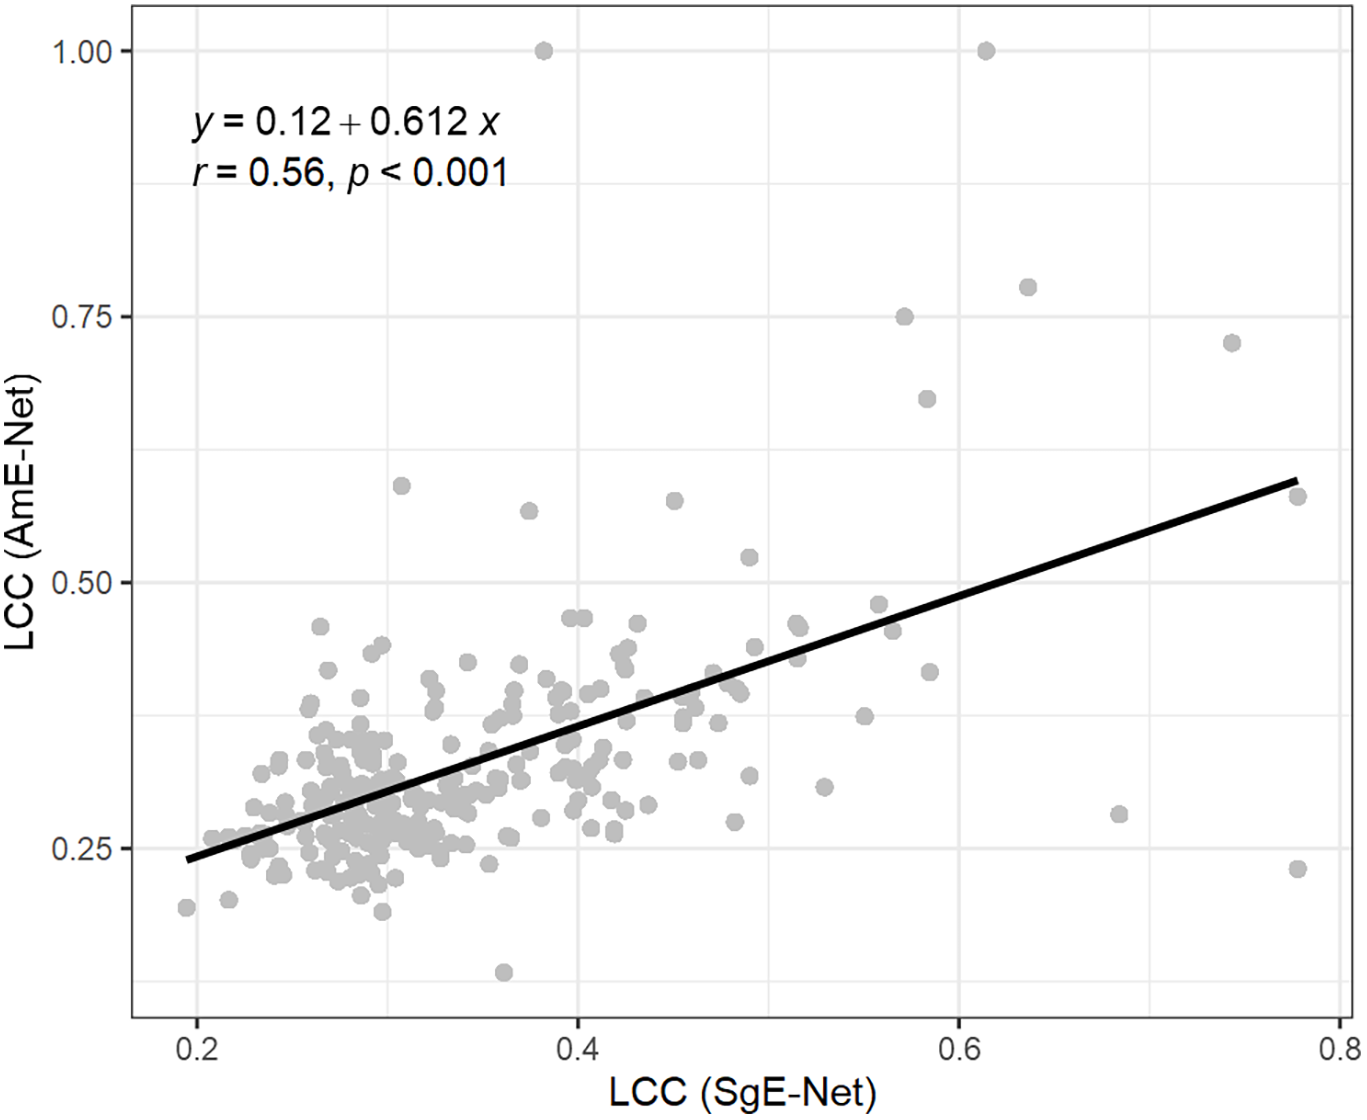
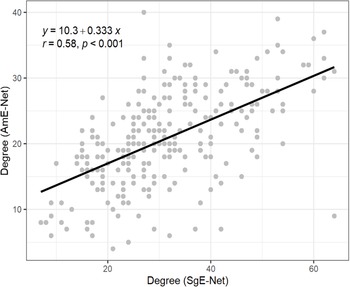
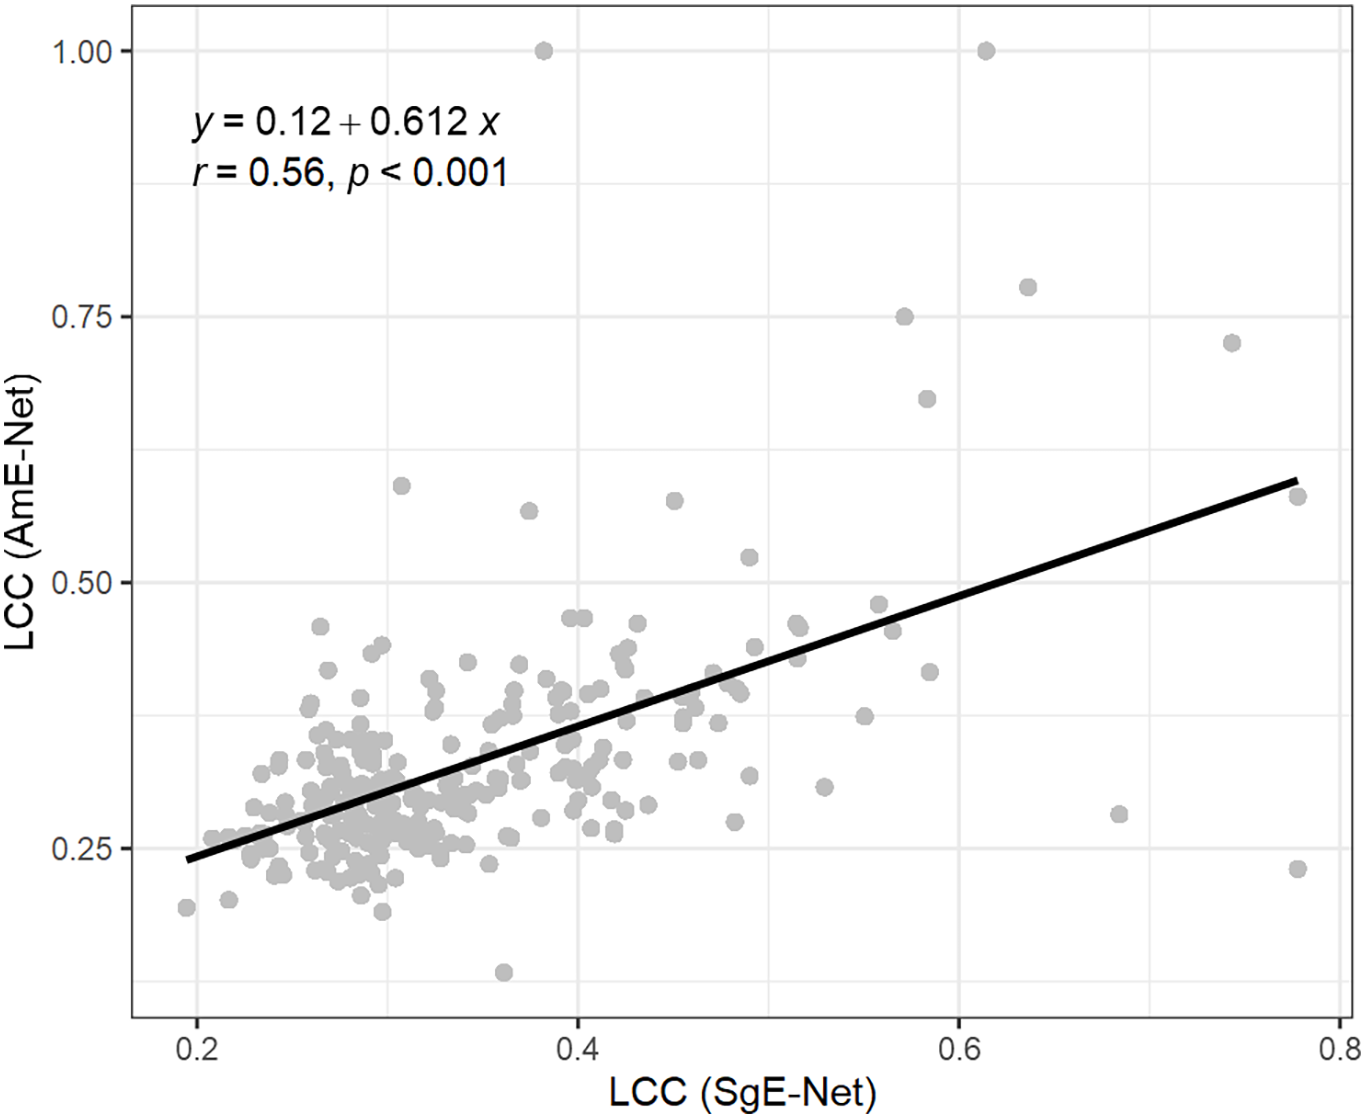
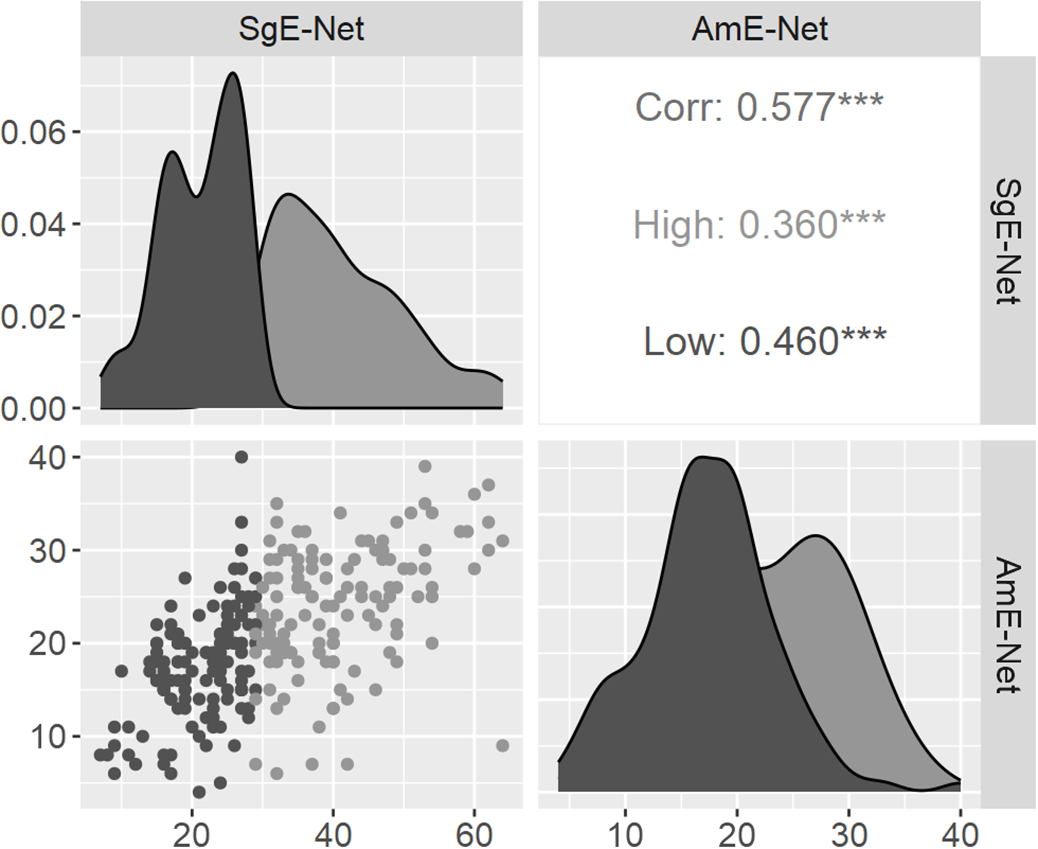
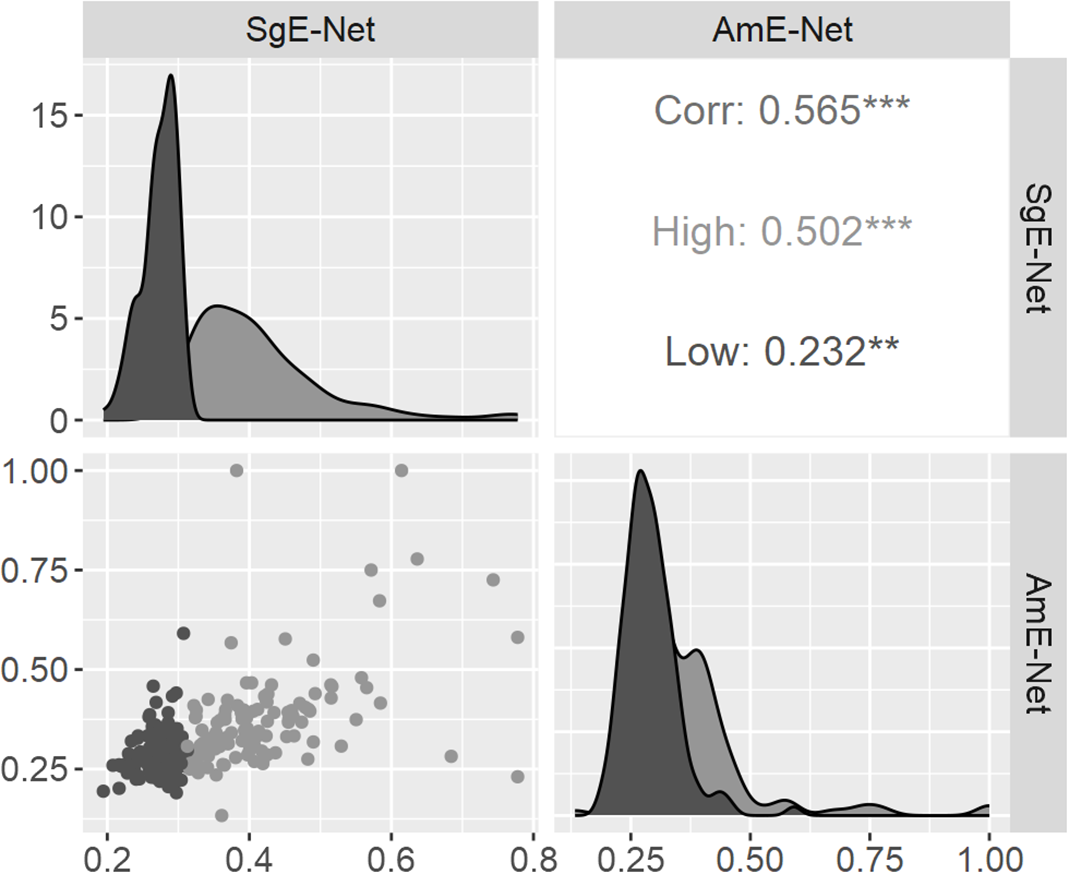
Degree and LCC for AmE-Net and SgE-Net were calculated for all target words (Table 5). There are strong, significant correlations for both degree (Figure 3) and LCC (Figure 4) across both networks, indicating a high extent of overlap between the structures of the networks. When subdivided by LCC (Figure 5), this correlation between LCC and degree remains present for all words within both low LCC and high LCC subgroups. Likewise, when subdivided by degree (Figure 6), this correlation persists between LCC and degree for all words within both low-degree and high-degree subgroups. This indicates that the direction of relationship between LCC and degree in each subgroup is consistent with that of the overall dataset. Additionally, as shown in Figures 5 and 6, the clear presence of two subgroups for both degree and LCC (as indicated by their bimodal distributions), respectively, in both networks validates our decision to employ a median split to subset both variables and highlights the similarity in network measures between both networks.
Degree and LCC of AmE-Net and SgE-Net

Correlation of degree of SgE-Net and AmE-Net.
Correlation of LCC of SgE-Net and AmE-Net.
Correlation of degree of SgE-Net and AmE-Net when subdivided by LCC
Note. * .01 < p ≤ .05; ** .001 < p ≤ .01; *** p ≤ .001. Corr = Correlation; High = High LCC; Low = Low LCC.
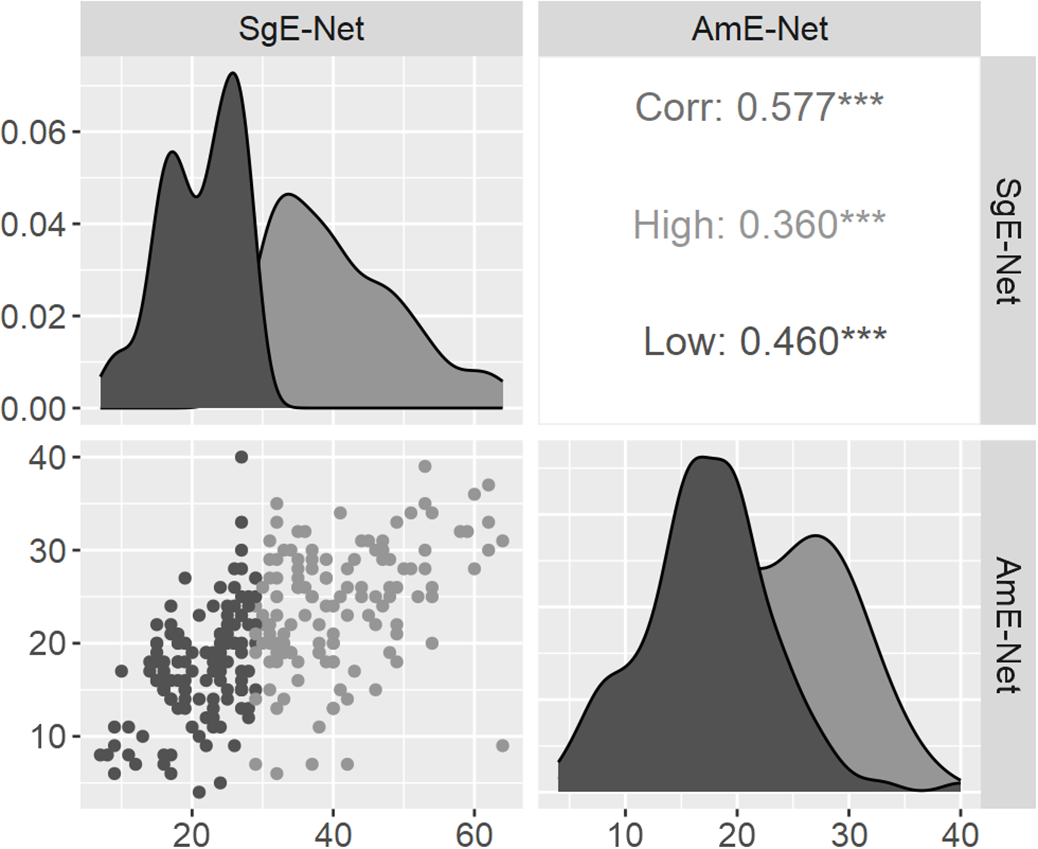
Figure 5. Long description
The figure consists of three panels: two density plots and one scatter plot. Panel A and Panel C are density plots, while Panel B is a scatter plot. Panel A shows density plots for SgE-Net with two overlapping distributions. The x-axis represents an unspecified variable, and the y-axis represents density. Panel B shows a scatter plot comparing SgE-Net and AmE-Net. The x-axis represents SgE-Net values, and the y-axis represents AmE-Net values. The scatter plot displays a positive correlation between the two variables. Panel C shows density plots for AmE-Net with two overlapping distributions. The x-axis represents an unspecified variable, and the y-axis represents density. The figure also includes correlation values and statistical significance indicators for different subdivisions of the networks.
Correlation of LCC of SgE-Net and AmE-Net when subdivided by degree
Note. * .01 < p ≤ .05; ** .001 < p ≤ .01; *** p ≤ .001. Corr = Correlation; High = High degree; Low = Low degree.
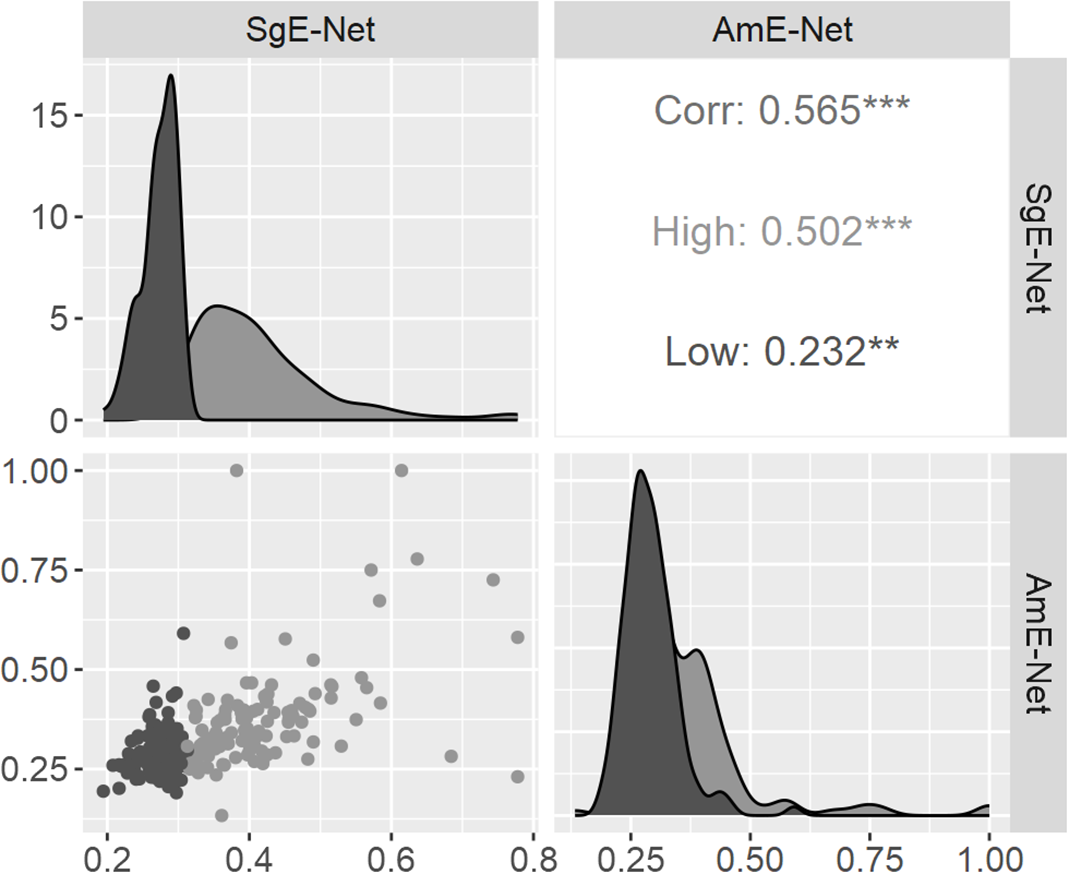
In addition, the correlations for both degree (Figure 5) and LCC (Figure 6) remained significant, albeit lower, when items were subdivided into the low and high LCC or degree groups, respectively. However, as these correlations are not perfect, this indicates the presence of variation across the networks as well.
Auditory lexical decision
Participants
Singaporean sample
Archival data from the AELP was analyzed. Participants in the megastudy were native speakers of SgE. Among the three stages of data collection present in the study (word recording, word identification, and word recognition), only participant data from the word recognition stage (where participants completed the Auditory Lexical Decision Task) were used. Although the total number of participants in this stage was 438, only data from 180 participants (67 male and 113 female; mean age = 21.1 years, SD = 1.5, range 19–25) (101 who listened to the American talker and 85 who listened to the Singaporean talker) were ultimately used for data analysis. This was because only this subset of participants had been presented with the list of words that were selected for this study. Note that there were several participants who were exposed to multiple talkers, but they only heard each token spoken once by a single talker.
American sample
A total of 150 participants were recruited, with 75 who listened to the American talker (45 male and 30 female; mean age = 42.2 years, SD = 13.1, range 21–66) and 75 who listened to the Singaporean talker (53 male, 20 female, and 2 others; mean age = 40.8 years, SD = 12.0, range 21–68). For the American sample, all participants are Americans who have lived in the United States for at least 10 years, had no self-reported speech or hearing disorders, and considered themselves fluent in speaking and writing English at a native level. Ethics approval from the Ethics Review Board from the Department of Psychology, National University of Singapore was obtained prior to starting data collection, and all recruitment was done online via Prolific (https://www.prolific.com). All participants received monetary compensation for their involvement.
Procedure
Singaporean sample
Data on participants’ exposure to the target words were obtained from the AELP megastudy dataset (Goh et al., Reference Goh, Yap and Chee2020). The procedure of the Auditory Lexical Decision Task involved participants hearing tokens spoken to them at 70 dB SPL and being tasked to determine whether they were words or non-words; this was done using a Chronos response box with the leftmost button labeled “non-word” and the rightmost button labeled “word.” There was an inter-stimulus-interval of 200 ms before the next stimulus was presented. Each participant was presented with 1 list of 678 tokens during each 1-hour session, with a break after every 113 trials. However, only a subset of participants and words were used in this analysis. The experiment was designed using E-prime (Schneider et al., Reference Schneider, Eschman and Zuccolotto2012).
American sample
Participants completed the experiment remotely using their own computers. Participants were first briefed, and their informed consent was obtained prior to the study. They then calibrated the volume on the computer to a comfortable listening level, which remained unchanged until the end of the study. The experiment then commenced with two distinct blocks: practice trials and actual trials. The practice trials contained 5 words and 5 non-words, and the actual trials contained 256 words and 256 non-words. For each trial, participants were first presented with a “READY” screen for 500 ms, after which the audio recording for the word was played. Following which, participants indicated their response as either “word” or “non-word” by pressing the corresponding buttons on their keyboard. The audio for each word was only played once. For the practice trials only, participants received feedback on the accuracy of their responses. The actual trials had the same procedure as the practice trials except that participants did not receive feedback on their performance. The presentation order of words and non-words in the actual trials was also randomized. Participants were given a 30-second break after every block of 64 words/non-words in the actual trials. After the experiment concluded, basic demographic information of participants was collected, and participants were debriefed. The entire experiment lasted about 30 minutes. It was designed and implemented using the Gorilla Experiment Builder (Anwyl-Irvine et al., Reference Anwyl-Irvine, Massonnié, Flitton, Kirkham and Evershed2020).
Results
Performance of the AELP (Singaporean) participants was measured in two ways: accuracy (%) and response time (ms). response time was defined as z-scored response time minus duration, where response time was standardized relative to the participant’s own mean, and duration refers to the length of the audio recording. This is a more reliable measure of response time than raw scores, as standardization reduces variation between participants, and subtracting the duration of each word’s sound file removes the effect of differences in audio recording lengths on response time (Goh et al., Reference Goh, Yap and Chee2020). Accuracy was defined as a binary variable, with 1 being correct identification of the target as a word, and 0 being incorrect identification of the target as a non-word. The same performance measures were computed for the American sample.
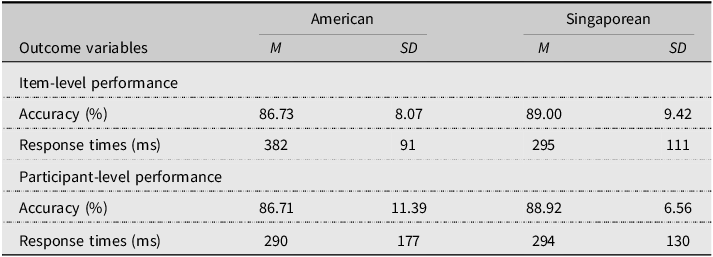
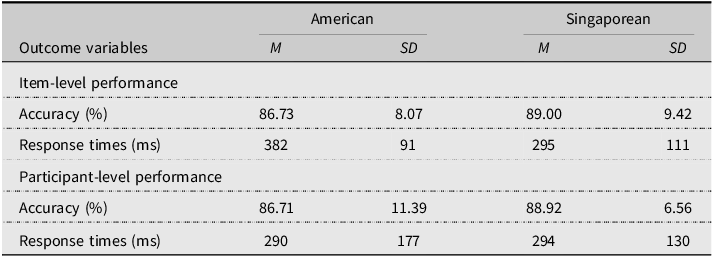
As seen in Table 6, both the American and Singaporean samples have generally high accuracy and low response times when separately grouped under both items and participants. Auditory Lexical Decision Task performance is thus satisfactorily high and largely similar across both samples.
Summary of task performance of both American and Singaporean samples
Analytic approach
As two outcome variables were associated with the Auditory Lexical Decision Task (response time and accuracy), there were two types of mixed-effects models analyzed below: Linear mixed-effects regression for response time, and logistic mixed-effects regression for accuracy. Each model had two random effects (participant and item) included as random intercepts in all models; these two effects are modeled by convention in psycholinguistics (Brown, Reference Brown2021).
As for fixed effects, there were three separate sets of predictors: (i) network measures (degree and LCC), (ii) phonological and lexical measures (word frequency, duration of speech files of target items, and phoneme length), and (iii) dialectal variables (dialect of talker and dialect of participants). For network measures, although the items had been selected on the basis of two crossed dimensions (four conditions), both degree and LCC were modeled as continuous, rather than categorical, variables to increase statistical power (DeCoster et al., Reference DeCoster, Gallucci and Iselin2011). Since there were two different networks (AmE-Net and SgE-Net), separate models were constructed such that each model had the same set of fixed predictors, except that the degree and LCC values were extracted from a different corresponding network (SgE or AmE). As for phonological measures, the duration of speech files was only included for accuracy (and not RT) models, as this has been indirectly accounted for in the RT outcome measure. Additionally, for word frequency, it was included as a covariate because of its exceptionally strong influence on word recognition (Slote & Strand, Reference Slote and Strand2016). Lastly, dialect predictors include the dialect spoken by both the participant and the talker of the target items he/she had heard. This was included to determine the extent to which dialectal differences would affect performance. All fixed effects for both network and phonological measures were standardized for ease of interpretation, as they are on different scales.
Models were constructed using the lme4 package (Bates et al., Reference Bates, Mächler, Bolker and Walker2015) in R. For accuracy as the outcome variable, binomial (logit) mixed models were fit by Maximal Likelihood (Laplace approximation) with the bobyqa optimizer (Powell, Reference Powell2009). This particular optimizer was chosen for faster parameter optimization and avoidance of non-convergence warnings (Miller, Reference Miller2018). For RT as the outcome variable, linear mixed models were fit by REML, and p-values were estimated from t-tests using Satterthwaite’s degrees of freedom approximation as provided by the lmerTest package (Kuznetsova et al., Reference Kuznetsova, Brockhoff and Christensen2017) in R.
Model comparisons
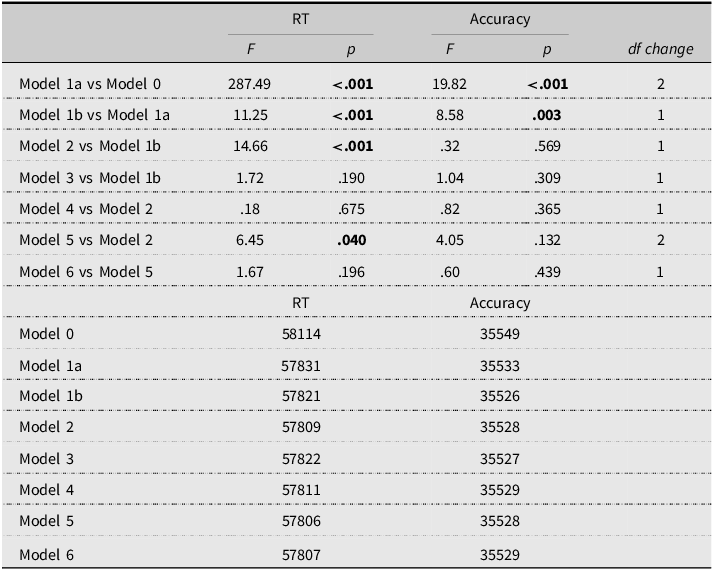
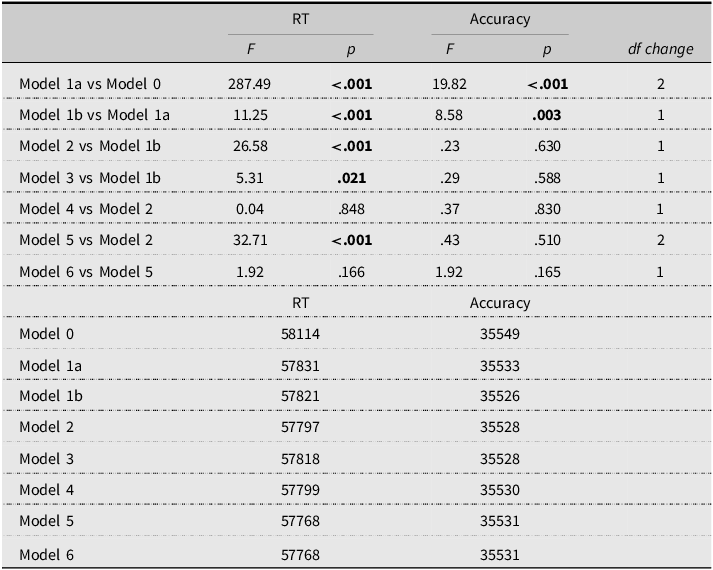
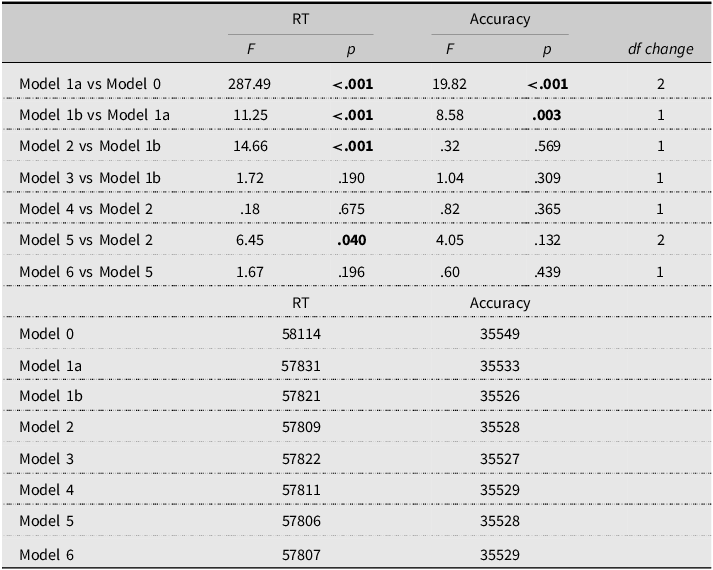
The final models were chosen in a stepwise selection procedure. This was done to minimize model complexity while ensuring that the subset of predictors with the most explanatory power for Auditory Lexical Decision Task performance was retained. Model comparisons were made (Tables 7 and 8) using the ANOVA F-test to compare nested models (the mixed models for RT as an outcome were refitted from REML to ML for model comparison) as well as the Akaike information criterion (AIC) to identify the optimal model, which had minimal AIC. For both accuracy and RT as outcome variables, a baseline model (Model 0) with lexical and phonological measures (word frequency, duration of speech files of target items (for accuracy only), and phoneme length) as covariates, and both participants and items as random effects, was first constructed. Models with the dialectal variables were then added, first as independent effects (Model 1a), then as an interaction effect (Model 1b), to determine whether dialectal differences are important in influencing lexical decision performance above that of covariate measures. There were then further intermediate models done to evaluate the separate contributions of both network measures (Models 2–4). With the effect of both dialectal types and network measures having been demonstrated to contribute independently to ADLT performance, models with interactions between these predictors (Models 5 and 6) were then proposed.
Summary of model comparisons for AmE-Net and their AIC values
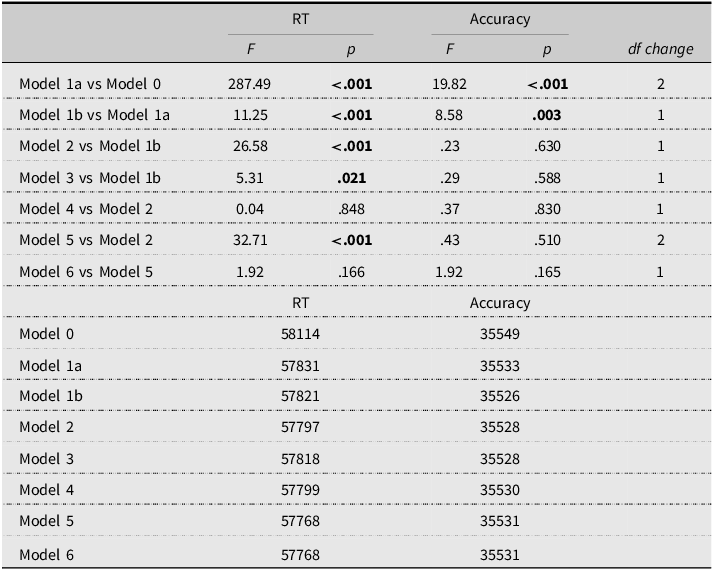
p-values < .05 are highlighted in bold.
Model 0: WF + NPhon + Dur + (1|SubjectID) + (1|Item). Dur was excluded for RT.
Model 1a: Model 0 + Natl + Spkr. Natl refers to the nationality of participants, and Spkr refers to the nationality of the talker of the target items.
Model 1b: Model 0 + Natl × Spkr.
Model 2: Model 1b + AmE-Net degree.
Model 3: Model 1b + AmE-Net LCC.
Model 4: Model 1b + AmE-Net degree + AmE-Net LCC.
Model 5: Model 1b + AmE-Net degree × Natl + AmE-Net degree × Spkr.
Model 6: Model 0 + AmE-Net degree × Natl × Spkr.
Summary of model comparisons for SgE-Net and their AIC values
p-values < .05 are highlighted in bold.
Model 0: WF + NPhon + Dur + (1|SubjectID) + (1|Item). Dur was excluded for RT.
Model 1a: Model 0 + Natl + Spkr. Natl refers to the nationality of participants, and Spkr refers to the nationality of the talker of the target items.
Model 1b: Model 0 + Natl * Spkr.
Model 2: Model 1b + SgE-Net degree.
Model 3: Model 1b + SgE-Net LCC.
Model 4: Model 1b + SgE-Net degree + SgE-Net LCC.
Model 5: Model 1b + SgE-Net degree * Natl + SgE-Net degree * Spkr.
Model 6: Model 0 + SgE-Net degree * Natl * Spkr.
Tables 7 and 8 report the AIC values of all proposed models and the results of ANOVAs that are used to first compare the extent to which the intermediate models were a better fit to the data than the baseline model and then subsequently compare the extent to which the full model was a better fit than these intermediate models. Based on the AIC values, when RT is the outcome variable, Model 5 is the best model as it is significantly better at explaining the data than other models in spite of its increased complexity; this holds true regardless of whether the network measures used come from AmE-Net or SgE-Net. As for accuracy as an outcome variable, Model 1b is the best model, as other models with greater complexity fail to provide a significantly better fit; this applies for network measures taken from either AmE-Net or SgE-Net. These results suggest that (i) dialectal differences in both talker and participant have an important role in spoken word recognition, and (ii) network measures provide additional contributions to explaining spoken word recognition beyond that of dialectal differences, but only for degree and only when RT is the outcome variable.
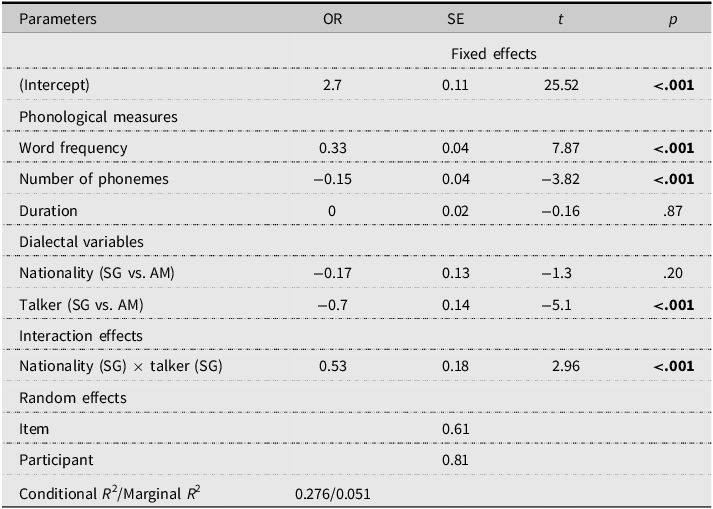
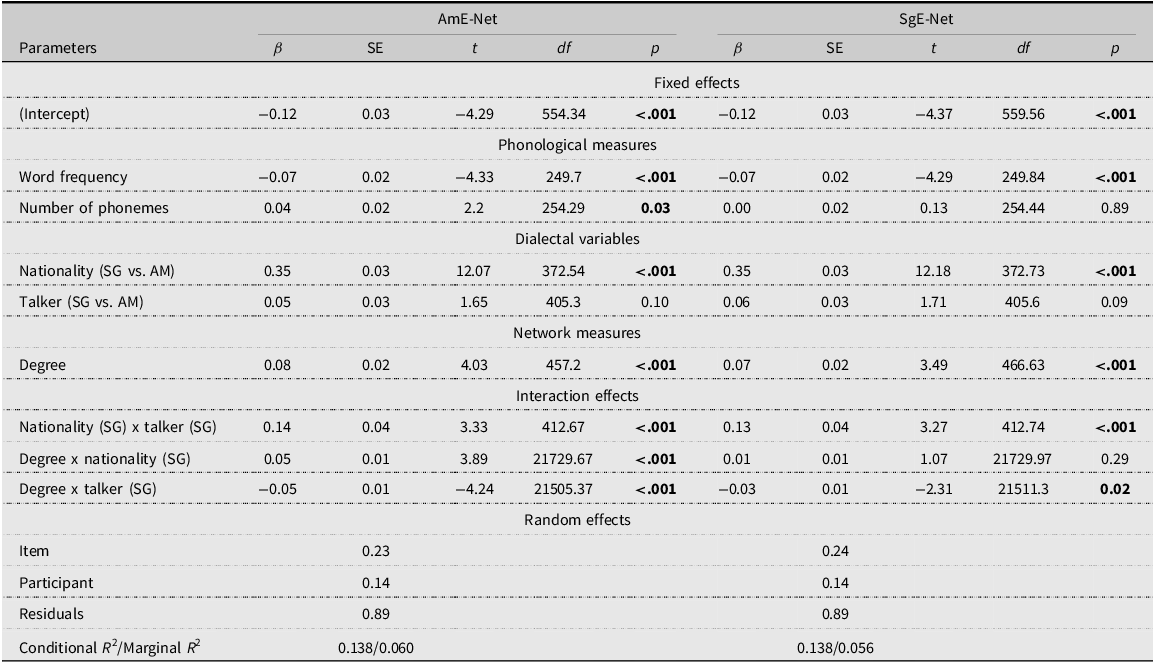
Tables 9 and 10 show the best-performing regression models for accuracy (Model 1b) and response time (Model 5), respectively; these had been found to have the lowest AIC among all models previously proposed (Tables 7 and 8).
Model 1b (dialectal variables) for accuracy rates in the Auditory Lexical Decision Task
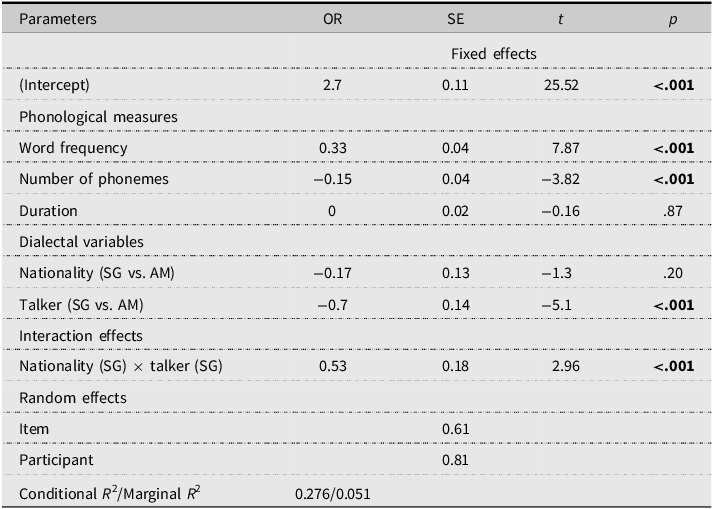
Note: Significant (p ≤ .05) parameters are in bold. OR = Odds Ratio.
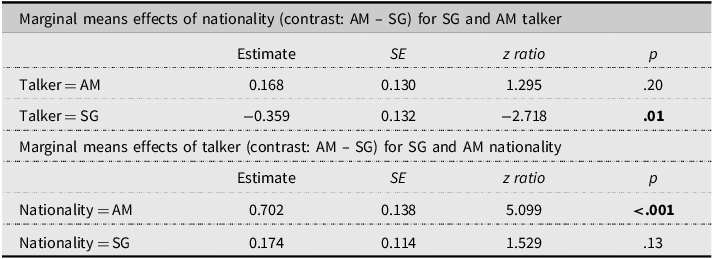
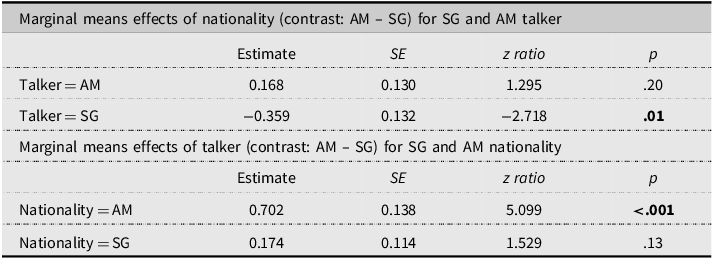
Marginal means of the talker and nationality interaction effect on accuracy
Accuracy model
For accuracy as an outcome variable (Table 9), while neither network measure had a significant effect, the dialect of the talker had an effect. Participants were less accurate when hearing words spoken by the Singaporean talker instead of the American talker. However, this effect of talker dialect is qualified by a significant interaction with the participants’ dialect.
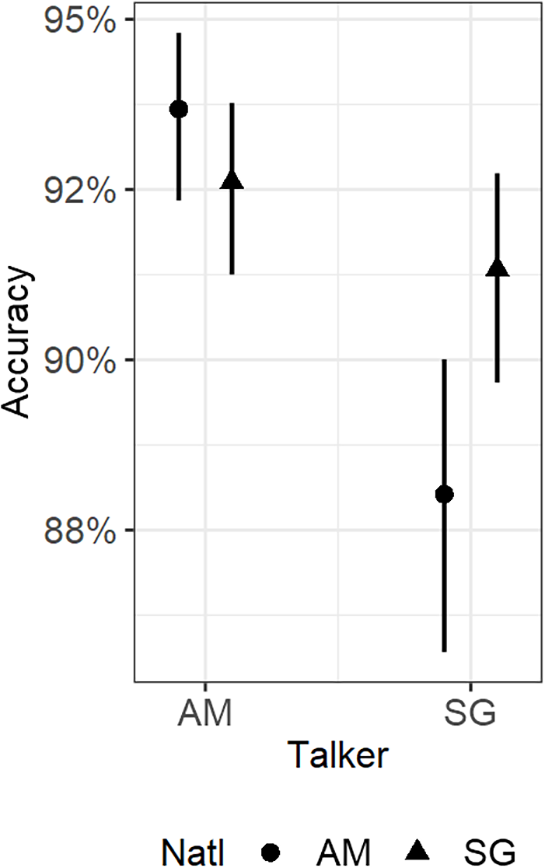
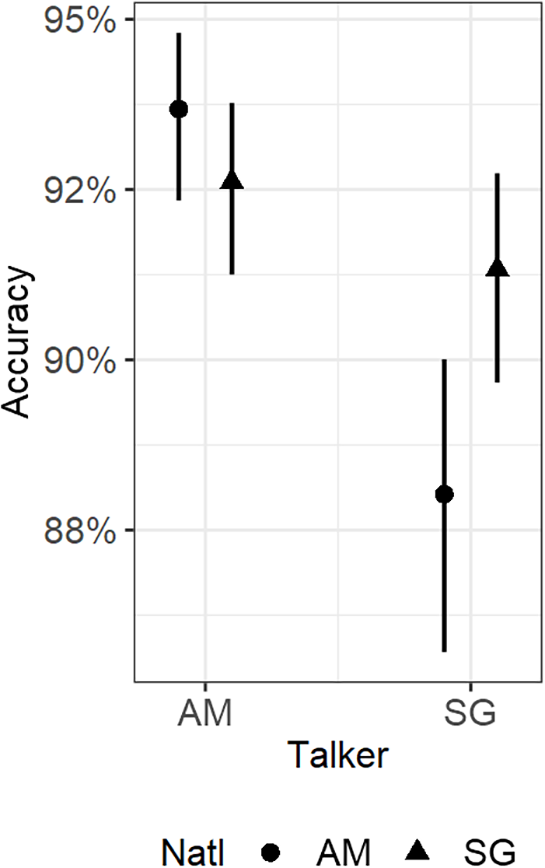
Interaction of talker and nationality on Accuracy: As seen in Figure 7 and Table 10, when the words were spoken by the American talker, accuracy rates were similar across both participant groups. However, when the words were spoken by the Singaporean talker, American participants were significantly less accurate than Singaporean participants. When looking at the marginal effect of talker across nationality, accuracy rates for both talkers were similar for the Singaporean participants, but American participants were significantly less accurate for words spoken by the Singaporean talker as compared to words spoken by the American talker.
Interaction effect of nationality and talker on accuracy.
RT models
For response time as an outcome variable (Table 11), for both networks, there was a significant effect of nationality, with Singaporean participants being generally slower to respond than American participants. However, this effect of participants’ dialect is qualified by two significant, separate interactions with both the participants’ dialect and the degree of target words. Additionally, the degree of target words had a significant effect on response time for both networks. In general, for both AmE-Net and SgE-Net, words with a higher degree were more slowly responded to than words with a lower degree; this effect of degree is qualified by two significant, separate interactions with both the nationality of participants and the dialect of the talker.
Model 5 (dialectal variables and network measures) for response time in the Auditory Lexical Decision Task
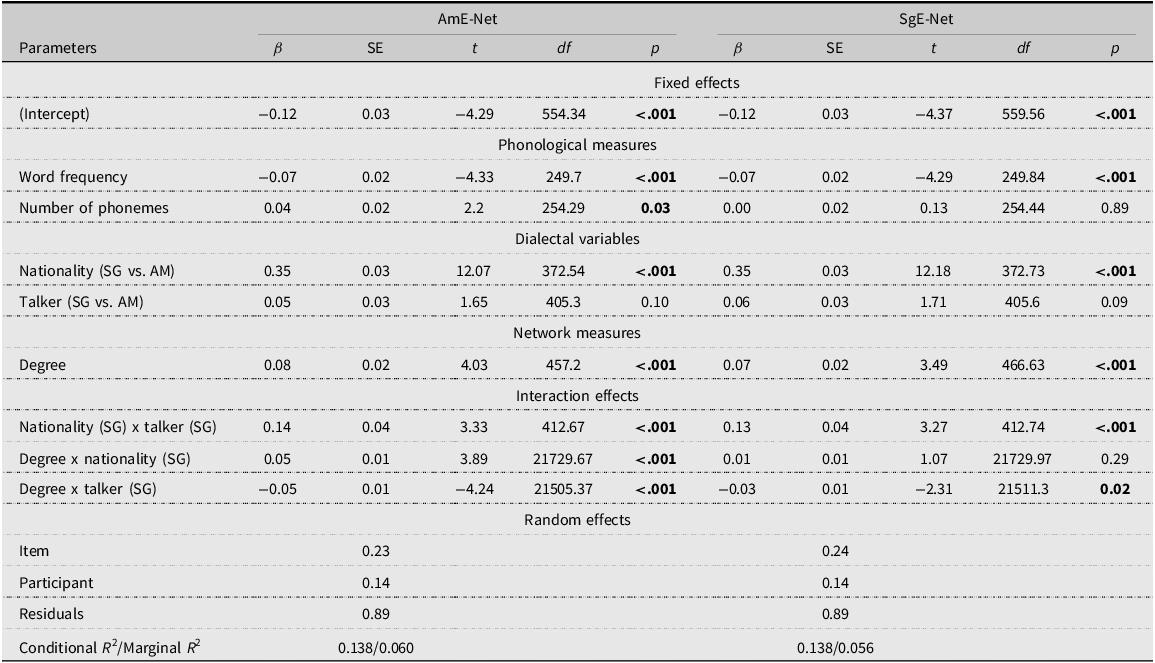
Table 11. Long description
The table presents data for response time as an outcome variable, comparing AmE-Net and SgE-Net. It includes fixed effects such as intercept, phonological measures, dialectal variables, network measures, and interaction effects. The table has 21 rows and 10 columns. Column headers are Parameters, beta, SE, t, df, p, beta, SE, t, df, p. Row labels include Fixed effects, Phonological measures, Dialectal variables, Network measures, Interaction effects, Random effects, and Conditional R-squared/Marginal R-squared. Each row provides values for AmE-Net and SgE-Net. Notable trends include significant effects of nationality, degree of target words, and interactions between these variables.
Note: Significant (p ≤ .05) parameters are in bold.l.
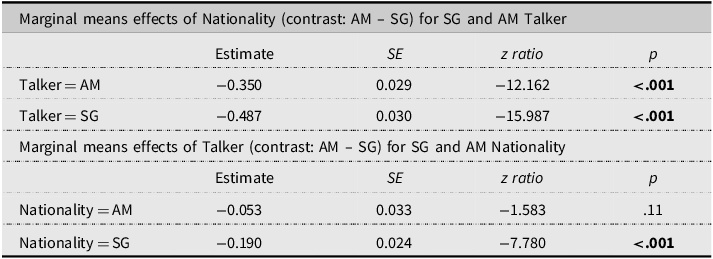
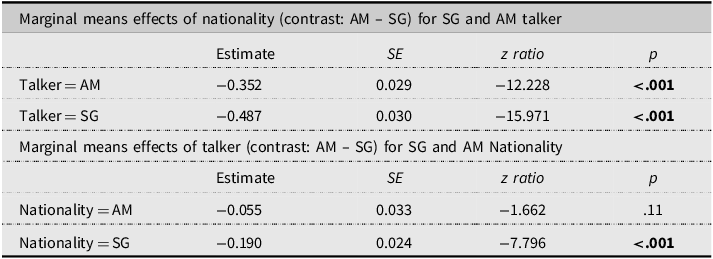
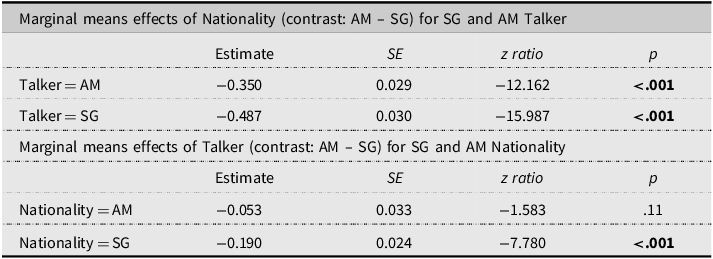
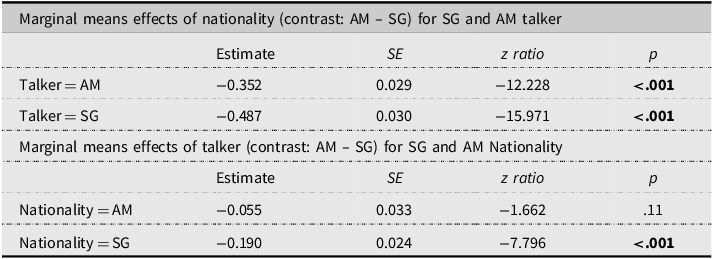
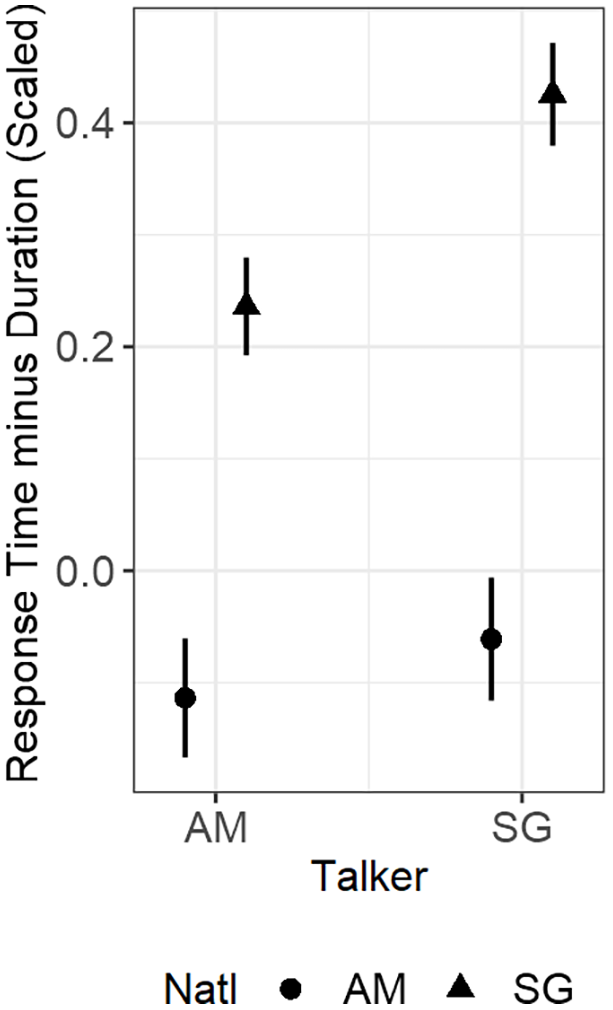
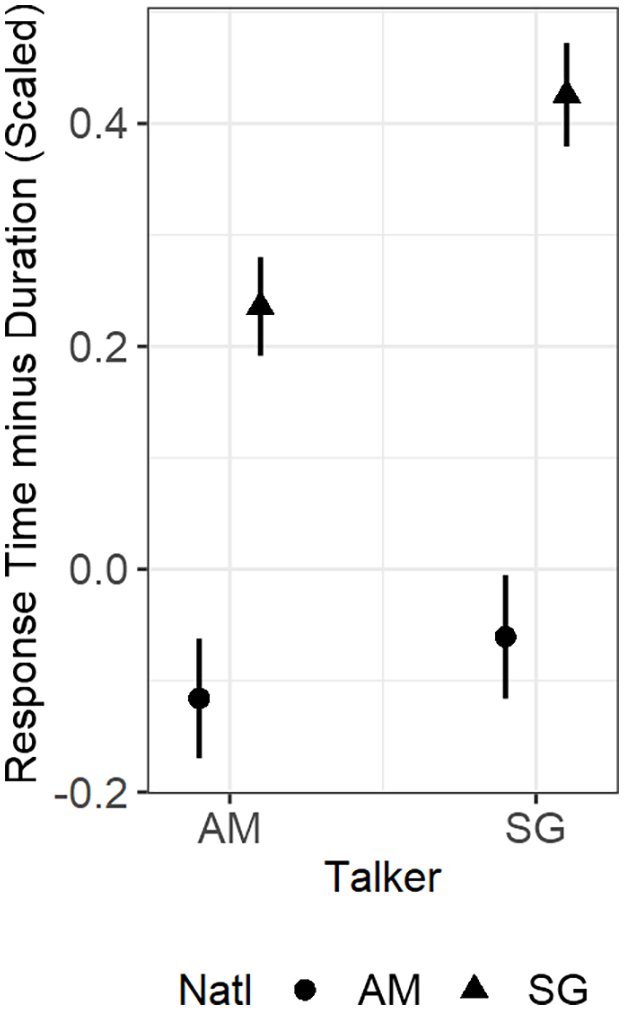
Interaction of talker and nationality on response times: As seen in Tables 12 and 13 and Figures 8 and 9, the nature of this interaction effect is similar across both networks. Across both talkers, American participants responded significantly faster than Singaporean participants. When looking at the marginal effect of talkers across nationalities, RTs to both talkers were similar for the American participants, but Singaporean participants were significantly slower for words spoken by the Singaporean talker as compared to words spoken by the American talker.
Marginal means of the talker and nationality interaction effect on response time (AmE-Net)
Marginal means of the Talker and Nationality interaction effect on response time (SgE-Net)
Interaction effect of talker and nationality on response time (AmE-Net).

Interaction effect of talker and nationality on response time (SgE-Net).

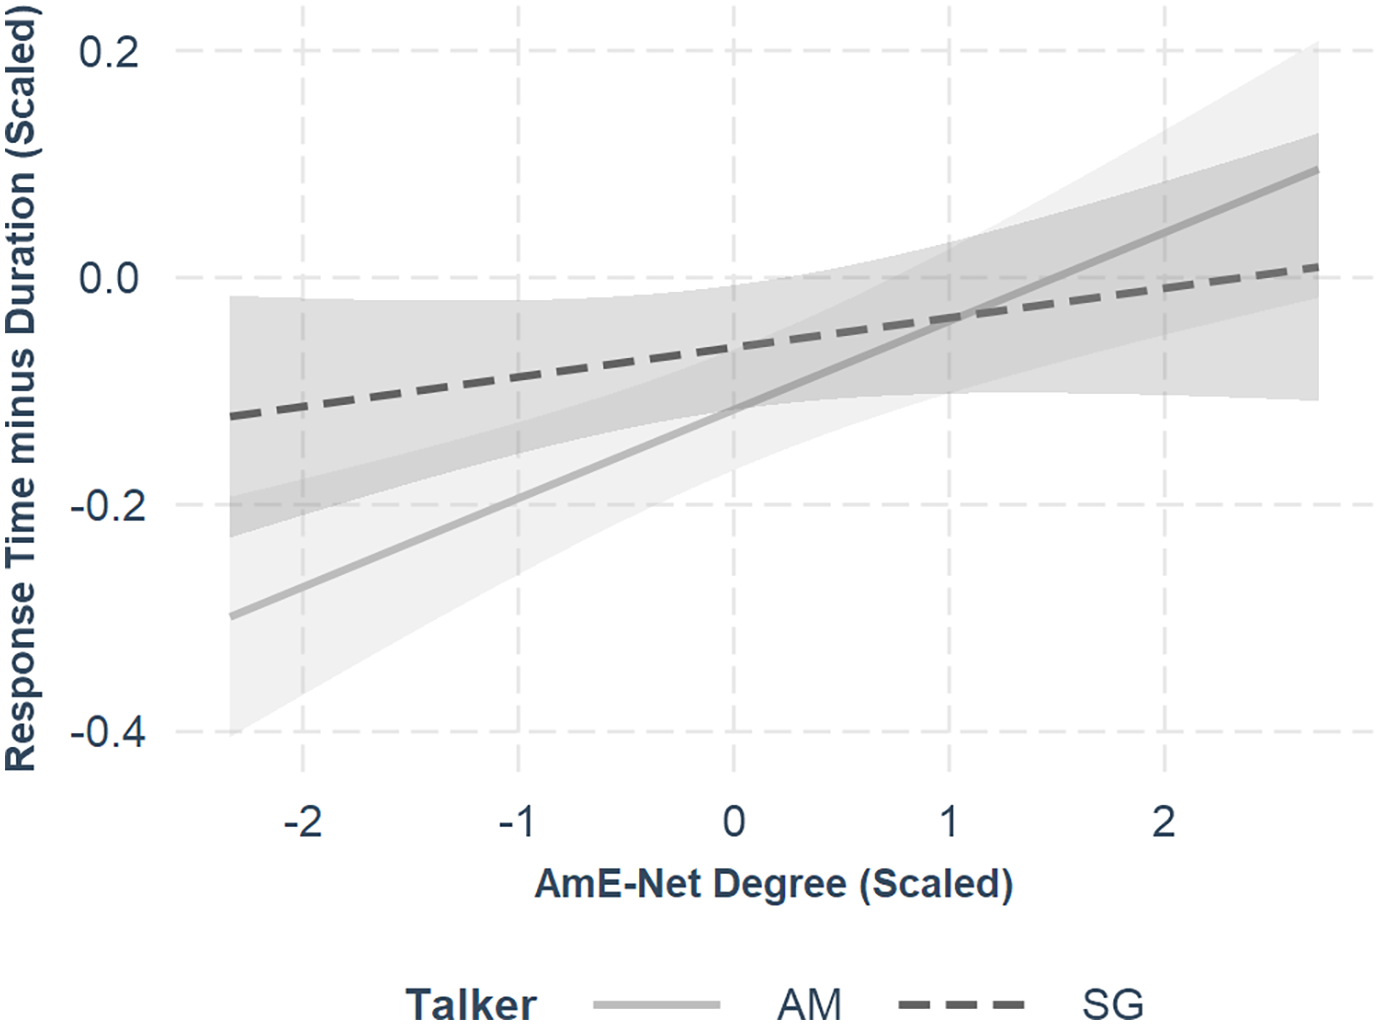
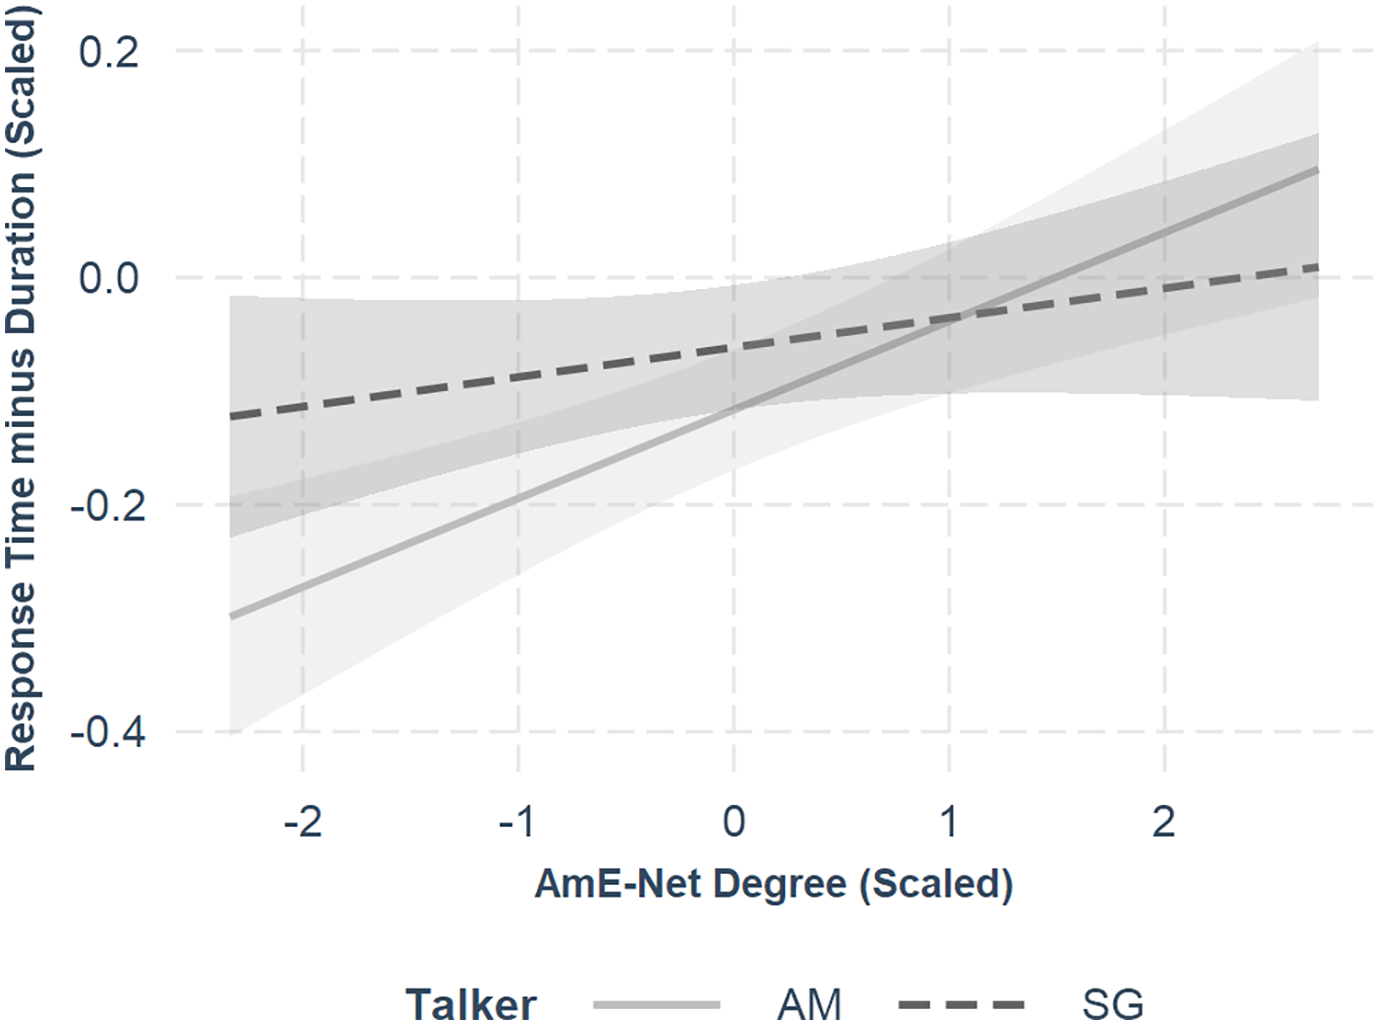
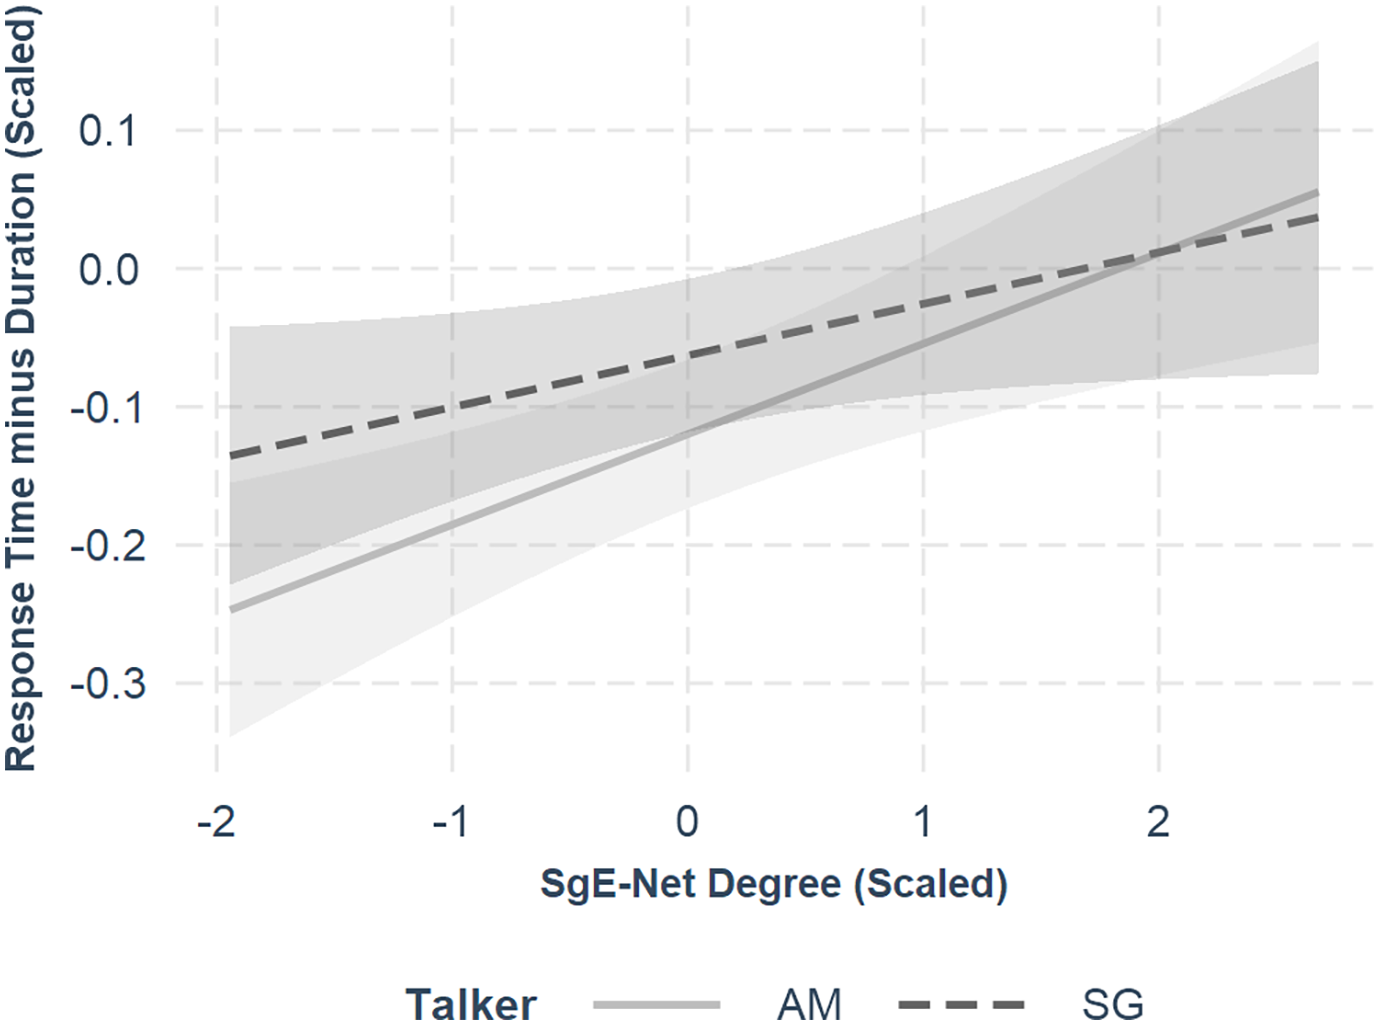
Interaction of degree and talker on response times: As seen in Figures 10 and 11 and Tables 14 and 15, the simple slope of both degree types (SgE-Net and AmE-Net) was positive and significant when the talker was American. Hence, words spoken by the American talker with a higher degree take longer to be responded to as compared to lower-degree words. When the talker was Singaporean, the simple slope of the SgE-Net degree was positive and marginally significant, whereas the simple slope of the AmE-Net degree was not significant.
Interaction effect of degree and talker on response time (AmE-Net).
Interaction effect of degree and talker on response time (SgE-Net).
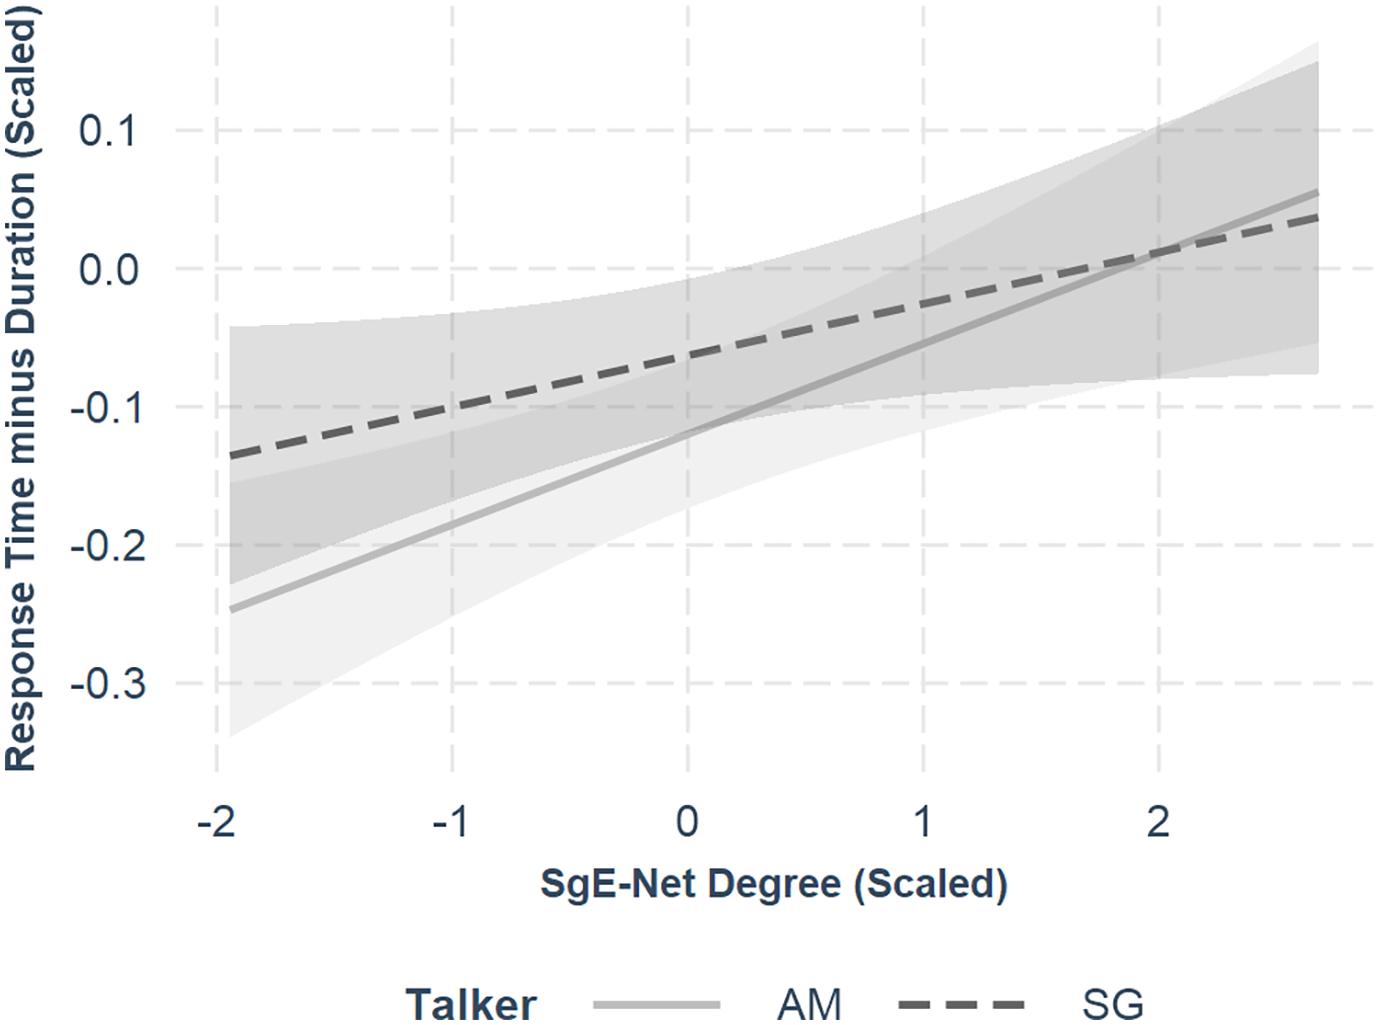
Simple slopes of the degree and talker interaction effect on response time (AmE-Net)

Simple slopes of the degree and talker interaction effect on response time (SgE-Net)

Focusing on the magnitudes of the simple slopes, it appears that across both network types, the effect of degree on response time is stronger when participants (regardless of their own dialect) are exposed to words spoken by the American talker, and the effect is smaller for words spoken by the Singaporean talker. Specifically, the effect of AmE-Net and SgE-Net degrees on response time is significant when the talker is American. In contrast, when the talker is Singaporean, the effect of the SgE-Net degree is marginally significant, and the effect of the AmE-Net degree is non-significant.
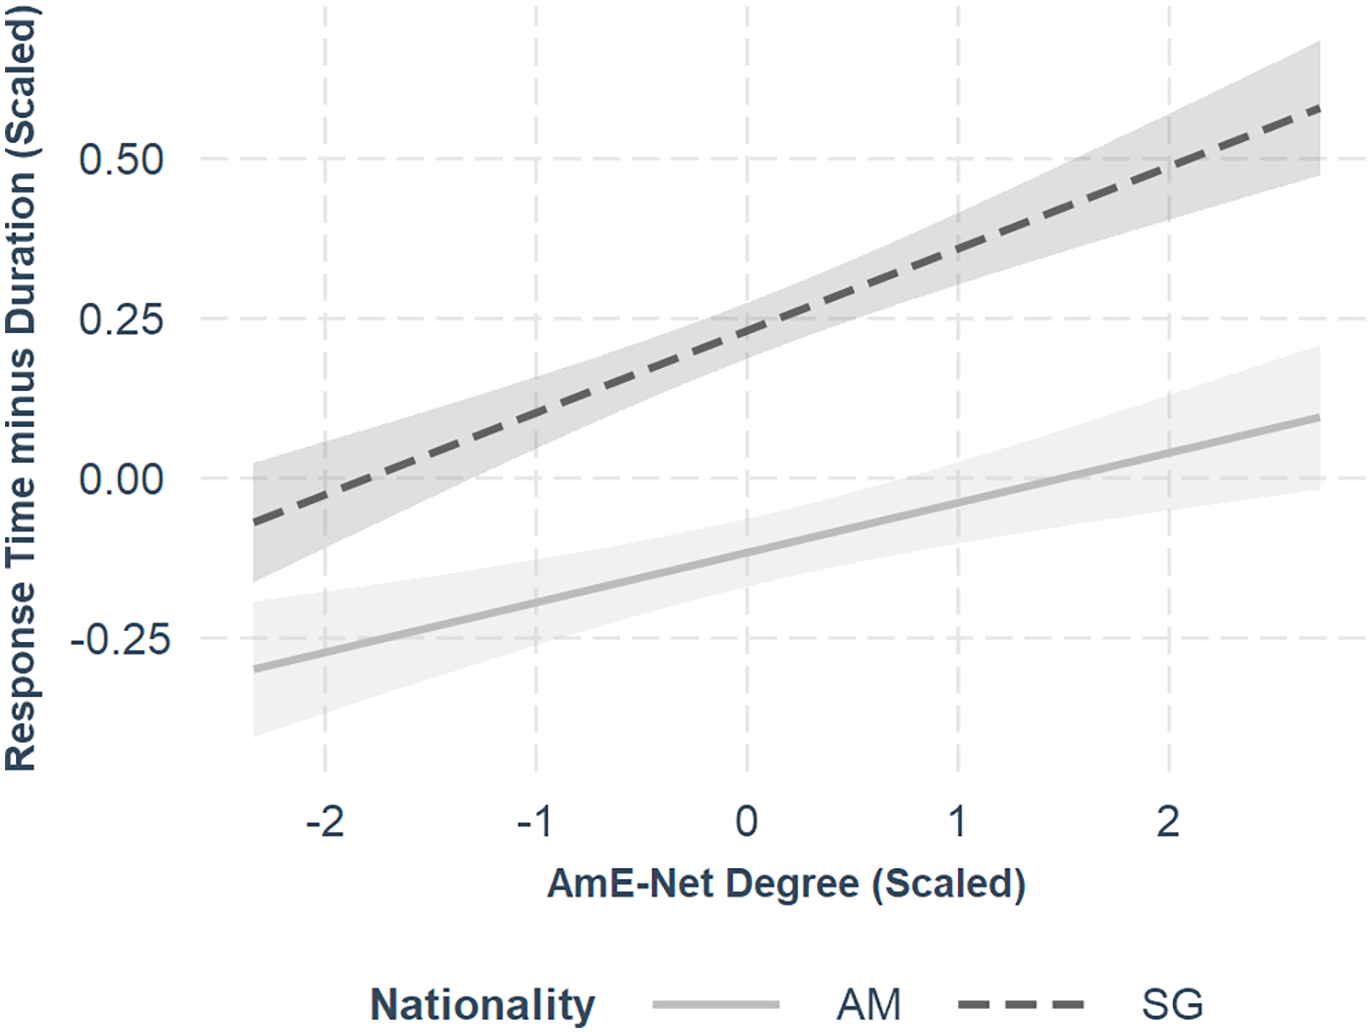
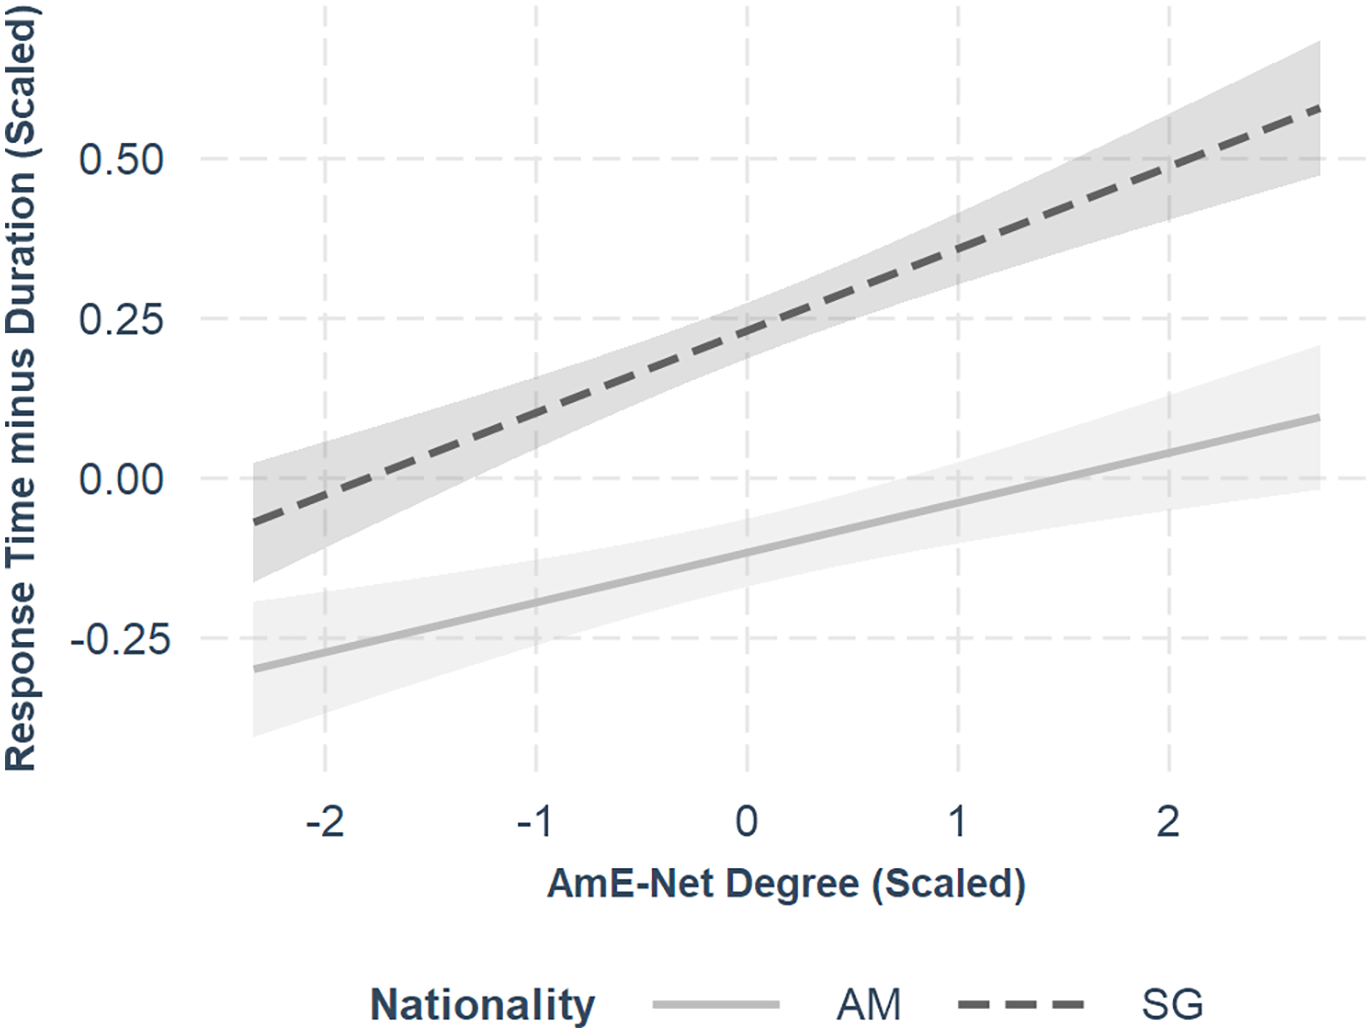
Interaction of degree and nationality on response times: This interaction effect was significant for the AmE-Net model and not SgE-Net. As seen in Table 16 and Figure 12, the simple slope of degree was positive and significant for both nationalities, such that words with higher degrees take longer to be responded to. However, focusing on the magnitudes of the slopes, there was a stronger effect of AmE-Net degree for the Singaporean participants than for the American participants.
Simple slopes of the degree and nationality interaction effect on response time (AmE-Net)

Interaction effect of degree and nationality on response time (AmE-Net).
General discussion
This article aimed to investigate the influence of cultural differences among dialects of a language on spoken word recognition and validate the utility of the network science approach to identify said differences. Consequently, separate phonological networks for AmE and SgE were constructed, and their network measures were used in predicting the performance of participants of two different nationalities (Singaporean and American) in a multi-talker Auditory Lexical Decision Task. This enabled us to investigate whether a phonological network of a localized dialect would be better at explaining Auditory Lexical Decision Task performance of participants who spoke that same dialect than a phonological network of a different dialect. We had hypothesized that network measures (degree and LCC) would be significant predictors of task performance and have significant interactions with both nationality and talker. In particular, the strongest effect for predicting both accuracy and response time should occur when network measures from the participant’s localized network are combined with exposure to auditory tokens spoken from a talker of the same dialect. This was not observed, however, as our results indicated that the localized network was not necessarily superior to the other network.
Evaluating phonological network measures
Degree: Similar to previous studies (Castro & Vitevitch, Reference Castro and Vitevitch2023; Chan & Vitevitch, Reference Chan and Vitevitch2015), degree was a significant predictor of lexical retrieval performance in this study, such that words with more phonological neighbors in the network were responded to more slowly than words with fewer neighbors. This was observed for both types of degree values extracted from the AmE and SgE networks. However, this was only observed for response times, not for accuracy. When a word has more neighbors, this could result in activation becoming more diffused across the neighborhood, thereby increasing response times and reducing accuracy (Stella & Brede, Reference Stella and Brede2016). Similar findings were found in simulations of spreading activation in phonological networks by Vitevitch et al. (Reference Vitevitch, Ercal and Adagarla2011). Recall that degree in a phonological network directly corresponds to a conventional metric in psycholinguistics known as phonological neighborhood density (Luce & Pisoni, Reference Luce and Pisoni1998). Hence, this finding provides more empirical support for the phonological neighborhood density effect in spoken word recognition studies, in particular providing a first demonstration that network metrics derived from a phonological network of a less studied dialect can replicate known phonological neighborhood effects. This highlights the relevance of the phonological network in visualizing the mental lexicon of various languages and dialects and showcases its utility in explaining the underlying mechanisms implicated in language processing.
One possible explanation for why degree was not a significant predictor of accuracy could be due to insufficient power in the current design to detect its effect. As the participants were all native speakers of English, the effects of degree may be very small and highly dependent on the nature of neighbors for each word, thus only emerging in reaction times and not in accuracy, where there was generally very high performance across participants. It is possible that the subtle effects of degree on accuracy may only be observable when much larger sets of words are included, as in a megastudy. For instance, in Winsler et al. (Reference Winsler, Midgley, Grainger and Holcomb2018), a sample of 1,100 words was used to measure the effect of phonological neighborhood density in an Auditory Lexical Decision Task. Such megastudy approaches could be adopted for future phonological network studies.
LCC: Contrary to initial expectations, LCC was not retained as a predictor for the best model ultimately chosen for both outcome variables in the present study for both networks. This contrasts with a similar study by Chan and Vitevitch (Reference Chan and Vitevitch2009), which identified a strong effect for LCC in both Auditory Lexical Decision Task and Perceptual Identification Task paradigms. Such a discrepancy may be attributed to the lower power of past study designs or the use of now-outdated statistical methods such as separate repeated measures ANOVA, which considers the random effects of participants and items separately. As there could have been some interaction between both random effects, including both in the same model (as was done in this article) may have reduced the influence of these interactions on the final results (Baayen et al., Reference Baayen, Davidson and Bates2008). Moreover, instead of subjecting the key predictor to a median split, we retained it as a continuous variable in our models (DeCoster et al., Reference DeCoster, Gallucci and Iselin2011). The analytic approach adopted in this article is consistent with more recent research papers in the field of psycholinguistics (Keuleers & Balota, Reference Keuleers and Balota2015), in contrast to factorial approaches used in previous work. With this approach, we did not observe a significant effect of LCC in our analyses. Future work could investigate the LCC effect using larger stimulus sets or by adopting a megastudy approach to achieve more power to detect its subtle effects.
Comparing the AmE and SgE phonological networks
One of the goals of this research was to compare the ability of phonological degree values derived from AmE-Net and SgE-Net to account for Auditory Lexical Decision Task performance by Singaporean and American participants. Regarding our choice of task and its relevance to our study objectives, this task assesses processing efficiency and sensitivity to phonological neighborhood structure rather than its impact on intelligibility (Chan & Vitevitch, Reference Chan and Vitevitch2009). All stimuli were highly familiar lexical items, and accuracy rates approached the ceiling for both groups of participants when exposed to either English dialect (Table 6). Thus, any perceived differences observed across dialects likely reflect variation in activation dynamics within the mental lexicon rather than comprehension failure. In this sense, our findings reflect the difference in influence of adjacent phonological neighbors (from the two different network representations) on spoken word recognition.
Here, we first focus on the two interaction effects that involved degree: degree x talker (which was observed in both networks) and degree x nationality (which was only observed in the AmE network). To recap the pattern of the interaction effects, for the degree x talker interaction, there was a significant effect for the degree of words as calculated from AmE-Net when the talker is American. In contrast, there is a significant effect for the degree of words as calculated from SgE-Net for both American and Singaporean talkers, and the American talker unexpectedly produced a stronger effect on SgE-Net degree than the Singaporean talkers. For the degree x nationality interaction, the degree of words as calculated from AmE-Net had a significant effect for both nationalities, with a stronger effect for Singaporean participants than American participants.
These results are not easy to interpret. The first key takeaway message is that the network from which degree values are computed matters in spoken word recognition studies, with its effect mediated by the participant’s own dialect as well as the dialect of the talker who produced the auditory tokens. However, when we scrutinize the interaction effects closely, the results do not clearly support our initial hypothesis that the localized degree measure obtained from the network of the same dialect spoken by the listeners would be superior to the same measure obtained from an alternative network of another dialect.
Focusing on the degree x talker interaction, on the one hand, the generally greater magnitudes of the AmE-Net simple slopes suggest that the AmE-Net may be the superior network model for either participant group. On the other hand, the combined observations that (i) the simple effect of SgE degree was marginally significant for the Singaporean talker and (ii) the simple effect of AmE degree was non-significant for the Singaporean talker, as well as (iii) a drop in slope magnitude for the American talker from AmE-degree to SgE-degree suggest that a localized network may be superior in providing phonological measures that are more accurate and aligned with the talker’s lexicon.
Turning to the degree x nationality interaction, it was surprising to see that AmE degree was a stronger predictor for Singaporean participants relative to American participants (standardized estimate = 0.13 vs. 0.08). Although we had previously identified the overlap of words with similar pronunciations in the giant component for both AmE and SgE networks to be rather modest (Table 3), such an observation could suggest that these overlapping word pronunciations highlight a certain degree of awareness of AmE phonology among Singaporeans.
Various theoretical accounts can provide explanations for the apparent contradictory advantage of AmE-Net for Singaporean listeners. Lexical decision tasks require rapid phonological normalization and phonetic categorization, processes that draw on previously entrenched phonological mappings in the mental lexicon (Kraljic & Samuel, Reference Kraljic and Samuel2006). In exemplar-based models of cognitive processing, lexical representations consist of accumulated episodic traces, and recognition is fastest for words whose exemplars are easiest to retrieve (Goldinger, Reference Goldinger1998; Nijveld et al., Reference Nijveld, Ten Bosch, Ernestus, Wolters, Livingstone, Beattie, Smith and MacMahon2015). If we consider the combined effects of perceptual learning mechanisms and the accumulation of spoken word exemplars in the lexicon, Singaporean participants are likely to encode a greater diversity of phonological mappings (both AmE and SgE pronunciations) than the American participants. In particular, we speculate that for the younger Singaporean listeners in our sample, their extensive exposure to AmE through media may produce perceptual learning effects that increase the accessibility of AmE phonological representations relative to SgE phonological representations. Under speeded conditions, time pressure may lead to these more strongly entrenched mappings to be preferentially activated (Norris et al., Reference Norris, McQueen and Cutler2003), yielding stronger predictive effects for AmE-Net metrics. Another potential reason for why AmE-Net effects are stronger from Singaporean participants is that SgE phonological representations are not as strongly encoded in the lexicon due to greater sociolinguistic variation in SgE pronunciations (Deterding, Reference Deterding2007). In other words, the SgE phonological representations are more “distributed” or less precisely encoded across a broader representational space, thereby reducing the predictive strength of SgE-Net network measures in this task.
This complex pattern of results could be supported by the higher-than-expected influence of AmE on SgE. With Singaporeans being increasingly accustomed to hearing AmE from consistent exposure to American media (Fullerton et al., Reference Fullerton, Hamilton and Kendrick2007; Tan & Castelli, Reference Tan and Castelli2013), differences between the phonological features of SgE and AmE may not be as distinct as previously observed. As noted by Tan (Reference Tan, Leitner, Hashim and Wolf2016), there have been gradual shifts toward favoring AmE phonetic features in Singaporeans, especially among the younger generation. Such shifts include postvocalic r, the diphthong [eɪ] in tomato, and the vowel [æ] in gasp (Tan, Reference Tan, Leitner, Hashim and Wolf2016). Moreover, Singaporeans generally tend to be more aware of, and attuned to, different dialects of English, due to Singapore being a cosmopolitan multiracial country. For instance, Singaporeans were found to be more capable of understanding the spoken English of L2 learners than Canadians, who had only been exposed to North AmE-Net (Saito & Shintani, Reference Saito and Shintani2016). As such, bearing in mind that Singaporeans likely regularly encounter a more varied range of English dialects than Americans, this differing exposure to other dialects could possibly help account for the observation in our study that the AmE network appears to be the better network model for Singaporean participants.
However, we note that these apparent cross-dialect exposure effects appear to only be unidirectional, as they are evident for AmE words when spoken to Singaporeans, but not for SgE words when spoken to Americans. The observation that American participants showed lower accuracy for SgE words as compared to AmE words (Figure 7) indicates that Americans are less accurate in recognizing the same words when they are spoken in a less familiar accent. Such a finding provides further evidence that the unexpectedly strong perception of AmE in Singaporeans is possibly due to greater familiarity with the other dialect, but not vice versa. As previously noted, SgE does share some overlaps in phonology with AmE (Tan, Reference Tan, Leitner, Hashim and Wolf2016), and the phonological network of SgE contains some similarities in pronunciations for words with AmE. However, the converse (SgE pronunciations in AmE) is not as evident, given that SgE draws pronunciations from British English (BrE) as well (Gu & Chen, Reference Gu and Chen2020). Therefore, the “hybridized” accent of SgE may result in greater difficulties for American participants in identifying the corresponding words in their mental lexicon due to reduced phonological similarity between AmE and SgE. Similar findings were noted in a study comparing participants from other regions in the US and participants born and raised in New York City (NYC). For participants who lacked exposure to the NYC accent, out-of-dialect forms (i.e., unique pronunciations in the NYC accent) were more likely to be perceived as non-words owing to the greater processing cost for both recognition and lexical activation (Sumner & Samuel, Reference Sumner and Samuel2009). Hence, these results suggest that a key factor in influencing the success of cross-dialect perception is the extent to which crucial phonological differences between dialects are encoded in the mental lexicon.
To determine whether prior exposure to AmE did indeed have a large influence on the mental lexicon of Singaporean participants, future psycholinguistics studies could attempt to first control for differences in exposure to American media. They could ask participants for their media consumption habits through the use of an American media consumption scale, such as that in Willnat et al. (Reference Willnat, He and Xiaoming1997). As this was not done in this study, one explanation for the discrepancy between both studies is that AmE-Net might have been a better model than expected for the internal mental lexicon of some Singaporean participants who are more exposed to AmE pronunciations. To better capture such nuances, a study method similar to that of Lau and Ho’s (Reference Lau and Ho2023) investigation of shifting patterns in Hong Kong English phonology can be carried out. Hong Kong is another cosmopolitan Asian city with notable Western pop culture exposure, similar to Singapore. To account for this, prior to monitoring how word pronunciations in young Hong Kongers have evolved in response to Western influence, Lau and Ho first surveyed participants on the extent of their relative exposure to AmE and BrE and preferences for either dialect as opposed to their own local Hong Kong English dialect. Such an approach enables a clearer elucidation of the effects of media exposure on an individual’s own speech patterns and corresponding mental representations.
Implications for dialectal differences on spoken word recognition
Across the psychological sciences, there is a noticeable skew in the demographics of participants. The majority of participants come from “Western, Educated, Industrialized, Rich, and Democratic” (WEIRD) populations (Henrich et al., Reference Henrich, Heine and Norenzayan2010), and consequently, findings derived from these studies typically assume that the underlying psychological processes are indeed universal and can be generalized to any other population in our world. Such concerns are even more striking in psycholinguistic research, where most language studies are conducted on the basis of the standard prestige dialect of a given language, and the other diverse “Minority, Indigenous, Non-standard(ized), and Dialect” (MIND) varieties are often overlooked (Kirk, Reference Kirk2023). For instance, most English psycholinguistic database norms are largely based on studies involving either American or British English samples, both of which are simply grouped under “English” (Buchanan et al., Reference Buchanan, Valentine and Maxwell2019). However, as demonstrated by our study, such a simplified categorization of psycholinguistic research fails to capture the reality of how dialectal differences can produce tangible effects on word recognition across cultures. Most notably, in attempting to generate a local (Singaporean) phonological network instead of simply using one from a standard dialect of English (e.g., AmE) and testing its applicability on a local (Singaporean) sample, the presence of differing results across both networks and participant nationalities in our study highlights that there are perceptible differences in word recognition between dialects, even if the patterns are more nuanced than we had expected. Our study findings, hence, demonstrated that there are still notable gaps in psychological research, as the effects of dialect differences on language processes still remain less studied. Additionally, our findings lend support to the observation that variations in exposure to different dialects can have tangible contributions toward the mental lexicon and shape its structure.
Limitations and future directions
The AELP has limited availability of phonological metrics and lexical-semantic variables that are specific to the Singaporean context. Although some variables had Singapore equivalents, such as NUS Familiarity Ratings, most variables came from prior studies involving Americans (Goh et al., Reference Goh, Yap and Chee2020). This dominance of standard AmE being used as the baseline for generating such lexical-semantic norms may be problematic for cross-dialectal studies. As noted by Buschfield and Weihs (2024), speakers of SgE have been observed to use many non-standard forms, which would have otherwise been perceived as incorrect by Americans or British. Since one’s use of language is grounded in the local cultural context, the existence of only AmE norms runs the risk of serving as an imperfect model for other dialects. One such example is the word frequency norms based on the SUBTLEXUS corpus,h which was constructed from subtitles of American movies and TV series (Brysbaert & New, Reference Brysbaert and New2009). Although Singaporeans are generally becoming more exposed to AmE vocabulary due to increased exposure to American pop culture, it is possible that there are unequal exposure rates, as one would not expect everyone to consume American media to the same extent. There is thus a need to address this lack of psycholinguistic measures for the SgE mental lexicon. Although it was proposed that BrE word norms may be viable replacements (Goh et al., Reference Goh, Yap and Chee2020), these may not be a perfect fit either. Recent research has identified that Singaporean children actually display a hybrid of AmE and BrE phonological features (Gu & Chen, Reference Gu and Chen2020). In addition, as both UK and US spellings of words are generally deemed as “correct” orthographic transcriptions in SgE (Deterding, Reference Deterding2007), it is not likely that AmE or BrE can be a complete or perfect substitute for the absence of SgE speech norms. While it may still be possible to use norms from another dialect (such as AmE) as an initial proxy measure in the absence of local norms, given that they generally correlate strongly (Siew, Reference Siew2025), doing so may mask subtle but potentially interesting and informative cultural differences across dialects. Having noted such concerns, prior to conducting further research to investigate the language processes of Singaporeans, we recommend that psycholinguists should first attempt to develop norms reflective of their local context.
Conclusion
This research demonstrated that network science techniques devised for phonological research across different languages can be extended to comparing dialects. While not all network measures were found to be significant predictors, degree still retained the expected direction of effect for response time. As for the question of whether a localized phonological network is the better model of the lexicon, there were mixed findings. This discrepancy could have been due to considerable exposure of Singaporeans to American media and suggests that such exposure could potentially aid in overcoming difficulties in recognizing words pronounced differently in another dialect. Our findings, hence, demonstrate the capability of network science to capture phonological differences in mental lexicons across dialects and their subsequent utility in modeling how such differences can affect spoken word recognition in a different dialect.
Replication package
Research materials transparency, analytic methods, and data transparency: https://osf.io/7zun8/.
Competing interests
The authors declare no competing interests.
Appendix 1: Target Words Used in Both Studies
Target Words Used in Both Studies Grouped by Condition





 Open access

