


The literature on women in US politics has devoted considerable attention to two questions: Do voters use gender stereotypes in evaluating candidates? And does gender stereotyping affect women's chances of being elected? The answer to the first is “yes”: some voters infer that women candidates are more liberal than men, more compassionate and collaborative, and more competent on certain issues like education (see, for example, Alexander and Andersen Reference Alexander and Andersen1993; Huddy and Terkildsen Reference Huddy and Terkildsen1993a; Kahn Reference Kahn1996), though the prevalence of such stereotyping may be lower today than in the past (Hayes and Lawless Reference Hayes and Lawless2016). On the second question, the literature is not conclusive (see, for example, Bos, Schneider, and Utz Reference Bos, Schneider, Utz, Travis, White, Rutherford, Williams, Cook and Wyche2018; Fox and Oxley Reference Fox and Oxley2003), nor is related research assessing whether differences between men's and women's vote shares reveal gender discrimination (see, for example, Barnes, Branton, and Cassese Reference Barnes, Branton and Cassese2017; Bauer Reference Bauer2020; Burrell Reference Burrell1994; Fulton Reference Fulton2012). Thus, although concern about women's underrepresentation in elective office motivates much of this scholarship, it remains unclear how voters' use of gender stereotypes affects women's ability to win elective office (see Bauer Reference Bauer2015; Teele, Kalla, and Rosenbluth Reference Teele, Kalla and Rosenbluth2018).
One reason the literature has not yet reached firm conclusions on this question is that the electoral effects of gender stereotyping likely vary across contexts (Bos, Schneider, and Utz Reference Bos, Schneider, Utz, Travis, White, Rutherford, Williams, Cook and Wyche2018; Ono and Burden Reference Ono and Burden2019). While there is a vast literature on how candidate gender affects vote choice and election outcomes, most studies focus on a single context at a time (for example, US House elections) and thus do not test whether women candidates' chances of winning are better or worse under different conditions. Moreover, almost all the studies that do evaluate whether voter support for women candidates varies by context rely on surveys and experiments in which respondents report which candidates they would or did vote for. Such studies enable the researcher to measure individuals' gender stereotyping directly, but what respondents say they would do when faced with a (frequently fictional) candidate may not reflect what they actually do in elections (Dolan Reference Dolan2014, 128)—and the latter is the outcome of interest when the question is whether there are electoral effects of gender stereotyping. Critically, nearly all of this research also focuses on national and state general elections, where forces of partisanship are strong, likely muting any effects of gender (Hayes and Lawless Reference Hayes and Lawless2016). For all of these reasons, there is need for more research evaluating the conditions under which gender stereotypes might help or harm women's electoral chances.
In this article, we draw on the existing literature to put forward three hypotheses about how women's win rates should vary by context if stereotyping is at work, and we use data on thousands of US local elections to test those hypotheses. Our dataset features variation in whether the office sought is executive or legislative, the policy domains salient in the elections, and the relative conservatism of the electorate—all dimensions on which the effects of gender stereotyping are expected to vary. It also includes candidates' ballot designations, from which we create measures of candidate experience, and features only nonpartisan races, which are common throughout the United States and reduce the likelihood that party cues will overwhelm gender cues.
In addition to our novel approach to testing these hypotheses, we theorize that variation in local election timing helps us to assess whether the patterns we uncover are consistent with an account based on gender stereotyping. Research shows that individuals are more likely to rely on stereotypes when they have less information about candidates (see, for example, Berinsky et al. Reference Berinsky2020; Matson and Fine Reference Matson and Fine2006; McDermott Reference McDermott1997; McDermott Reference McDermott1998), and also that the average voter in on-cycle local elections—those held concurrently with national elections—has less information about local candidates and issues than the average voter in off-cycle local elections (de Benedictis-Kessner Reference De Benedictis-Kessner2018; Oliver and Ha Reference Oliver and Ha2007). This implies that if any differences we find in men's and women's win rates are attributable to stereotyping, they should be most pronounced in on-cycle elections.
Local elections are therefore analytically useful in a variety of ways, but studying women's success in local elections is also important in its own right (Holman Reference Holman2014). Local governments spend a quarter of all public money in the United States and are major policymakers in areas such as policing, public education, and housing, yet we still know little about whether voters affect women's descriptive representation at the local level. Many politicians also start their careers in local politics, including Vice President Kamala Harris, US Senator Dianne Feinstein, and US Senator Joni Ernst, which means local elections shape the pipeline of women available to run for higher office. For all these reasons, there should be more research on women in local elections.
This article is a step in that direction. Our empirical analysis compares city council, mayoral, and school board races to assess whether women's electoral success varies in ways consistent with the three hypotheses we draw from the literature. We find that, on average, women candidates have an advantage over men in city council elections (city legislatures), but that advantage is reduced—and becomes a disadvantage—for women running for mayor (city executives). Comparing legislatures, we find that women's advantage is greater in school board races (local legislatures where education is the issue at stake) than city council races (local legislatures where issues like crime and economic development are most salient). We find evidence that the size of women's advantage in local legislative races decreases with the Republicanism of the constituency. Finally, we find that these patterns are most pronounced in local elections held concurrently with national races, when average voter knowledge of local candidates and issues is lower. By studying real elections, and local elections in particular, we make progress toward understanding how voters affect the success of women running for public office.
Literature and Expectations: The Electoral Effects of Gender Stereotyping
There is little scholarly dispute over the content of voters' gender stereotypes, even if there are signs that the use of such stereotypes may be declining over time. First, voters often view women candidates as more compassionate and communitarian than men (Brooks Reference Brooks2013; Dolan Reference Dolan2004; Hayes Reference Hayes2011). Second, voters assume women candidates are more competent than men on so-called “women's issues,” such as education and healthcare, and weaker on issues like the economy, policing, and the military (Huddy and Terkildsen Reference Huddy and Terkildsen1993a; Kahn Reference Kahn1996; Lawless Reference Lawless2004; McDermott Reference McDermott1998; Sanbonmatsu Reference Sanbonmatsu2002; Swers Reference Swers2007). Third, voters perceive women candidates as more liberal than men (Alexander and Andersen Reference Alexander and Andersen1993; Koch Reference Koch2000; McDermott Reference McDermott1998; Sanbonmatsu Reference Sanbonmatsu2002; Sanbonmatsu and Dolan Reference Sanbonmatsu and Dolan2009).
While the literature is clear about the content of gender stereotypes, studies of the electoral effects of those stereotypes have produced an array of conclusions (Bos, Schneider, and Utz Reference Bos, Schneider, Utz, Travis, White, Rutherford, Williams, Cook and Wyche2018).Footnote 1 Most examine a single context at a time, and most rely on surveys and experiments—exploring outcomes such as candidate evaluations and vote choices, often in hypothetical races—to study voter attitudes and beliefs. Some survey experiments show that respondents do not rate men and women candidates differently on favorability or likely effectiveness (Brooks Reference Brooks2013). Others show that respondents favor women over men (Fridkin, Kenney, and Woodall Reference Fridkin, Kenney and Woodall2009). Still others find that when gender stereotypes are activated, respondents rate women candidates as less qualified (Bauer Reference Bauer2020). Some use surveys to assess whether individuals' use of gender stereotypes predicts their vote choices and attitudes about women in elective office (Dolan Reference Dolan2010; Dolan Reference Dolan2014). While this is a large literature—which we describe more thoroughly in the Online Appendix—two key features are that: (1) most of the studies focus on a single context, not how the electoral effects of stereotyping might vary across contexts; and (2) the focus is on individual voters, their use of stereotypes, and their reports of how they would or did vote, not directly on how women candidates fared in elections.
A related body of research does examine women candidates' electoral success, analyzing election returns to determine whether voters discriminate against women candidates, but it has also produced mixed conclusions. Most of these studies find that the average vote share of women candidates does not differ from that of men (see, for example, Seltzer, Newman, and Leighton Reference Seltzer, Newman and Leighton1997). This has led some scholars to conclude that voters are not discriminating against women (for example, Darcy, Clark, and Welch Reference Darcy, Clark and Welch1994). Others challenge that conclusion, noting that if the average woman candidate is of higher quality than the average man candidate and receives the same vote share, that suggests the presence of discrimination, not its absence (Anzia and Berry Reference Anzia and Berry2011; Fulton Reference Fulton2012; Fulton and Dhima Reference Fulton and Dhima2020; Pearson and McGhee Reference Pearson and McGhee2013). Women also receive fewer votes than men when they face high-quality challengers (Barnes, Branton, and Cassese Reference Barnes, Branton and Cassese2017), and women incumbents are more likely to face high-quality challengers (Milyo and Schosberg Reference Milyo and Schosberg2000). Thus, research analyzing election returns to test for voter discrimination has generated mixed conclusions as well.
These literatures are distinct in important ways. One distinction is methodological: research on stereotyping mostly relies on surveys and experiments, whereas research on discrimination mostly analyzes election returns data. However, they are also distinct in the phenomena they seek to explain and the hypotheses they test. In assessing whether voters discriminate against women, researchers typically test whether women receive fewer votes than men—a net negative effect. Moreover, the mechanism by which any such women's penalty occurs is often ambiguous: it could be negative effects from gender stereotyping (which presumes that the negative effects of gender stereotypes outweigh any positive ones), or it could be other forms of bias, such as double standards (traits judged negatively when women hold them and positively when men do) or misogyny (outright hostility toward women) (Teele, Kalla, and Rosenbluth Reference Teele, Kalla and Rosenbluth2018, 525). In contrast, research on stereotyping suggests a specific mechanism, but one whose electoral effects could vary, as those stereotypes could work in favor of women in some contexts and against them in others.
Some studies suggest that the electoral effects of gender stereotyping should depend on the context or type of election (Bos, Schneider, and Utz Reference Bos, Schneider, Utz, Travis, White, Rutherford, Williams, Cook and Wyche2018; Lawless Reference Lawless2004), but a limited number have empirically tested for those varying effects. Those that have almost exclusively use surveys and experiments to assess how vote choice depends on the context. One example is Ono and Burden's (Reference Ono and Burden2019) conjoint survey experiment, which finds that voters are less likely to vote for women than men in US presidential races but not in US congressional races.Footnote 2 Another is Kahn (Reference Kahn1996), who finds that survey respondents are more likely to report voting for women US Senate candidates when their campaign coverage features more “feminine” issues and themes. Partisanship and ideology are some of the more common conditioning variables explored: some scholars find that Democratic and liberal respondents are more supportive of women candidates than Republicans and conservatives (Dolan Reference Dolan1998; King and Matland Reference King and Matland2003; McDermott Reference McDermott1998; Ono and Burden Reference Ono and Burden2019), and related research notes that US congressional districts that lean Democratic have been more likely to have women representatives than those that lean Republican (Palmer and Simon Reference Palmer and Simon2008; Pyeatt and Yanus Reference Pyeatt and Yanus2016).Footnote 3
Of the small number of studies that use data on election returns to test for varying electoral effects of gender stereotyping, Fox and Oxley's (Reference Fox and Oxley2003) study stands out as one that compares the win rates of women and men candidates in different contexts. Specifically, they compare the rates at which women and men run for and win state executive offices that are stereotypically “masculine” (for example, comptroller or auditor) versus stereotypically “feminine” (for example, superintendent of education) and find that women are no less likely to win those races when they run—a null result they attribute to the strength of party forces in shaping state general election outcomes. Fulton and Dhima (Reference Fulton and Dhima2020) analyze US House elections and find that women Democratic candidates fare worse in districts with larger shares of Republican and independent men constituents. There is also other work that finds patterns suggestive of varying electoral effects of gender stereotyping: analyzing the proportion of city elected officials who are women, Smith, Reingold, and Owens (Reference Smith, Reingold and Owens2012) find the proportion is larger in more Democratic cities, and Crowder-Meyer, Gadarian, and Trounstine (Reference Crowder-Meyer, Gadarian and Trounstine2015) find it is larger for city clerks than for mayors or city councilmembers.
In sum, there is still relatively little work that empirically examines how the effects of candidate gender on election outcomes vary by context. Studies that do test for such variation mostly use survey and experimental data on individuals, and they also mostly focus on national or state elections, where partisanship and ideology play a large role in shaping vote choice. With all of this in view, it becomes clear that there is still need for more research on how the electoral effects of gender stereotyping might vary by context—particularly empirical research that focuses on how women and men candidates fare in real elections, and particularly research that looks at the many US electoral contexts where partisanship and ideology play a smaller role.
We start in this direction by weaving together what we know about the content of gender stereotypes from the existing literature to set out three general hypotheses. First, we draw on the stereotype that women, as collaborators, are less well suited for executive office than the legislature (see, for example, Huddy and Terkildsen Reference Huddy and Terkildsen1993b; Ono and Burden Reference Ono and Burden2019). If voters use this stereotype, women should fare less well than men in executive races than they do in legislative races, ceteris paribus. Other factors may, of course, contribute to differences in men's and women's actual win rates, such as differences in qualifications (see, for example, Anzia and Berry Reference Anzia and Berry2011; Barnes, Branton, and Cassese Reference Barnes, Branton and Cassese2017; Fulton Reference Fulton2012), so we do not have theoretical expectations about any baseline difference between women's and men's win rates in a single context. Our hypothesis is simply that any women's advantage should decrease (or a disadvantage should increase) when moving from a stereotype-congruent context to a stereotype-incongruent context. Thus, if stereotyping is at work:
Hypothesis 1 (H1): Women will have a larger advantage (or smaller disadvantage) over men in legislative than in executive races.
Our second hypothesis is based on the stereotype that women are more competent than men in policy areas like education and health, and less competent in areas such as crime and the economy (Kahn Reference Kahn1996). Holding constant the type of office (executive versus legislative), if some voters apply these issue-competency stereotypes, then we should expect the effect of gender stereotypes to vary with the policy domains relevant for each office (see, for example, Fox and Oxley Reference Fox and Oxley2003):
Hypothesis 2 (H2): Women will have a larger advantage (or smaller disadvantage) over men in offices where the policy domains correspond to areas of perceived women's competence than in offices where the policy domains do not.
Our third hypothesis is rooted in the stereotype that women candidates are more liberal than men (see, for example, Koch Reference Koch2000; Sanbonmatsu Reference Sanbonmatsu2002). We propose that the effect of gender stereotypes on women's electoral success should depend on whether a given electorate views liberal candidates favorably. This stereotype might therefore present a barrier to Republican women or women running in conservative constituencies (see, for example, Och and Shames, Reference Och and Shames2018; Ono and Burden Reference Ono and Burden2019). Thus, holding the office constant:
Hypothesis 3 (H3): Women will have a larger advantage (or smaller disadvantage) over men in constituencies that are more liberal than in constituencies that are more conservative.
These are just three hypotheses, and more are possible. However, these three flow naturally from the literature, creating a useful structure to study stereotyping's implications for election outcomes. In what follows, we test these hypotheses in an important, yet under-studied, environment—and one that shapes the pipeline from which many national candidates emerge.
Empirical Strategy
To test these expectations, we analyze data on local election returns, which feature a large sample of governments and candidates, as well as rich, measurable variation on all of the relevant dimensions. For instance, while relatively few women have run for president or governor, the United States has over 19,000 municipal governments, roughly a third of which have independently elected mayors, so the local context features much larger numbers of women running for executive office. Also, while the issues salient in congressional and state legislative elections vary widely across districts and election cycles, measuring such variation is difficult (Kahn Reference Kahn1996). At the local level, capturing variation in policy salience is simpler because different types of local governments undertake different functions. For example, boards of school districts make policy on education, whereas the salient issues in cities tend to be economic development, crime, and land use (Oliver, Ha, and Callen Reference Oliver, Ha and Callen2012).Footnote 4 Finally, considerable variation in constituency conservatism allows for tests of whether the gap between women's and men's win rates varies accordingly.
Local government is important to study for other reasons too. Even beyond the important policy decisions local officials make, many women who run for national office get their start in local politics, so examining gender dynamics in local elections helps us better understand the processes that shape the pipeline of women candidates qualified to run for higher office. Moreover, local elections tend to be low-information affairs (Oliver, Ha, and Callen Reference Oliver, Ha and Callen2012), which could make voters more reliant on stereotypes. Also, because over 75 per cent of municipal elections and roughly 90 per cent of school board elections in the United States are formally nonpartisan (Hess Reference Hess2002; Wood Reference Wood2002)—meaning candidates' party affiliations do not appear on the ballot—it is harder for voters to use candidate party as a heuristic. This could mean that voters are especially reliant on gender stereotypes in local elections—and that the hypothesized differences in the electoral effects of gender stereotyping will be especially visible there. Finally, while many scholars have observed that women candidates seem to be more disadvantaged in the Republican Party than in the Democratic Party, it is hard to sort out in the national context whether that is because of differences in the conservatism of their constituencies or something else about the parties, such as gendered recruitment, nomination, or funding strategies (see, for example, Crowder-Meyer and Cooperman Reference Crowder-Meyer and Cooperman2018). By examining nonpartisan local races, we can better isolate the relationship between the conservatism of the constituency and women's electoral fates.
Even with all of these advantages of studying the local context, US local election data are notoriously difficult to collect, which may explain why studies at the local level usually analyze the gender composition of officeholders rather than candidates (see, for example, Smith, Reingold, and Owens Reference Smith, Reingold and Owens2012; Trounstine and Valdini Reference Trounstine and Valdini2008).Footnote 5 For these reasons, we turn to the California Elections Data Archive (CEDA), which has recorded most local elections in California from 1995 onward, including: the number of seats up for election; candidate names; the number of votes each candidate received; whether the candidate won, lost, or advanced to a runoff; and incumbency. We focus on municipal and school board elections from 1995 to 2016: municipalities because they hold elections for both executive (mayor) and legislative (council) offices; and school board elections because—when compared with city council elections—they provide variation in policy salience across legislative races. As is typical in the United States, municipal and school board elections in California are nonpartisan. In addition, as a large, diverse state—the largest by population in the United States, and the fifth largest economy in the world—California has many local governments, varying in size and the partisan leanings of their residents,Footnote 6 making it an excellent state for these local government comparisons.
As the CEDA data do not include an indicator for candidate gender, we use a two-step process to code it (for details, see the Online Appendix): first, with automated prediction in R, which categorized 96 per cent of the candidates; and, second, employing research assistants to categorize an additional 3 per cent. In total, the dataset features 27,137 city council candidates in 6,017 unique city council races, 3,148 mayoral candidates in 1,188 mayoral races, and 29,284 school board candidates in 7,352 school board races.
Finally, our data enable us to construct measures of candidate quality—the commonly omitted variable that has proven to be a flashpoint in the empirical literature on discrimination. Studies suggest that the average quality of women congressional candidates is higher than that of men—and that failing to account for this masks real differences in men's and women's vote shares (see, for example, Fulton Reference Fulton2012). We therefore take advantage of California's election rules that allow candidates to provide a ballot designation indicating their current elective office or occupation; we use that information to create multiple measures of their experience. We also limit our main analysis to nonincumbents: local incumbents have already been in office and are more recognizable to voters, so voters probably rely less heavily on gender stereotypes in evaluating them.Footnote 7 Thus, while we cannot account for every characteristic of the thousands of candidates in our data, we do control for the factor identified as the main culprit behind omitted-variable bias in similar analyses.Footnote 8
Methods
Our main dependent variable is a binary indicator, Win, which equals 1 if the candidate won the election and 0 if the candidate lost.Footnote 9 We begin our analysis by describing the simple bivariate relationships between this win indicator and our main independent variables of interest. To test H1, we compare the difference between women's and men's win rates in mayoral elections to that of city council elections; if women have a smaller advantage (or larger disadvantage) in mayoral races than in city council races, that would be consistent with the expectation that stereotypes benefit women more when they are running for legislative positions than when they are running for executive positions. For H2, we compare the difference between women's and men's win rates in school board elections to that of city council elections, expecting a greater advantage (or smaller disadvantage) for women in school board elections because of the salience of education. To test H3, we evaluate whether women's advantage decreases (or disadvantage increases) as one moves from more liberal to more conservative constituencies. We measure constituency conservatism using the two-party vote for the Republican candidate (Republican presidential vote) in the most temporally proximate presidential election (for example, the 1996 election for 1995 to 1998), centered around its mean, looking at its relationship to women's and men's win rates separately for each office.
We then proceed to multiple regression models that attempt to account for various factors that prior literature has shown to be related to candidate gender and election outcomes. We use ordinary least squares (OLS) rather than logistic regression to estimate the models because it is easier to interpret the interaction effects central to our hypotheses with OLS coefficients; however, the Online Appendix shows that the results hold using logit models. We cluster standard errors by city (for municipal offices) or by county (for school boards) to account for possible heteroskedasticity due to nonindependence of observations from the same geographic area.Footnote 10 To rule out the possibility that some years are more favorable to nonincumbents or women, we include year fixed effects in all models. We estimate models with and without fixed effects for jurisdiction, which, when included, partial out the effects of time-constant jurisdiction characteristics correlated with the types of candidates who run and the probability of winning. In our visuals, all estimates are shown with 95 per cent confidence intervals, and all p-values reported are two-tailed.
Following earlier literature that finds race competitiveness (Barnes, Branton, and Cassese Reference Barnes, Branton and Cassese2017), candidate experience (Fulton and Dhima Reference Fulton and Dhima2020), and district characteristics (Palmer and Simon Reference Palmer and Simon2008) to be important, we include measures of these in our models. For competitiveness, we include the number of candidates in the race divided by the number of seats up for election (Candidates per seat) and the number of incumbents per seat (Incumbents per seat). We use information in the candidates' ballot designations to create a series of experience indicators that we include in the models: whether the candidate lists experience as mayor or vice-mayor, city council member, school board member, or some other government leadership position like planning commissioner.Footnote 11 We also include indicators for whether the candidate lists a background in business, law, education, or activism (Lawless and Fox Reference Lawless and Fox2005). As elections in small municipalities are different than elections in larger cities (Oliver, Ha, and Callen Reference Oliver, Ha and Callen2012), we include log city population, drawing place-level data from the 1990, 2000, and 2010 US censuses, and interpolating within cities over time.
Alternative Explanations and Election Timing
Although our dataset provides a large sample and addresses the challenge of party cues, there remains the problem that we cannot measure gender stereotyping directly. Therefore, even if the patterns we find are consistent with our hypotheses, we cannot definitively rule out the possibility that any patterns we find are explained by something other than gender stereotyping. To try to address this, in our analysis, we consider two plausible alternative explanations and propose a new means by which to assess whether stereotyping plays a role.
First, we consider whether any differences in women's and men's win rates might be driven by affective biases (such as hostile sexism or misogyny) that create negative attitudes toward women candidates generally (Teele, Kalla, and Rosenbluth Reference Teele, Kalla and Rosenbluth2018). These biases would produce a relatively consistent penalty for women candidates across office types and jurisdictions, not the varying effects we hypothesize. Second, candidates might strategically enter races depending on how they expect to perform (including because of bias they expect to encounter), and that could produce pools of men and women candidates that differ in key respects—and that differ in varying ways depending on office type or constituency conservatism. In the Online Appendix, we explore this through descriptive analyses of how the prevalence of women candidates varies by office type and constituency conservatism—thus assessing patterns of candidate entry. The findings suggest that strategic candidate entry is likely to work against our ability to detect effects of stereotyping.
Finally, we theorize that variation in the timing of local elections allows us to test whether the patterns are most pronounced in elections where gender stereotyping by voters is likely to be most widespread. Turnout in local elections varies dramatically by when the election is held: in city elections held concurrently with presidential elections, turnout averages 35 percentage points higher than in local elections held off-cycle; and in city elections held concurrently with midterm and gubernatorial elections, it averages 18 percentage points higher (Anzia Reference Anzia2014; Hajnal, Lewis, and Louch Reference Hajnal, Lewis and Louch2002). Oliver and Ha (Reference Oliver and Ha2007) show that the average voter knows more about local candidates and issues in off-cycle elections than in on-cycle elections. Unsurprisingly, when local elections are held on the same day as national elections, many people only vote in local races because they are already at the polling place to vote in national races. In off-cycle local elections, by contrast, most of the people who participate do so because local races interest them. It makes sense, then, that the typical on-cycle voter has less information about local candidates and issues than the highly interested voters in off-cycle elections (de Benedictis-Kessner Reference De Benedictis-Kessner2018).
Research also shows that when voters know a great deal about the candidates, they are less likely to rely on heuristics generally (Popkin Reference Popkin1991), and gender stereotypes in particular (Bauer Reference Bauer2015; McDermott Reference McDermott1997; McDermott Reference McDermott1998). Combining these two sets of empirical findings—about stereotype use and about election timing—we expect that local elections held concurrently with presidential elections feature the highest proportion of voters reliant on stereotypes, a lower proportion in local elections held concurrently with midterms, and a still-lower proportion in off-cycle elections. If any relationships we find reflect gender stereotyping, they should be most pronounced in elections concurrent with presidential elections and smallest during off-cycle elections. We test for this by examining whether the gaps we find between women's and men's win rates vary with the timing of the election.
Results
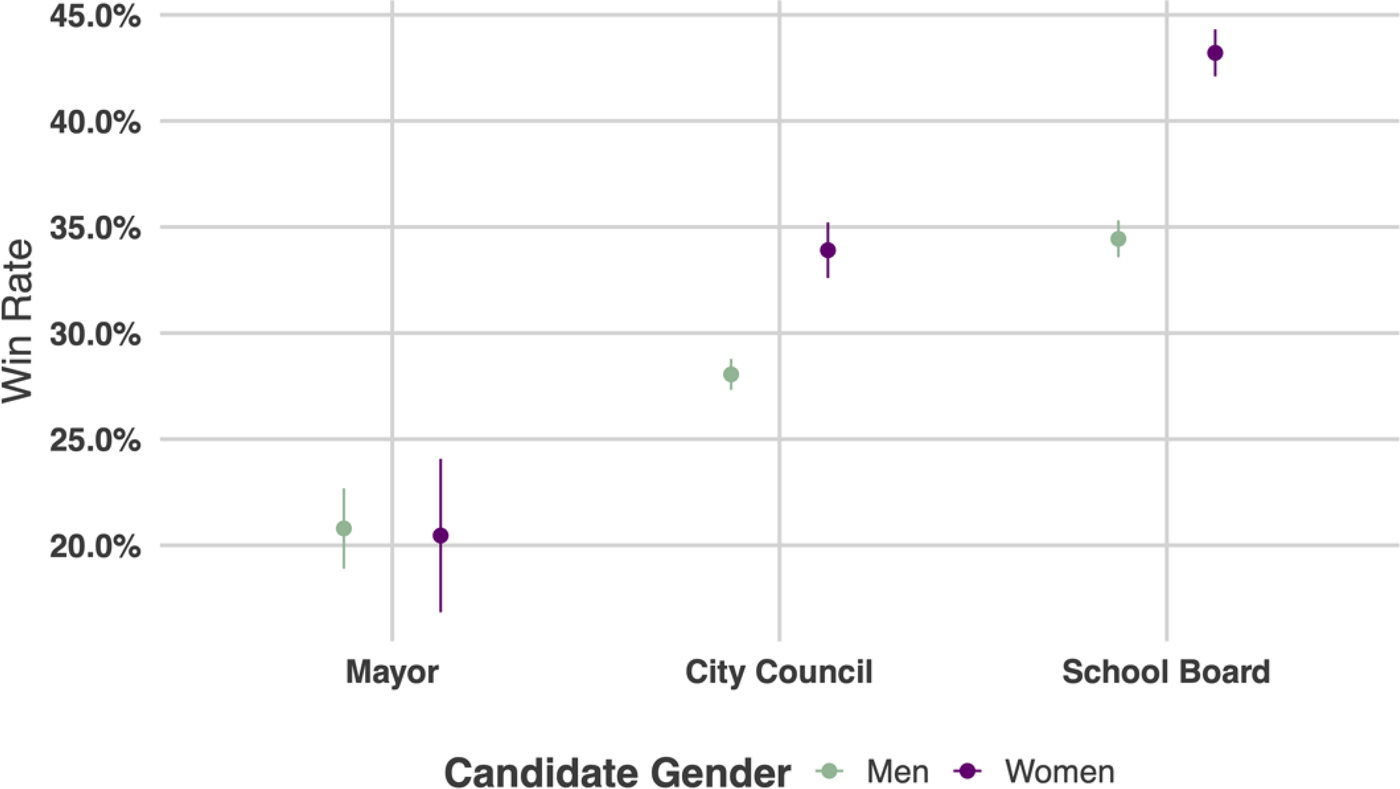
As a descriptive starting point, in Figure 1, we calculate averages of Win by gender and compare them across office types. In city council races, 34 per cent of the nonincumbent women win their races, whereas only 28 per cent of the men do—a gap of 6 percentage points in favor of women. In mayoral contests, there is no difference in the win rates of men and women: both win 20–21 per cent of the time. School board races have a large difference in win rates, with women winning 43 per cent of the time and men only 34 per cent (a difference of 9 percentage points). Simple averages, then, support H1 and H2.
Mean win rates by candidate gender and office.
Notes: Nonincumbents only. Shown with 95 per cent confidence intervals.
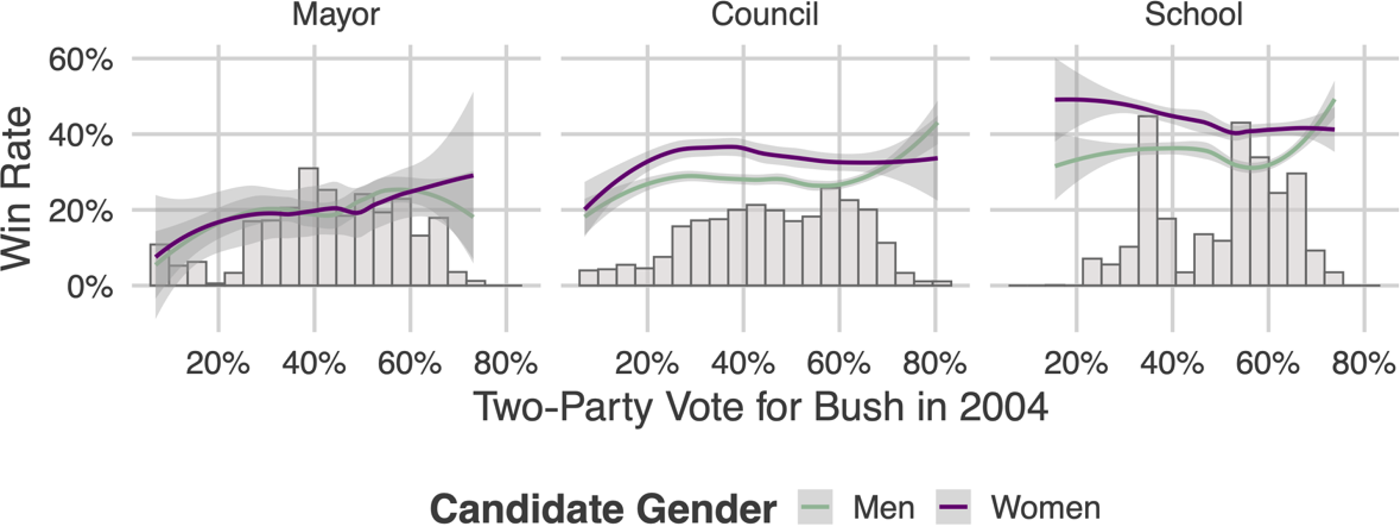
As an initial assessment of H3, in Figure 2, we present LOWESS (Locally Weighted Scatterplot Smoothing) plots of Win against the 2004 two-party vote for George W. Bush, both separately for men and women and for each of the three office types. In each plot, histograms show the distribution of presidential vote for the jurisdictions these candidates ran in, underscoring the substantial variation in local party alignments across these Californian cities and counties that election year. For city council candidates, the pattern is supportive of H3 except for the most liberal cities. Most city council candidates are from cities with between 25 and 70 per cent vote share for Bush in 2004, and for cities in that range, the gap between the lines narrows—thus women's advantage decreases as cities become more Republican. There is no such pattern for mayoral candidates. For school board candidates, counties with the lowest Bush vote share have the highest women's advantage, and the gap narrows for more Republican counties.
Win rates for men and women by constituency conservatism.
Notes: Nonincumbents only. Shown with 95 per cent confidence intervals.
These bivariate relationships only tell us so much, however, because many characteristics of races and candidates that affect win rates are correlated with candidate gender, such as candidate experience. Notably, in some mayoral races, there were women candidates who had more experience than men candidates—which we would expect to be associated with higher win rates—but the women lost. For example, in Antioch, California, in 2016, the top three mayoral candidates varied considerably in their city government experience: Wade Harper, a man, was the incumbent mayor; Lori Orgocheck, a woman, was serving as mayor pro tem; and Sean Wright, a man, was a local business owner and local chamber of commerce chief executive officer (CEO), with no experience in city elective office. Yet, Wright won the election and Orgocheck came in third place—despite the experience differential (The Press 2016). In Milpitas that same year, two women city councilmembers ran for mayor—Debbie Indihar Giordano and Vice Mayor Carmen Montano—and both were defeated by Richard Tran, a man who had not held any prior elected office (Mohammed Reference Mohammed2016). As a next step, then, we evaluate the hypotheses with linear probability models that include variables that capture these dynamics.
To test H1, we regress the dependent variable, Win, for all nonincumbent city council and mayoral candidates on our indicator for whether the candidate is a woman (Woman),Footnote 12 an indicator for whether the race is a mayoral race (Mayor), and the interaction between the two. The coefficient on Woman represents the average difference between women's and men's win rates in city council races, and the test of H1 is whether the coefficient on Woman × Mayor is negative—which would imply that the gap between women's and men's win rates is smaller in mayoral races than in city council races.
Column 1 of Table 1 presents the estimates of the model without city fixed effects. The coefficient on Woman is positive, indicating that women nonincumbents running for city council are 3.7 percentage points more likely to win than men. Consistent with H1, the coefficient on Woman × Mayor is negative, indicating that women's advantage is significantly lower in mayoral races than city council races. When we combine the coefficients on Woman and Woman × Mayor to estimate the gap between women's and men's win rates in mayoral elections, as we do in Figure 3, we see that the average woman is at a significant disadvantage in mayoral races: women's win rates are 8 percentage points lower than men's. As we show in the Online Appendix, women running for mayor are more likely than men to have city council experience. Thus, while the raw averages (see Figure 1) show little difference between men's and women's win rates in mayoral races, comparing men and women with similar experience points to women's disadvantage.
Win rates by gender, office, and policy domain
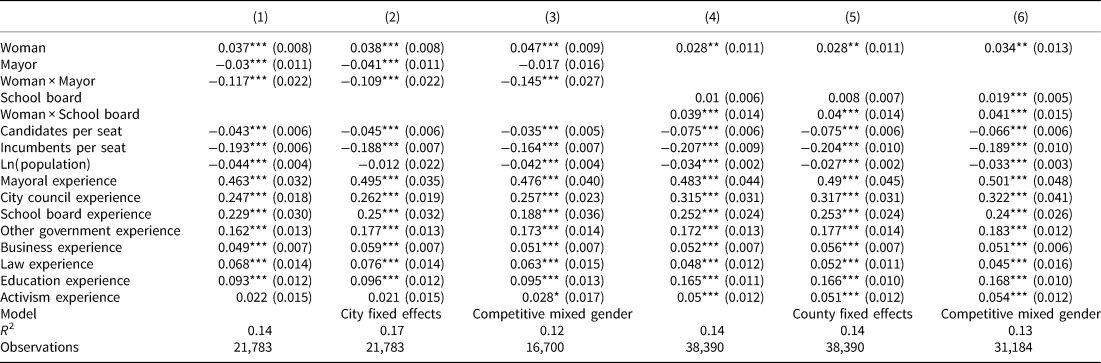
Notes: Standard errors clustered by city in columns 1–3 and county in columns 4–6 in parentheses. All p-values are two-tailed. * p < 0.10; ** p < 0.05; *** p < 0.01.
Women's advantage or disadvantage by office.

One concern is that these estimates could simply reflect differences between cities with and without independently elected mayors; perhaps the former just happen to be places where women candidates fare less well. However, in column 2, where we add city fixed effects to focus on within-city variation in how women fare compared to men in mayoral versus city council races, the estimates are nearly identical. Women have an average advantage of 3.8 percentage points in city council races, but that advantage declines by 11 percentage points in mayoral elections—turning into an overall women's disadvantage, as we show in Figure 3. Thus, there is a clear difference in how women fare within the same city when running for executive rather than legislative office.Footnote 13
In column 3, we estimate the same model as in column 1 but limit the sample to mixed-gender races that have more candidates running than seats. This allows us to focus on races in which voters can plausibly use candidate gender as a cue but reduces the sample size. Our main estimates change little. We estimate a significant women's advantage in city council races of 4.7 percentage points, and that advantage decreases by 14.5 percentage points in mayoral races. This suggests an overall 10 percentage-point disadvantage for women running for mayor, as depicted in Figure 3. To provide some context for the size of these estimates, we note that in making a similar comparison with a conjoint survey experiment focused on national politics, Ono and Burden (Reference Ono and Burden2019) find that respondents were no less likely to vote for a woman than a man in congressional elections but were 2.4 percentage points less likely to vote for women in presidential elections (a statistically significant difference).
Next, we turn to H2. We examine nonincumbent city council and school board candidates, replacing Mayor with an indicator for School board and clustering standard errors by county. In column 4 of Table 1, we again estimate a positive, significant coefficient on Woman, and the test of H2—the coefficient on Woman × School board—is also positive, as expected. Women get an additional boost of 3.9 percentage points in school board races compared to city council races. In Figure 3, we show that women are 6.7 percentage points more likely to win school board races than men. These results are consistent with our expectation that women's advantage in legislative races is larger when the salient issue is stereotype congruent (education), and they are different than those of Fox and Oxley (Reference Fox and Oxley2003), who found no such differences when looking at partisan state executive elections.
Comparing men and women within the same jurisdiction is more complicated for H2 because most Californian school districts are not coterminous with cities. In column 5, we add fixed effects for cities' and school districts' shared parent counties, and the main estimates are nearly identical to those of column 4. Moreover, when we limit the estimation to a small set of school districts that are coterminous with cities and include fixed effects for those jurisdictions, the coefficient on the interaction of Woman and School board remains positive and statistically significant (see the Online Appendix). The same holds in column 6, where we examine competitive, mixed-gender races. In all models, we find that the gap in average win rates between women and men is significantly larger in school board races than city council races.
For H3, we interact Woman with the mean-centered two-party vote for the Republican candidate in the most temporally proximate presidential election. Column 1 of Table 2 presents the estimates for city council. (To conserve space, we show only the main coefficient estimates in Table 2, but these models include all of the controls from Table 1.) The coefficient on Woman indicates that in cities of average Republicanism, women are 3.3 percentage points more likely to win than men. The test of H3—the coefficient on Woman × Republican presidential vote—is in the expected direction: women's advantage shrinks as one moves to more conservative cities. However, that coefficient is shy of statistical significance (p = 0.138 in a two-tailed test). When we turn to mayoral races in column 2, we do not find support for H3: the disadvantage for women in mayoral races does not vary with the conservatism of the city. In column 3, we find evidence that the women's school board advantage is smaller in more conservative counties. In a county of average Republicanism, women school board candidates have a 6.3 percentage-point advantage over men, but that advantage shrinks 1.8 percentage points for every 10 percentage-point increase in Republican presidential vote share. Thus, evidence for H3 is mixed: for school board and city council, women's advantage appears to be smaller in more conservative places, but not so for mayor. While survey-based studies have shown some evidence that Republican respondents are less likely to vote for women than Democratic respondents (see, for example, Dolan Reference Dolan1998; King and Matland Reference King and Matland2003), these findings suggest that women candidates fare less well in more conservative jurisdictions even in nonpartisan elections.
Win rates by constituency conservatism
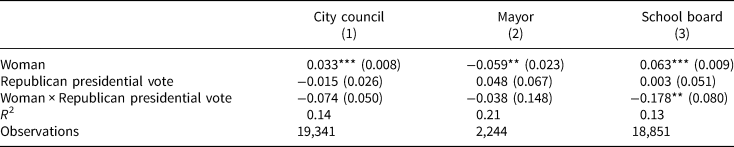
Notes: Standard errors clustered by city in columns 1–2 and county in column 3 in parentheses. All p-values are two-tailed. * p < 0.10, ** p < 0.05, *** p < 0.01. Models include year fixed effects and all controls from Table 1; the full regression with coefficients presented for the covariates can be found in the Online Appendix.
Evaluating Explanations
The weight of our evidence is thus consistent with the hypotheses about the effects of gender stereotyping. Still, as we discussed earlier, one might wonder whether gender stereotyping is the mechanism. Could it be, for example, that some form of gender bias other than stereotyping—such as hostile sexism—is at work? If true, we would expect to find a similar (negative) effect of Woman for all of the offices; we know of no theoretical account besides stereotyping that predicts voters would reward women running for city council but punish women running for mayor within the same city. Yet, we do not find evidence of a consistent penalty for women, either by office or by jurisdiction. Alternatively, one could argue that there might be some unobserved difference between women and men candidates that happens to make the women much more successful than the men in school board races, somewhat more successful in city council races, and less successful in mayoral races. We cannot rule this out, but the existing literature points to candidate quality as the most important variable to consider, and in our analysis, we have developed and incorporated multiple measures of candidate experience. Even with these controls, the patterns of women's and men's win rates are consistent with the empirical implications of existing arguments about stereotyping.
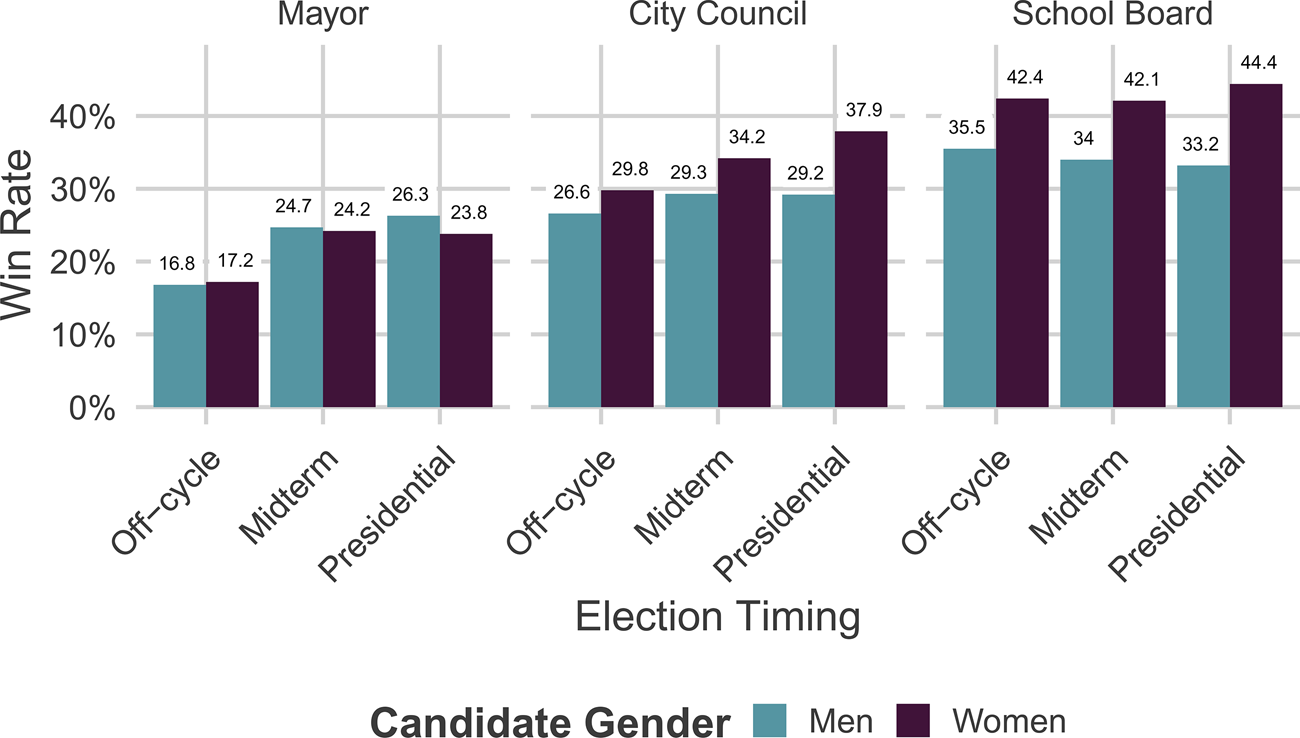
Is there other evidence suggesting stereotyping is the mechanism? To answer this, we investigate one final empirical implication of our theory: if the results so far reflect gender stereotyping, they should be most pronounced in on-cycle elections, where gender stereotyping is likely to be more widespread. We begin by calculating average win rates for women and men and the difference between the two for each of the three office types during presidential elections, midterm elections, and off-cycle elections (see Figure 4).Footnote 14 The patterns are consistent with our expectations. For mayoral elections, women's disadvantage becomes slightly larger in higher-turnout contexts: it is close to 0 in off-cycle elections and drops nearly 3 percentage points in elections concurrent with presidential races. Women's advantage in city council elections is 3.2 percentage points in off-cycle elections, 4.9 percentage points in midterms, and 8.7 percentage points in presidential elections. For school board elections, women's advantage starts at 7 percentage points in off-cycle elections, increases to 8.1 percentage points in midterms, and grows to 11.2 percentage points during presidential elections.
Average win rates by gender and election timing.
In Table 3, we return to the linear probability models and interact Woman with On-cycle—a variable that equals 1 if the local election is concurrent with a presidential election, 0.5 if concurrent with a midterm, and 0 if off-cycle. The estimates for city council candidates are shown in column 1. The coefficient on Woman is statistically indistinguishable from 0: in off-cycle elections, there is no clear difference between men's and women's probability of winning. At the bottom of column 1, we show the combination of the coefficients on Woman and Woman × On-cycle, which represents the difference in women's and men's win rates in city council elections concurrent with presidential elections. That combined coefficient is 0.057 and statistically significant: women's advantage in city council elections is only present in the lower-information context.
Win rates by gender and election timing

Notes: Standard errors clustered by city in columns 1, 2, and 4, and by county in columns 3 and 5. All p-values are two-tailed. * p < 0.10; ** p < 0.05; *** p < 0.01. All models include year fixed effects and the controls shown in Table 1; the full results are in the Online Appendix.
If we were to find that women also fare relatively better in on-cycle mayoral races, we might think that on-cycle elections are just friendlier to women candidates generally. However, in column 2, where we estimate the model for mayoral candidates, we find the opposite. While the coefficient on Woman is statistically insignificant, the combined coefficient on Woman and Woman × On-cycle at the bottom of column 2 is negative and significant, showing that women mayoral candidates in on-cycle elections are 6.5 percentage points less likely to win than men.
In school board races, shown in column 3, we find that women have a significantly higher chance of winning than men even in off-cycle races (4.8 percentage points). Moreover, the results suggest that the advantage may grow in elections concurrent with presidential races. The coefficient on the interaction of Woman and On-cycle is not statistically significant, but it is positive; the combined coefficient at the bottom of the table suggests a 7.9 percentage-point advantage for women in on-cycle school board races.
We also found earlier that women's advantages in city council and school board races decrease with the Republicanism of the local constituency. (In columns 1 and 3 of Table 2, the coefficient on Woman × Republican presidential vote was negative.) To test whether that negative relationship is more pronounced in on-cycle elections than in off-cycle elections, we interact Woman × Republican presidential vote with On-cycle—a triple interaction—and include all component interactions. Continuing with the same theoretical logic presented earlier, if the decrease in women's advantage in more Republican constituencies is due to stereotyping, then the slope of Woman × Republican presidential vote should be steeper—more negative—in on-cycle elections.
For city council candidates, presented in column 4, our estimates show that the negative relationship between Republicanism and the size of women's advantage is only significant in on-cycle races. In off-cycle races, not only is there no women's advantage in cities of average Republicanism, as shown by the coefficient on Woman, but there is also no gap between men's and women's win rates in more liberal compared to more conservative cities (the coefficient on Women × Republican presidential vote is insignificant). The pattern is different in on-cycle elections. First, there is a significant women's advantage in cities of average Republicanism, as shown by the combination of coefficients on Woman and Woman × On-cycle at the bottom of column 4. Second, that advantage decreases significantly in more conservative cities. At the bottom of column 4, we combine the coefficients on Woman × Republican presidential vote and the triple interaction term; the result is negative and statistically significant. For city council races, then, the results are consistent with the account that gender stereotyping underlies the relationship: women's advantage decreases significantly with Republicanism in on-cycle elections but not in off-cycle elections.Footnote 15 This is important because it suggests that even in elections where voters do not possess party cues, voters might infer that women are liberal, hurting women candidates in conservative places.
We do not see the same pattern in school board races. In school districts in counties with an average Republican presidential vote, women do have a significantly larger advantage in on-cycle races than off-cycle races. We also continue to find that women's advantage decreases in more conservative counties, even in off-cycle elections: the coefficient on Woman × Republican presidential vote is negative and statistically significant. However, we do not find that the negative relationship is most pronounced in on-cycle elections. We cannot say why this is so, but this could suggest that the decreasing advantage for women school board candidates in more conservative counties is caused by something other than a changing effect of gender stereotyping. While this last result does not align with expectations, the more general finding for school board candidates is worth underscoring for its implications for descriptive representation: women have an overall advantage in school board races that shrinks as counties become more Republican.
Conclusion
The literature on women in politics shows that many voters use gender stereotypes when evaluating candidates, but in studying how gender stereotyping affects elections, research has focused almost exclusively on national and state elections, where partisanship provides powerful cues about the candidates. Moreover, there are relatively few studies that have tested for gender stereotyping's varying effects, and most of those have done so with data on individuals from surveys and experiments.
Studying local elections in the United States advances this literature because it allows for evaluation of how gender stereotyping effects vary along important contextual dimensions, including the three we have focused on here. These elections afford us rich variation in the contextual factors expected to matter, as well as information on candidates' experience. Moreover, most local elections in the United States are nonpartisan, as are all of the elections we examine; this allows us to assess the effects of gender stereotyping when party cues are weak. Finally, local elections vary in election timing, giving rise to variation in the amount of voter information about local candidates and issues, which is useful given that stereotyping is more common in lower-information environments.
Even beyond these analytical advantages, local governments are important to study as significant centers of policymaking. In addition, as they are mostly nonpartisan, lower-information affairs, they may well be an environment in which gender stereotyping by voters continues to flourish. Moreover, because local elections serve as a launching pad for many women and men who later run for higher office, gender stereotypes may shape state and national elections through selection effects that shape the pipeline of candidates available.
We drew from the existing literature to formulate three hypotheses about how the effects of gender stereotyping should vary depending on whether the office is executive or legislative, the salient issues, and the conservatism of the constituency. Rather than rely on surveys or experiments, which raise questions about whether respondents' answers reflect how they actually vote, we used data on the outcomes of local elections, which are better at capturing the outcome of interest in this case: the electoral fates of men and women candidates. To do this, we theorized a new way of evaluating whether stereotypes might be at work in elections by studying variation in election timing; if we saw these patterns most clearly in on-cycle elections and least in off-cycle elections, this might show us that the average voter's low information about candidates—and subsequent stereotyping—was responsible.
Our analysis demonstrates the promise of our approach and suggests how gender stereotyping by voters might affect women's descriptive representation in local government. Relative to men, women fare better in stereotype-congruent contexts than they do in stereotype-incongruent contexts: women win more than men in local legislative races but not in local executive races; and within legislative races, women win more often when the salient policy issue is education rather than economic development or crime. Consistent with an account based on stereotyping, these effects are largest in elections when voters tend to know less about local candidates. We also find that the advantages for women in legislative elections are smaller in more conservative constituencies, but more work needs to be done to assess whether gender stereotypes are the main driver of this effect. Researchers should also work to assess whether these patterns hold in states other than California—especially more conservative, Republican states—and in more recent years. Finally, we saw that the penalties for women mayoral candidates, and rewards for women council candidates, were largest in on-cycle elections.
Importantly, some of our findings align with those of a recent experimental study examining US national politics: Ono and Burden (Reference Ono and Burden2019) find that voters are less supportive of hypothetical presidential candidates when they are women but are equally supportive of either gender for Congress. Moreover, they find that in the absence of party cues—similar to the nonpartisan races we examine—Republican respondents are less supportive of women candidates than men, but the same is not true of Democratic respondents. We study real election outcomes in the very different local context but find similar patterns. Still, our findings differ from Fox and Oxley's (Reference Fox and Oxley2003) study of election outcomes in state partisan races: while they find no difference in men's and women's win rates for stereotypically “masculine” and “feminine” state executive offices, we find—in nonpartisan local races—that women's advantage is greater when the salient issues for the office are perceived areas of women's competence. While our study cannot speak to such issues directly, it could be that the patterns we have uncovered here are similar to some of the electoral dynamics women face when running for state and national office, particularly in environments where party cues are weak or absent, such as in primaries. Finally, we hope future research might employ election timing as a way of studying stereotyping on other characteristics like race and ethnicity.
Most simply, however, our study underscores the importance of research that evaluates how the effects of gender stereotyping on election outcomes vary by context. We began with a simple question—whether gender stereotyping by voters affects women's chances of getting elected. Our analysis provides evidence that in some contexts, gender stereotyping by voters will benefit women; in others, it will work against them; and the magnitude of those effects will vary. Going forward, scholars should continue to explore that variation, including in local governments. The result will be a better understanding of how voters contribute to women's representation in elective office throughout US politics.
Supplementary Material
Online Appendix is available at: https://doi.org/10.1017/S0007123421000570.
Data Availability Statement
The data, replication instructions, and code can be found in Harvard Dataverse at: https://doi.org/10.7910/DVN/4V2ZII.
Acknowledgments
We gratefully acknowledge feedback from participants and discussants at the Berkeley Political Behavior Workshop, the Nuffield Politics Seminar, the Stanford American Politics Workshop, and the 2018 Annual Meeting of the Midwest Political Science Association. We are especially grateful to Ben Ansell, Amber Boydstun, Justin de Benedictis-Kessner, Rose de Geus, Andy Eggers, Christian Fong, Ben Highton, Mirya Holman, Josh Kalla, Gabe Lenz, Andra Pascu-Lindner, Solé Prillaman, Connie Schibber, and Elizabeth Schmitt for detailed comments, and Jesse Luís Lopez, Lain Mastey, Sita McGuire, Sophie Morris, and Davina Srioudom for research assistance.
Author Contributions
Both authors contributed equally to the research design, data collection, analysis, visualization, writing, and revision of the article.
Financial Support
None.
Competing Interests
None.
Ethical Standards
This research was exempt from human subjects review, as it exclusively relied upon publicly available data and records.


 Open access