


1. Introduction
Ice masses in the Canadian Arctic have become a significant contributor to sea-level rise in the past decade (Reference GardnerGardner and others, 2011; Reference Sharp, Burgess, Cogley, Ecclestone, Labine and WolkenSharp and others, 2011). While increasingly negative surface mass balance has had the biggest impact on recent rates of glacier mass loss, high uncertainty remains concerning the present and future contribution to sea-level rise posed by changing ice dynamics.
Mass-balance studies on Devon Ice Cap, Canadian Arctic, indicate negative mass balance over the past ~50years (Reference Burgess and SharpBurgess and Sharp, 2004, 2008; Reference KoernerKoerner, 2005; Reference Mair, Burgess and SharpMair and others, 2005), with very negative balances since 2005 (Reference Sharp, Burgess, Cogley, Ecclestone, Labine and WolkenSharp and others, 2011). Summers became warmer over the period 1960-2003, especially after 1987 (Reference Gardner and SharpGardner and Sharp, 2007), and the depth of meltwater percolation in the accumulation zones of glaciers and ice caps in the Queen Elizabeth Islands increased (Reference KoernerKoerner, 2005;Reference FisherFisher and others, 2012). As early as 1961, Reference Cress and WynessCress and Wyness (1961) observed a connection between surface melt rates and ice motion on Sverdrup Glacier, where repeated stake surveys showed an approximate doubling of surface velocities at the onset of the melt season. Reference Muller and IkenMuller and Iken (1973) made similar observations on White Glacier, Axel Heiberg Island. More recent studies on John Evans Glacier (a polythermal glacier) on eastern Ellesmere Island indicate an increase in summer surface ice velocities linked to the rapid drainage of supraglacial meltwater to the glacier bed (Reference Bingham, Nienow and SharpBingham and others, 2003; Reference Copland, Sharp, Nienow and BinghamCopland and others, 2003a).
An important question, therefore, is whether increasingly negative surface mass balances on Devon Ice Cap are contributing more water for basal lubrication and whether this is resulting in increased glacier motion. Thus, the aims of this study are to: (1) produce an updated velocity map of Devon Ice Cap; (2) determine whether changes in the velocity structure of the ice cap have occurred over the last ~15years;and (3) provide new ice-flux estimates for the major outlet glaciers of Devon Ice Cap. This study is part of the Canadian contribution to the International Polar Year (IPY) GLACIODYN project, and results will be used as inputs for refined dynamic and hydrological models for the ice cap.
2. Study Site
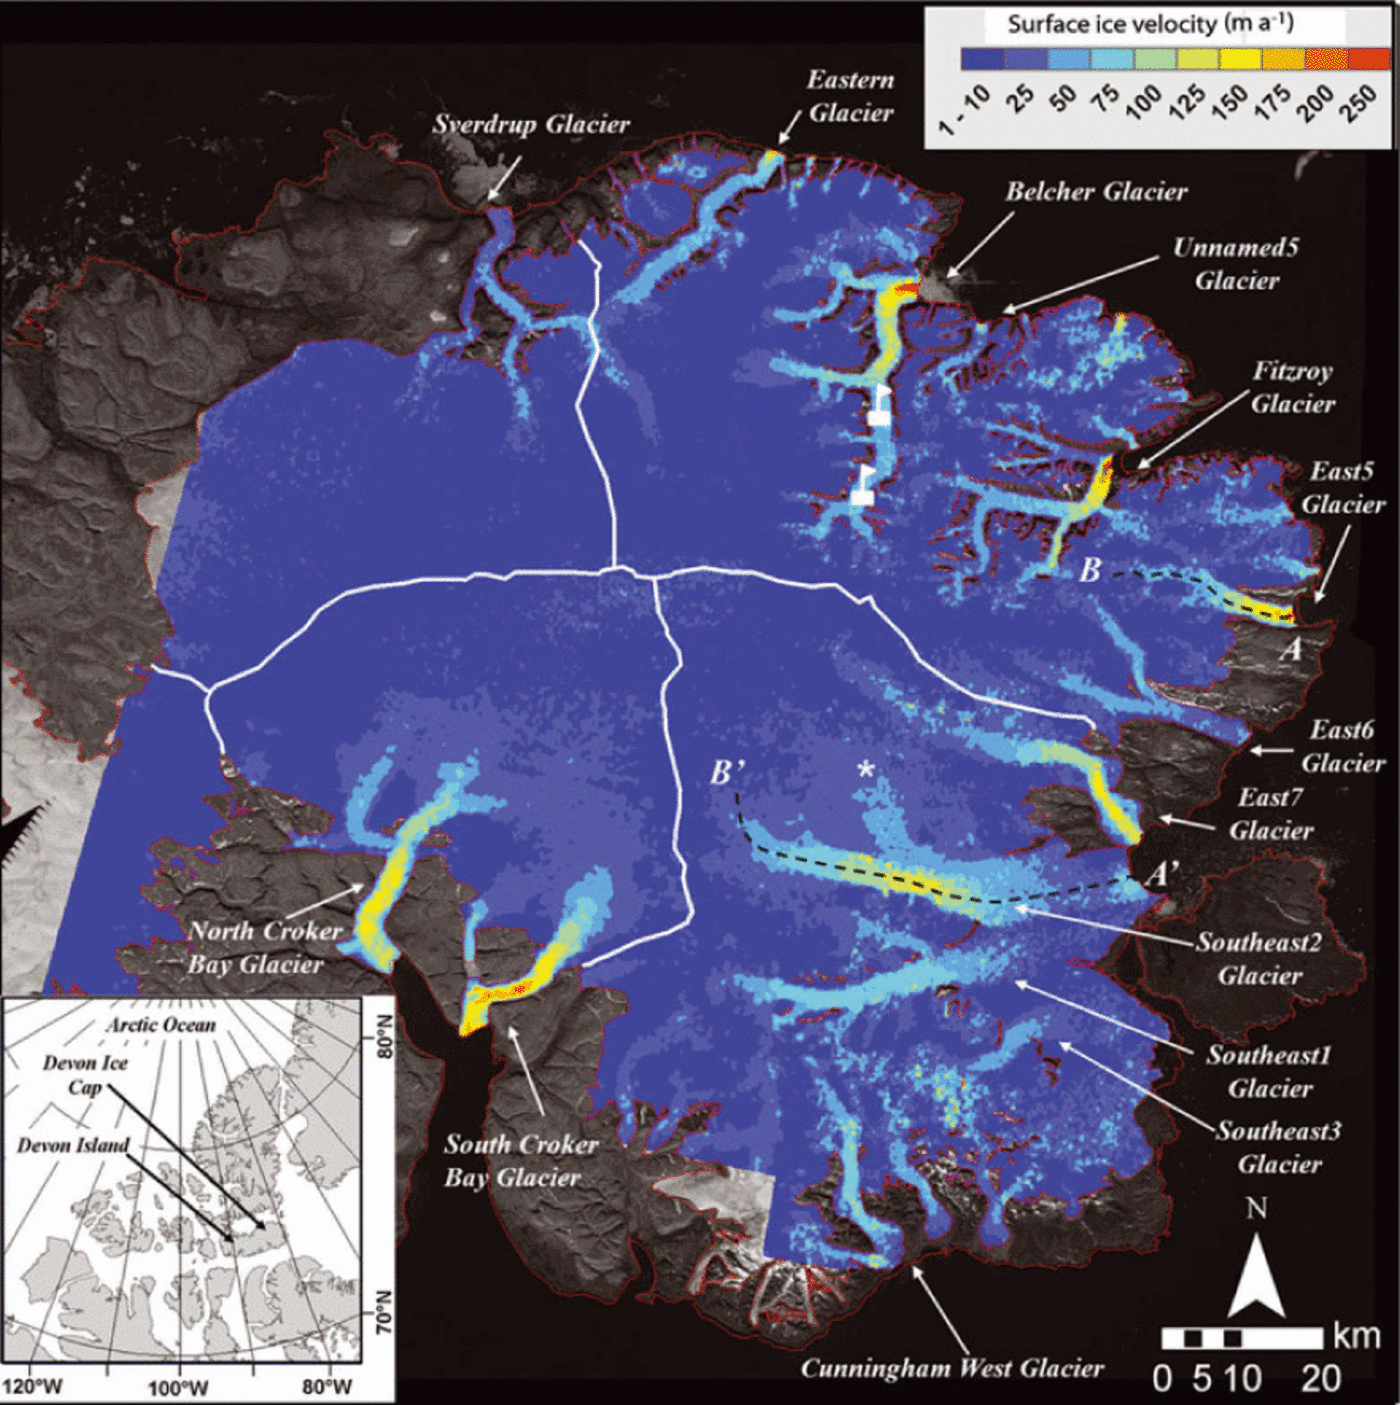
Devon Ice Cap is located on the eastern portion of Devon Island, Nunavut, Canada (Fig. 1 inset). The ice cap has an area of 14400km2 and an estimated volume of 4110 ± 140 km3 (Reference Burgess and SharpBurgess and Sharp, 2004). Bed topography varies between the eastern and western regions of the ice cap. Typically the west is underlain by a flat plateau-like topography while in the east the bed is deeply dissected by steep-sided subglacial troughs (Reference Dowdeswell, Benham, Gorman, Burgess and SharpDowdeswell and others, 2004). Ice thickness is ~400-700m beneath the summit region of the ice cap but can reach as much as 880 m beneath the large outlet glaciers (Belcher, North and South Croker Bay, Southeast2 and Eastern glaciers) that are the major channels for ice drainage. Most of these outlet glaciers are grounded well below sea level, with Belcher, North and South Croker Bay, Southeast1 and Southeast2 glaciers all having bed elevations as much as 400 m below current sea level (Reference Dowdeswell, Benham, Gorman, Burgess and SharpDowdeswell and others, 2004). About 8% of the area of the ice-cap bed lies below contemporary sea level.
Devon Ice Cap velocity structure derived from speckle tracking of RADARSAT-2 fine-beam imagery (1–25 March, 2–26 March and 5–29 March 2009) overlaid on a Landsat-7 image mosaic from 29 July and 2 August 2000. Velocity results over non-glaciated regions are
masked out. White lines indicate primary ice divides, white flags indicate locations of differential GPS stations, white asterisk indicates northern extension of Southeast2 Glacier and dashed lines indicate extracted velocities along East5 and Southeast2 Glaciers presented in Figure 3.
Ablation on Devon Ice Cap is largely related to two factors: ice-cap elevation relative to sea level (higher melt at lower elevations) and proximity to Baffin Bay (higher melt closer to Baffin Bay) (Reference Wang, Sharp, Rivard, Marshall and BurgessWang and others, 2005). The mean elevation of the western portion of the ice cap is generally higher than that of the eastern portion and is further from Baffin Bay, so it experiences lower rates of accumulation (~0.1 mw.e. a-1 in the northwest compared with ~0.5m w.e. a-1 in the southeast; Reference KoernerKoerner, 1970). East/west differences in the flow regime of the ice cap are linked to regional differences in bed topography, ice temperature and rates of mass turnover.
Ice velocities on Devon Ice Cap have previously been determined by Reference Burgess, Sharp, Mair, Dowdeswell and BenhamBurgess and others (2005) and Reference Shepherd, Du, Benham, Dowdeswell and MorrisShepherd and others (2007) using remote-sensing methods. Both studies were based on interferometric analysis of European Remote- sensing Satellite 1 and 2 (ERS-1 and -2) scenes acquired in the mid-1990s, although Reference Burgess, Sharp, Mair, Dowdeswell and BenhamBurgess and others (2005) also applied speckle-tracking methods to RADARSAT-1 imagery from October/December 2000 to derive velocity maps of Belcher Glacier terminus region. This allowed estimation of ice fluxes from all outlet glaciers of Devon Ice Cap and provides a baseline for detection of changes in glacier flow over the last ~15 years.
3. Methods
3.1. Speckle tracking
This study applies a MATLAB speckle-tracking script (based on that used by Reference Short and GrayShort and Gray (2005), but modified to process RADARSAT-2 data) to determine the surface velocity structure of Devon Ice Cap. This script utilizes a two-dimensional cross-correlation algorithm to analyze the relative movement from accurately co-registered pairs of RADARSAT-2 imagery. Good coherence is required between image pairs for the method to work well. March acquisitions were chosen because surface properties of the ice cap remain fairly constant at this time of year (i.e. little snowfall or melt; Table 1). Displacements were determined in both the azimuth and range directions using image chip sizes of 101 pixels (~450m) in azimuth and 61 pixels (~370m) in range. After image cross-correlation was completed, the 1:250 000 Canadian Digital Elevation Dataset (CDED; 100 m grid spacing) of the glacier surface was used to remove the topographic component of the slant range displacement, allowing conversion of the slant range displacement to ground range displacement.
Summary of RADARSAT-2 imagery used in this study for determining surface motion of Devon Ice Cap

Ground range displacements and azimuth displacements were calibrated using areas of known zero velocity (i.e. rock outcrops). Final velocities were then determined from the corrected displacements and the values were standardized to annual values (Reference Joughin, Kwok and FahnestockJoughin and others, 1998; Reference Short and GrayShort and Gray, 2004, 2005). It was assumed that ice motion is parallel to the surface. Speckle-tracking results were filtered using ArcGIS 9.2 with ~250m grid spacing.
The accuracy of the results was verified using the following criteria (although 1 and 2 may not necessarily apply for surge-type glaciers):
-
1. Motion should be faster in the glacier centre than near the glacier side walls (due to marginal friction).
-
2. Flow direction should be oriented parallel to surface flow features (e.g. medial moraines and flow stripes). It should also generally follow surrounding topography (e.g. valley side walls) where the motion is constrained.
-
3. Flow vectors should not change dramatically in either direction or magnitude over short distances, and adjacent vectors should be comparable.
When a speckle-tracking result was found to be incorrect using the criteria outlined above, the point was deleted from the dataset and removed from further analysis. All filtering was completed manually and limited to removing only a few points from the larger dataset. Incorrect matches arise when the cross-correlation method finds a stronger correlation with a distant pixel than with the true match. This occurs mainly along shear margins between a glacier and its valley walls, where shearing can change the phase signature over the 24 day period between image acquisitions. An inverse distance weighting (IDW) interpolation method was used to create a raster dataset (100 m grid spacing) of surface velocities across Devon Ice Cap from the filtered dataset. IDW provides a conservative approach to interpolation, as newly created values cannot exceed those determined by the speckle-tracking algorithm.
3.2. Error analysis
The dominant error in the speckle-tracking process arises from misregistration of the image chips. To quantify this, error is assessed in two ways: (1) comparison of motion over non-moving regions such as rock outcrops and ice divides; and (2) comparison with in situ displacements measured with differential GPS (dGPS).
3.2.1. Bedrock outcrops
Systematic errors in the speckle-tracking results, such as co-registration and cross-correlation (i.e. mismatch) errors, were assessed by analyzing apparent displacements over stable rock outcrops. This enables quantification of the minimum detectable motion that the speckle-tracking technique can reliably achieve. Approximately 380 000 velocity values over non-glaciated bedrock regions around Devon Ice Cap yielded a mean velocity of 4.29 m a-1, with a standard deviation (1σ) of 4.22 m a-1. We consider these errors to be within an acceptable range for the method since all outlet glaciers of Devon Ice Cap experience velocities higher than this. For example, this error represents ~4.4% of the average velocity measured along the center line of Belcher Glacier.
3.2.2 Ice divides
To assess error in the upper regions of the ice cap, velocities were extracted along ice divides where they should be close to zero (major ice divides are denoted in Fig. 1). Velocities were extracted every 10 m along the entire length of these divides, totalling ~27 000 points. Mean velocity along the divides was 6.39 m a-1, with 1σ of 4.15 m a-1, which is comparable to the velocity measured over the bedrock outcrops. Errors may be higher within the upper interior regions of the ice cap, as azimuth streaking, indicative of inhomogeneities in the ionosphere (Reference Gray, Mattar and SofkoGray and others, 2000; Reference Short and GrayShort and Gray, 2004), was evident during data processing. However, this has little impact on the results, as velocities in this region are typically <10 m a-1 and the streaking did not occur over the major outlet glaciers, which are the major regions of velocity variability and sources of iceberg calving flux. In addition, speckle-tracking results provided consistent velocity measurements for the overlapping regions of different image pairs over outlet glaciers.
3.2.3. dGPS measurements
Two continuously operating dGPS systems collected in situ velocity data on Belcher Glacier during the 2009 RADAR-SAT-2 image acquisitions. The dGPS data were processed with the Precise Point Positioning (PPP) solution provided by Natural Resources Canada (http://www.geod.nrcan.gc.ca/products-produits/ppp_e.php), with positions considered to be accurate to within ±0.15 m horizontally. Table 2 compares these measurements (based on the velocity at a single overlapping pixel), with very good agreement between the datasets. At Belcher Glacier stake 1 (located furthest down-glacier; Fig. 1), the speckle-tracking displacement is 3.05 m a-1 higher than the in situ displacement, while at Belcher Glacier stake 2 the speckle-tracking results are 0.24 m a-1 lower than the dGPS displacement. These differences agree within the velocity errors determined over bedrock outcrops and ice divides (Sections 3.2.1 and 3.2.2). In terms of the orientation of displacement, there is excellent agreement between the datasets, with the results lying within ~0.5° for both stakes.
Displacement and orientation of dGPS (in situ) marker stakes compared with speckle-tracking results. Both datasets were collected over 5-29 March 2009

4. Results and Discussion
4.1. Devon Ice Cap velocity structure
Figure 1 shows the velocity structure of Devon Ice Cap for March 2009. The ice cap is separated into four quadrants (northwest, southwest, northeast and southeast) that approximate the drainage divisions described by Reference Burgess, Sharp, Mair, Dowdeswell and BenhamBurgess and others (2005). These velocity patterns are in good agreement with those described by Reference Burgess, Sharp, Mair, Dowdeswell and BenhamBurgess and others (2005). Faster motion (150-200 m a-1) occurs on several large outlet tidewater glaciers in the eastern portion of the ice cap (Belcher, Fitzroy, East5, East7 and Southeast2 glaciers) and on North and South Croker Bay Glaciers in the southwest portion of the ice cap. Motion is slower (<20 m a-1) in the western lobe and interior regions of the ice cap, where ice is probably frozen to the bed and motion occurs by internal deformation alone.
4.2. Areas of velocity change
To assess whether there have been changes in the velocity of Devon Ice Cap over the last 10-15 years, the results of this study are compared with those of Reference Burgess, Sharp, Mair, Dowdeswell and BenhamBurgess and others (2005) (Fig. 2). Decreases in surface velocity are evident on a number of outlet glaciers, including the main trunks of the Croker Bay glaciers (~20-50ma-1 slower);the southernmost land-terminating glaciers in the southeast quadrant, East6 Glacier and the north arm of Fitzroy Glacier (~20-40ma-1 slower);and Eastern Glacier (~10-20ma-1 slower). Belcher Glacier terminus is also an area of slowdown, with velocities in this study up to 100ma-1 lower than reported by Reference Burgess, Sharp, Mair, Dowdeswell and BenhamBurgess and others (2005). Four areas show significant velocity increases during the study period: the terminus of North Croker Bay Glacier (~75-100 m a-1 faster), the main trunk of Belcher Glacier between its terminus and main tributary (~65-85 m a-1 faster), East5 Glacier (~85-120ma-1 faster) and Southeast2 Glacier (~20-50ma-1 faster). North Croker Bay Glacier has a complex velocity structure, with an apparent slowdown along its main trunk but a significant speed-up at the terminus (~20-75ma-1 faster). Velocity increases of up to 100 m a-1 are observed on portions of South Fitzroy Glacier which connect with the ice-cap interior.
Map of differences between ice surface velocities derived by Reference Burgess, Sharp, Mair, Dowdeswell and BenhamBurgess and others (2005) from 1991/1996 ERS-1 and -2 and 2000 RADARSAT-1 data and the results derived in this study from 2009 RADARSAT-2 imagery. Dashed lines indicate extracted velocities along East5 and Southeast2 Glaciers presented in Figure 3.

The velocity changes can be attributed to three potential reasons: (1) seasonal differences in flow speed combined with changes in the period of velocity measurement; (2) differences between the measurement techniques used in this study and that of Reference Burgess, Sharp, Mair, Dowdeswell and BenhamBurgess and others (2005);and (3) long-term (greater than annual) velocity changes in the glaciers. We discuss these possibilities in detail in the following subsections.
4.2.1 Seasonal differences
Some of the differences in velocities observed in this study may reflect differences in the timing of image acquisition. All imagery used in this study was acquired in March 2009, while Reference Burgess, Sharp, Mair, Dowdeswell and BenhamBurgess and others (2005) used ERS-1 and -2 imagery from 6-9 February 1996 (northeast quadrant), 15-16 March 1996 (southeast quadrant), 19-20 April 1996 (southeast quadrant) and 25-26 April 1996 (western quadrant). They applied speckle tracking to RADARSAT-1 imagery obtained in the periods 14 October to 7 November 2000 and 20 November to 14 December 2000 for the Belcher Glacier terminus.
Reference Van WychenVan Wychen (2010) determined that the main trunk of Belcher Glacier accelerates after a velocity minimum in the fall (October and November) to reach velocities that are ~10-20% higher in March and April. In contrast, speckle tracking at the terminus of Belcher Glacier between October 2009 and February/March 2010 (Van Wychen, unpublished data) reveals higher velocities in the fall and lower velocities through the winter, likely due to the presence of sea ice acting as a buttress against the terminus (Reference Van WychenVan Wychen, 2010). As such, the difference between the October-December velocities at Belcher Glacier terminus reported by Reference Burgess, Sharp, Mair, Dowdeswell and BenhamBurgess and others (2005) and the March velocities reported here lies within the ~10-20% range of seasonal variability. Similarly, the measured velocity increases of 10-25 m a-1 on South Fitzroy Glacier may be partially due to differences in the seasonal timing of image acquisitions used by Reference Burgess, Sharp, Mair, Dowdeswell and BenhamBurgess and others (2005) (6-9 February 1996) compared with those used in this study (529 March 2009). However, the observed velocity changes cannot be attributed solely to differences in the timing of image acquisitions. This is particularly true for the large changes observed over the southeast region of the ice cap, since the image acquisitions over this region occurred over a very similar period (March-April) in both this study and that of Reference Burgess, Sharp, Mair, Dowdeswell and BenhamBurgess and others (2005).
4.2.2. Differences in measurement techniques
Observed differences in velocity may also be due to differences in the method of velocity measurement. The interferometric synthetic aperture radar (InSAR) velocities determined by Reference Burgess, Sharp, Mair, Dowdeswell and BenhamBurgess and others (2005) were obtained using single looks projected to true velocities with an angular window of ±70° of the satellite look direction. Areas outside the ±70° angular window are unreliable and as such are masked out from the velocity map of Reference Burgess, Sharp, Mair, Dowdeswell and BenhamBurgess and others (2005). Velocity maps produced by Reference Burgess, Sharp, Mair, Dowdeswell and BenhamBurgess and others (2005) are likely to produce more accurate results than speckle tracking in the interior of the ice cap and over the western lobe, as interferometry can better resolve the low rates of motion in these regions (provided that ice flow is not perpendicular to the satellite look direction). However, in areas of fast flow (e.g. outlet glacier termini), speckle tracking is likely to produce better results than those determined via interferometry as phase unwrapping becomes more difficult in areas with speeds higher than 100 m a-1, provided that good coherence is maintained (Reference Gray, Short, Mattar and JezekGray and others, 2001;Reference JoughinJoughin, 2002). There are apparent differences along the margins of several glaciers which are probably not real changes in ice dynamics (Belcher, North and South Croker Bay and Fitzroy glaciers). They are likely linked to differences between measurement techniques and imagery used in the two studies, such as radar shadowing along cliff walls and mismatches that occur along the shear margins when phase return changes for speckle tracking.
4.2.3. Long-term velocity changes
Where the differences in surface velocity on Devon Ice Cap are greater than those that can be attributed to differences in the timing of image acquisition or errors in the measurement technique, we assume that the measured velocity changes are due to changes in ice dynamics. Higher velocities (>100 m a-1) are observed on East5 Glacier along a ~10 km transect running up-glacier from the terminus (Fig. 3a). This suggests that East5 Glacier is a larger region of mass loss than reported previously by Reference Burgess, Sharp, Mair, Dowdeswell and BenhamBurgess and others (2005). The clearest and most dramatic changes reported here occurred along most of the length of Southeast2 Glacier, where velocities have increased by >50 m a-1 in many places (Fig. 3b). Reference Burgess, Sharp, Mair, Dowdeswell and BenhamBurgess and others (2005) noted that 'fast' flow of Southeast1 and Southeast2 Glaciers extends further into the accumulation area of Devon Ice Cap than any other glacier, a pattern which is also evident in this study. The spatial pattern of velocity change on Southeast2 Glacier suggests both a deceleration near the head of the glacier and a down- glacier extension of the region affected by accelerated flow since the study of Reference Burgess, Sharp, Mair, Dowdeswell and BenhamBurgess and others (2005). This may indicate that Southeast2 is a surging glacier. Reference Burgess, Sharp, Mair, Dowdeswell and BenhamBurgess and others (2005) used Landsat-7 imagery to show evidence of previous episodes of fast motion for Southeast1 and Southeast2 Glaciers based on degraded flow stripes, former marginal shear zones and medial moraines, suggesting that this region has experienced past changes in dynamics. Additionally, repeat Ice, Cloud and land Elevation Satellite (ICESat) laser altimetry data from fall 2003 to fall 2009 reveal a thickening of ice in the stagnant regions into which Southeast2 Glacier drains (Reference Boon, Burgess, Koerner and SharpBoon and others, 2010;Reference GardnerGardner and others, 2011), a characteristic common at the terminus of actively surging glaciers. Using indirect methods of calculating flux divergence along the length of Southeast1 and Southeast2 Glaciers, Reference Burgess and SharpBurgess and Sharp (2008) also inferred a thickening of the terminus region of these glaciers and suggested that it was due to 'faster'-flowing ice from the upper reaches of the glaciers running into 'slower' ice at the terminus. The results presented here indicate that this may indeed be the case.
Comparison of surface velocities extracted along the centre line of (a) East5 Glacier and (b) Southeast2 Glacier from this study in March 2009 (solid black line with red background) and from Reference Burgess, Sharp, Mair, Dowdeswell and BenhamBurgess and others (2005) in March and April 1996 (dashed black line with grey background). Shaded portions indicate the range of uncertainties associated with each dataset.

A northern extension of Southeast2 Glacier (star in Fig. 1), with motion of ~25-50ma-1, is visible ~25 km from the terminus. This region consists of an area of faster motion surrounded by slower-moving ice and was not previously identified in the InSAR velocity maps of Reference Burgess, Sharp, Mair, Dowdeswell and BenhamBurgess and others (2005) because the feature was aligned almost perpendicular to satellite look direction (although its existence was previously inferred by Reference Burgess and SharpBurgess and Sharp, 2008). Overall, the southern side of Southeast2 Glacier experiences higher velocities (~75-100 m a-1 faster) than the northern side. This suggests that the surge has not affected the northern tributaries, as the higher velocities occur in the mid-section of the main feeder glacier, which happens to be at the southern edge of the system as a whole.
4.3. Ice flux
Ice discharge into the oceans from Devon Ice Cap was calculated by extracting ice thickness and depth-averaged velocities at 50 m intervals across the terminus of each major tidewater outlet glacier. Ice thickness was taken from airborne radio-echo sounding measurements made in 2000 by Reference Dowdeswell, Benham, Gorman, Burgess and SharpDowdeswell and others (2004). The estimated error of these measurements is 10 m, although the 9year time gap between the thickness measurements used to define flux gates and the velocity measurements reported here means that they are only an approximation of current ice thickness. This is supported by studies indicating that the mass balance of ice caps in the Queen Elizabeth Islands during the period 2005-09 was more negative than the 1963-2004 average (Reference GardnerGardner and others, 2011; Reference Sharp, Burgess, Cogley, Ecclestone, Labine and WolkenSharp and others, 2011). Reference GardnerGardner and others (2011) found that the termini of tidewater glaciers within the Queen Elizabeth Islands region thinned on average by 0.38 ± 0.04 m a-1 between 2003 and 2009 and, as such, an additional error of 5-10m in the termini thickness data is possible. However, we do not have specific information on the importance of this process for Devon Ice Cap, so it is not accounted for here.
To convert surface velocities into depth-averaged values, the exact ratio of basal sliding to internal deformation at each outlet glacier terminus should be known. Because this information is not directly available, upper and lower values are calculated using two methods. For the lower flux value, a depth-averaged velocity of 80% of the surface value was used (Reference PatersonPaterson, 1994). For the upper limit, all motion at the termini of the outlet glaciers is assumed to be due to sliding, based on the identification of these sectors as areas of enhanced sliding by Reference Burgess, Sharp, Mair, Dowdeswell and BenhamBurgess and others (2005). Thus, to create lower (Qmin) and upper (Qmax) estimates of ice discharge, the following formulae were used:


where V is surface ice velocity, h is ice thickness, W is column width (50 m), V error refers to the error associated with the velocity dataset as discussed in Section 3.2 using the largest error determined, and h error refers to the error associated with the ice-thickness dataset (±10 m) as discussed above. To determine upper and lower limits of ice flux for each glacier, 50m sections are then summed along the whole glacier width.
Figure 4 presents present-day ice fluxes for all of the major tidewater outlet glaciers of Devon Ice Cap. Belcher Glacier is the largest contributor to overall flux, accounting for ~42% of total iceberg discharge from Devon Ice Cap (0.17 ± 0.03 Gta-1), although this value is less than that previously estimated by Burgess and others (2005; 0.22 ± 0.04Gta-1). Our results reveal that the other large contributors to ice discharge from Devon Ice Cap are North and South Croker Bay, Southeast1, outheast2 and Fitzroy glaciers, while the least significant contributor is Sverdrup Glacier. Total ice discharge via the major outlet tidewater glaciers of Devon Ice Cap is estimated to be ~0.40 ± 0.09 Gta-1 (not including area loss at the terminus).
Comparison of the ice flux for each of the main outlet glaciers from Devon Ice Cap determined by this study and Reference Burgess, Sharp, Mair, Dowdeswell and BenhamBurgess and others (2005). Error bars indicate the uncertainty in each assessment.

5. Conclusions
Speckle tracking of RADARSAT-2 imagery provides an effective means for monitoring ice motion and estimating calving fluxes of Arctic ice caps. The results presented here update and improve our knowledge of the velocity structure of Devon Ice Cap and provide ice motion maps that are not limited by the look-direction issues that were associated with previous studies based on SAR interferometry. Large portions of the western part of Devon Ice Cap have velocities less than 15 m a-1, which are indicative of ice that is likely frozen to its bed and motion that is limited to internal deformation. By contrast, faster motion (~30-125 m a-1) is observed on the large trunks of major tidewater outlet glaciers. The ice-flow patterns show good agreement with flow regimes described by Reference Burgess, Sharp, Mair, Dowdeswell and BenhamBurgess and others (2005). The only glaciers for which there is high confidence that long-term changes in ice dynamics have occurred over the last ~15 years are East5 and Southeast2 Glaciers. The spatial pattern of flow changes for Southeast2 Glacier is consistent with continued down-glacier propagation of a surge front. The existence of a surge-type glacier (Cunningham West) on southeast Devon Ice Cap has previously been inferred from the occurrence of looped surface moraines (Reference Copland, Sharp, Nienow and BinghamCopland and others, 2003b), but has not previously been measured in its active phase there.
Ice flux from Devon Ice Cap is currently estimated to be 0.40 ± 0.09Gta-1, which lies within the range determined by Reference Burgess, Sharp, Mair, Dowdeswell and BenhamBurgess and others (2005) using data acquired in the mid-1990s and 2000. There has therefore been no apparent increase in calving flux despite a more negative climatic mass balance in recent years.
Acknowledgements
We thank the Natural Sciences and Engineering Research Council of Canada (IPY Special Research Opportunity and Discovery Grants/Northern Supplements to L.C. and M.S.), the Canada Foundation for Innovation, the Ontario Research Fund, the Polar Continental Shelf Project, the Canadian Space Agency (SOAR-E program), the Northern Scientific Training Program, and the University of Ottawa. For assistance in the collection of field data we thank Tyler Sylvestre, Emilie Herdes, Gabe Wolken, Hanna Milne, Alex Gardner and Jamie Davis. We also thank the Nunavut Research Institute and the communities of Grise Fiord and Resolute Bay for permission to conduct this research. We are grateful for comments from Ted Scambos and two anonymous reviewers which greatly improved the text.



