

Social marketing campaigns are being used increasingly as a way to reach the public, to modify health or prosocial behaviours and to promote specific health issues. In view of the high costs of such campaigns, it is important to understand how far they can make a significant population impact, to characterise the most effective and efficient delivery of messages to mass groups, and to evaluate the overall strengths and weaknesses of social marketing interventions in contributing to health improvements. Reference Corrigan1 The Time to Change (TTC) programme, launched in January 2009, Reference Henderson and Thornicroft2 aimed to make significant improvements across England in public attitudes and to achieve less discriminatory behaviour in relation to people with mental illness. One component of the programme was the anti-stigma social marketing campaign, which engaged the public through mass media channels, calls to action and participation in mass social events. We assessed its effectiveness in improving public knowledge, attitudes and behaviour in relation to people with mental illness over a 2.5-year period between January 2009 and August 2011.
Method
Campaign development
The anti-stigma social marketing campaign was developed by a team of individuals working with TTC including people using mental health services and individuals with expertise in such campaigns. Researchers from the Institute of Psychiatry, London, acted as the independent evaluators and did not participate in the intervention development or delivery. Initially a survey (‘Stigma Shout’) of almost 4000 people with direct experience of mental health problems was conducted, followed by workshops with over 100 survey participants. These activities explored situations in which people with mental health problems experienced stigma and discrimination, from whom they experienced it, and what should be done. In-depth interviews with survey respondents were used to identify attitudes to mental illness that contributed to stigma and discrimination. Focus groups and interviews with the target audience were conducted throughout the campaign period, and campaign messages were tailored according to what resonated best with the target group.
Target audience
The campaign media targeted men and women in their mid-20s to mid-40s, from middle-income groups. A broad target group was selected in order to reach a high proportion of individuals. The campaign was aimed primarily at those who had some proximity to people with mental health problems, not as close family members but as friends, colleagues and wider family. Based on insights during the campaign development phase, individuals were categorised into groups termed ‘active discriminators’, ‘subconscious stigmatisers’ and those who are ‘unaware of mental illness’. Members of the ‘unaware’ group were not main targets as they might not feel that a campaign discussing mental health issues was relevant to them. Although their behaviour was extreme, it was felt that people in the ‘active discriminators’ group would be difficult to target, constitute a small number of individuals and seem unacceptable in mainstream society; thus, although this group was not chosen as a specific target of the social marketing campaign, it could be influenced indirectly by the target group of ‘subconscious stigmatisers’ as they became more active in challenging stigma and discrimination. Thus, in terms of attitudes, the campaign's primary target audience was those termed ‘subconscious stigmatisers’: people who do not recognise that discrimination against people with mental health problems happens, or how their actions might contribute to this. Thus, the overall target group was one that included a significant proportion of the public, may indirectly influence other groups, and may have attitudes most amenable to a social marketing campaign.
Campaign media and messages
Each year there were two main bursts of social marketing activity including some or all of national television, print, radio, cinema, outdoor and online advertisements. All advertising campaigns were supported by public relations and media work to maximise unfunded editorial coverage. Campaign reach was extended by working in partnership with stakeholder organisations (e.g. National Health Service trusts) across England and making campaign materials freely available. Social media included Facebook, Twitter and YouTube, as these were the sites most used by the target audience. Advertising directed the target audience to the TTC website, which includes stories of people with mental health problems, tips for what people can do to fight stigma, blogs and forums (www.time-to-change.org.uk). The campaign focused on behaviour change, using social media to drive the target group to action (i.e. from small actions, such as starting a conversation about mental health with a friend or co-worker, to helping organise a local event aimed at engaging the community or organisations in fighting stigma and discrimination against people with mental health problems). Social media incorporated interactive online content, suggested simple ways to change behaviour and recruited individuals to engage in local campaign activities.
Year 1 activity (2009) used a myths/facts message to get discrimination against people with mental health problems on the public agenda and improve knowledge relevant to stigma. Year 2 focused on attitudes, emphasising recognition of one's own prejudice, including the hard-hitting ‘Schizo movie’ advert to encourage people to recognise their own stereotypes about schizophrenia (www.youtube.com/watch?v=6IBgkks_jLw). During year 3, the ‘Time to Talk’ campaign was introduced to encourage the target audience to start a conversation about mental health and to facilitate social contact between people with and without mental health problems. Each year's campaign was developed applying the results of evaluations of the previous ones.
Mass participation social contact events
During 2011, alongside the Time to Talk campaign and call to action, social contact events were developed in partnership with local organisations to provide real-life opportunities to talk about mental health problems and to act on the messages delivered by the Time to Talk campaign. Some social contact events were embedded within existing festivals or took place in town centres with high levels of pedestrian traffic. These events used a mobile living-room set and were staffed by volunteers with experience of mental health problems; these volunteers approached passers-by and encouraged them to take time out and talk about mental health in the comfort of the living-room set. Members of the public could relax in this setting with a cup of tea or water and explore the interactive facilities, which included written material designed to educate and improve attitudes about mental health. Mental health professionals were also available at some events for members of the public who required further information on how to access services. Other events were organised specifically for TTC and incorporated activities or educational resources to engage the public (such as sports, dance, film and music) and to promote social contact between people with and without mental health problems.
Study participants
The mass media and social contact events were evaluated separately using different sets of participants.
Mass media component
Participants were recruited through an online market research panel (900-1100 participants per burst). Previous work suggests that behavioural intentions towards people with mental health problems may be better assessed using online self-complete methods rather than in-person interviews. Reference Henderson, Evans-Lacko, Flach and Thornicroft3 The sample was restricted to the campaign target population (i.e. residents of England aged 25-45 years and of middle-income groups). Quotas were set for each type of media used to enhance the likelihood that survey participants were exposed to campaign materials. Online panel interviews took place before and after each burst of campaign activity. Quotas were also set to include equal distributions of age, gender and socioeconomic status, and the sample was designed to be geographically representative of the population in England. Ethnic minority participants were oversampled to ensure that we had sufficient statistical power to analyse this subgroup.
Social contact component
Participants were adults who attended a social contact event in different cities around England and had a conversation with a volunteer. In total 725 participants - 192 men and 519 women, 14 of undisclosed gender, mean age 38.1 years (s.d. = 14.1) - completed a questionnaire.
Measures
The National Institute for Health and Clinical Excellence emphasises the inclusion of knowledge, attitude and behavioural components when developing and evaluating interventions aimed at behaviour change among individuals or populations. 4 Therefore, in addition to measuring prompted campaign awareness and message communication, our evaluation included outcome measures of mental health-related knowledge, attitudes and behaviour. Additional measures were tailored for the evaluation of the mass media (e.g. campaign awareness) v. social contact events (quality and quantity of social contact), as described below.
Mass media component
Campaign awareness. Spontaneous (unprompted) awareness was assessed by the question, ‘Can you think of any campaigns - that is, advertising or events in the local community - you have seen or heard of recently concerning mental health or mental health problems?’. Those who answered positively were then asked to describe everything they remembered seeing, hearing or feeling about the campaign. Answers were coded carefully as pertaining to TTC or not. Prompted awareness was then assessed for each type of TTC media and/or activity. For example, individuals were asked whether they had seen the television advertisement, seen a similar advertisement, or did not know if they had seen it or not. Awareness of each type of media communication was assessed separately. Individuals who reported seeing the advertisement were categorised as ‘campaign aware’ whereas those who responded ‘no’ or ‘don't know’ were categorised as ‘not campaign aware’. Overall campaign awareness was summarised into a binary variable (campaign aware: yes/no) for whether individuals reported seeing any of the media. The number of media that each individual was aware of was also tabulated. Campaign awareness associated with the post-burst interviews pertained to awareness of the specific media immediately preceding the survey, whereas awareness during the pre-burst stage referred to recall of the previous campaign burst.
Mental health-related knowledge. Mental health-related knowledge was measured using the Mental Health Knowledge Schedule (MAKS). Reference Evans-Lacko, Little, Meltzer, Rose, Rhydderch and Henderson5 This comprised six items covering stigma-related mental health knowledge areas (help-seeking, recognition, support, employment, treatment and recovery) and six items that enquired about classification of various conditions as mental illnesses. Reference Rusch, Evans-Lacko and Thornicroft6 Overall test-retest reliability of the MAKS was 0.71 and the overall internal consistency among items was 0.65. Reference Evans-Lacko, Little, Meltzer, Rose, Rhydderch and Henderson5
Mental health-related attitudes. Attitudes were assessed based on three items from the UK Department of Health Attitudes to Mental Illness survey. These items were chosen a priori in collaboration with the campaign developers and approved by an expert panel including people using mental health services and international stigma experts. They allowed the evaluation results to be directly compared with the concurrent national Attitudes to Mental Illness surveys, Reference Mehta, Kassam, Leese, Butler and Thornicroft7 which have used items based on the Community Attitudes toward the Mentally Ill (CAMI) and Opinions about Mental Illness scales since 1993; Reference Taylor and Dear8,Reference Cohen and Struening9 see also Evans-Lacko et al, this supplement. Reference Evans-Lacko, Henderson and Thornicroft10 The items were selected in line with campaign targets and on the basis of their significance in relation to stigma and discrimination; they assessed attitudes regarding commonality (‘Virtually anyone can become mentally ill’), responsibility (‘People with mental health problems should not be given any responsibility’) and dangerousness (‘People with mental health problems are far less of a danger than most people suppose’). All items addressed messages that were explicitly targeted by the campaign: for example, the ‘one in four’ message was a part of the myths/facts campaign and addressed commonality; the ‘Schizo movie’ advert aimed to challenge stereotypes about mental illness and dangerousness; and the personal testimonials of people with mental illness demonstrated real stories of empowerment.
The choice of attitude items was based on previous research and the priorities of the campaign. Attitudes related to commonality and responsibility have been shown to be amenable to a social marketing intervention. Reference Vaughan and Hansen11 Additional research has shown that increasing awareness of depression was associated with an increase in sensitivity to issues of discrimination. Reference Jorm, Christensen and Griffiths12 Assessment of attitudes relating to dangerousness was important because previous research has suggested that public attitudes about dangerousness are especially harmful and can lead to discriminatory behaviour against people with mental illness. Reference Angermeyer and Dietrich13,Reference Corrigan, Rowan, Green, Lundin, River and Uphoff-Wasowski14 Moreover, Thompson et al have suggested that attitudes about dangerousness may limit the effectiveness of anti-stigma interventions; Reference Thompson, Stuart, Bland, Arboleda-Florez, Warner and Dickson15 thus, it was important to assess the malleability of attitudes regarding dangerousness alongside an anti-stigma campaign.
Mental health-related intended behaviour. Intended behaviour (the level of intended future contact with people with mental health problems) was measured using the Reported and Intended Behaviour Scale (RIBS). Reference Evans-Lacko, Rose, Little, Flach, Rhydderch and Henderson16 We specifically assessed changes in four intended behaviour outcomes (domains comprised living with, working with, living nearby and continuing a relationship with someone with a mental health problem) which were based on existing measures of social distance, which assess willingness to engage with a member of the ‘outgroup’. Reference Link, Yang, Phelan and Collins17 Assessment of intended behaviour allowed for brief and feasible evaluation at the population level. Although assessment of actual behaviour is also important, to understand these changes at the population level would require contextualisation of behaviours (i.e. whether individuals chose to live with someone with mental health problems, and whether they perceived this as a positive experience). Additionally, because some behaviours might not be relevant to all participants, we measured intended behaviour among the public and changes in reported and experienced discrimination from the perspective of those using mental health services. Reference Hamilton, Pinfold, Rose, Henderson, Lewis-Holmes and Flach18 Overall test-retest reliability of the RIBS was 0.75 and the overall internal consistency of the scale was 0.85. Reference Evans-Lacko, Rose, Little, Flach, Rhydderch and Henderson16
Social contact component
Among the social contact event participants, we collected sociodemographic information and data on whether they had experience of mental health problems, social proximity to someone with a mental health problem, and whether this was disclosed during the event. Participants who had met someone with a mental health problem were asked to identify the type of problem by choosing one or more of the following categories: depression, eating disorder, schizophrenia, bipolar disorder, drug addiction, panic attacks and other.
Contact quality and quantity
The duration of the intergroup contact reported by participants was measured by asking ‘How long did you speak with the individual you met?’ (1, less than 10 min; 2, between 10 min and 30 min; 3, more than 30 min). Participants indicated the quality of the contact they experienced by answering three questions, based on the facilitating conditions theorised by Allport and by Pettigrew & Tropp, Reference Allport19,Reference Pettigrew and Tropp20 on three-point response scales (1, no; 2, yes, a little; 3, yes, a lot): ‘Do you feel you got to know the person?’, ‘During the event did you feel like you were actively working together?’ and ‘Do you feel like you were both able and willing to achieve that goal?’. This scale did not attain the conventional level of reliability (α = 0.55); however, as item deletion did not improve scale reliability we retained all three items.
Attitude change. We measured change in participants' attitudes towards people with mental health problems in relation to the social contact event specifically using a single item (to maximise the response rate): ‘Do you feel that your attitude towards people with mental health problems has changed?’ (1, yes, more negative; 2, no, same; 3, yes, more positive).
Disclosure. We measured participants' hypothetical discomfort with talking about their own mental health problems using two items measured on five-point response scales (1, very uncomfortable; 5, very comfortable). We asked, ‘In general, how comfortable would you feel talking to a friend or family member about your mental health?’ and ‘In general, how comfortable would you feel talking about your mental health at work?’ (α = 0.73).
Intended behaviour. Intended behaviour was measured using the RIBS (as in the mass media component evaluation). Reference Evans-Lacko, Rose, Little, Flach, Rhydderch and Henderson16 As we hoped that the intervention would ultimately increase participants' confidence to challenge mental health-related stigma, we also measured confidence to challenge stigma using a single item: ‘As a result of participating in this event, I feel I have more confidence to challenge stigma and discrimination when I see it.’ (1, not at all; 2, a little; 3, moderately; 4, a lot).
Statistical analysis
Statistical analyses using SAS version 9.1 and SPSS version 20 on Windows XP were made separately for the evaluation of the impact of the mass media and social contact components of the social marketing campaign.
Mass media component
Sample characteristics and associated confidence intervals are presented for each campaign burst. The level of overall prompted campaign awareness and associated campaign expenditure is also presented for each burst. Multivariable linear regression models investigated predictors of overall MAKS and RIBS scores. Independent variables entered were: campaign awareness (yes/no), ethnicity (categorical: White, Asian, Black, Mixed or Other), gender, age (continuous), marital status (married: yes/no), employment status (categorical: employed, i.e. full or part-time employment or student working full or part-time or not, unemployed or retired), socioeconomic group (categorical: B, C1 or C2), geographic region (London v. other) and degree of familiarity with mental illness/knowing someone with a mental illness (adapted from the ‘level of contact’ report). Reference Holmes, Corrigan, Williams, Canar and Kubiak21 To examine whether there was a consistent pre-post effect, we included a variable indicating whether the assessment occurred before or after the burst of media (pre v. post). Presence of a longitudinal trend was examined by including campaign burst as a covariate in the model. Multivariable logistic regression models estimated the odds of responding positively (i.e. agree strongly or agree slightly) to each of the CAMI statements. All CAMI items were coded so that agreement summarised a less stigmatising response.
Sampling weights were developed to match characteristics of the sample recruited to the target population in England, according to prevalence rates of ethnicity within geographic region reported by the Office for National Statistics, and were used in all analyses. The final regression model applied sampling weights and inverse probability weights. Inverse probability weighting allows for modelling of independence between exposure to the campaign and stigma outcomes and estimation of causal effects. Reference Curtis, Hammill, Eisenstein, Kramer and Anstrom22-Reference Rubin24 For each observation a separate inverse probability weight was created. Inverse probability weights were proportional to the inverse of the propensity of campaign exposure. The final model, which incorporated both inverse probability weights and sampling weights, had smaller standard errors and narrower confidence intervals than the model including sampling weights only, indicating that the model was more parsimonious in addition to accounting for probability of campaign exposure and thus minimising potential confounding associated with campaign exposure.
Social contact component
We investigated the impact of contact (v. no contact) with a person with a mental health problem using independent samples t-tests. Following the example of previous contact research we created a single index of contact by using the product of the quantity of contact and quality of contact scores Reference Voci and Hewstone25,Reference West and Hewstone26 to investigate whether more contact and contact of higher quality were associated with more positive attitude change, more comfort with disclosure, reported intended behaviour and greater confidence to challenge mental health stigma. We tested whether changed attitudes mediated the relationship between contact and confidence to challenge mental health stigma using Preacher-Hayes bootstrap tests as recommended by Zhao et al. Reference Zhao, Lynch and Chen27 Bias-corrected bootstrapping techniques are favoured over conventional forms of mediation tests (e.g. Sobel's Z or the methodology of Baron & Kenny Reference Baron and Kenny28 ), because of their ability to handle skewed data, their superior ability to detect significant mediation effects regardless of the size of main effects and their ability to retain the most power of a test of mediation. Reference Fritz and MacKinnon29
Results
Mass media component
The majority of participants were White, married, working and knew someone with a mental illness across all six bursts (Table 1). Owing to quota sampling, respondent characteristics were similar between bursts except that during burst 6 there was a higher proportion of Black and minority ethnic (BME) respondents. Additional BME respondents were recruited during this burst in order to examine campaign awareness among BME subgroups with more precision.
Mass media campaign participant characteristics, unweighted (n = 5615)

| Burst 1 n = 1110 |
Burst 2 n = 908 |
Burst 3 n = 907 |
Burst 4 n = 913 |
Burst 5 n = 909 |
Burst 6 n = 868 |
|
|---|---|---|---|---|---|---|
| Gender, n (%) | ||||||
| Male | 551 (49.6) | 455 (50.1) | 436 (48.1) | 441 (48.3) | 458 (50.4) | 370 (42.6) |
| Female | 559 (50.4) | 453 (49.9) | 471 (51.9) | 472 (51.7) | 451 (49.6) | 498 (57.4) |
| Socioeconomic group, n (%) | ||||||
| B | 365 (32.9) | 313 (34.5) | 317 (35.0) | 330 (36.1) | 325 (35.8) | 326 (37.6) |
| C1 | 384 (34.6) | 323 (35.6) | 327 (36.1) | 328 (35.9) | 327 (36.0) | 347 (40.0) |
| C2 | 361 (32.5) | 272 (30.0) | 263 (29.0) | 255 (27.9) | 257 (28.3) | 195 (22.5) |
| Age, years: mean (s.d.) | 34.8 (5.7) | 34.6 (5.7) | 34.8 (5.9) | 34.6 (5.8) | 34.5 (5.8) | 34.4 (5.8) |
| Ethnic group, n (%) | ||||||
| Asian | 192 (17.3) | 159 (17.5) | 164 (18.1) | 195 (21.4) | 166 (18.3) | 266 (30.6) |
| Black | 70 (6.3) | 65 (7.2) | 59 (6.5) | 28 (3.1) | 46 (5.1) | 78 (9.0) |
| Mixed | 43 (3.9) | 40 (4.4) | 39 (4.3) | 37 (4.1) | 44 (4.8) | 74 (8.5) |
| Other | 10 (0.9) | 7 (0.8) | 13 (1.4) | 15 (1.6) | 14 (1.5) | 18 (2.1) |
| White | 795 (71.6) | 637 (70.2) | 632 (69.7) | 638 (69.9) | 639 (70.3) | 432 (49.8) |
| Children, n (%) | ||||||
| Yes | 634 (57.1) | 513 (56.5) | 458 (50.5) | 533 (58.4) | 498 (54.8) | 486 (56.0) |
| No | 476 (42.9) | 395 (43.5) | 449 (49.5) | 380 (41.6) | 411 (45.2) | 382 (44.0) |
| Married, n (%) | ||||||
| Yes | 841 (75.8) | 681 (75.0) | 662 (73.0) | 683 (74.8) | 650 (71.5) | 635 (73.2) |
| No | 269 (24.2) | 227 (25.0) | 245 (27.0) | 230 (25.2) | 259 (28.5) | 233 (26.8) |
| Employment status, n (%) | ||||||
| Student | 18 (1.6) | 11 (1.2) | 9 (1.0) | 18 (2.0) | 13 (1.4) | 9 (1.0) |
| Working | 980 (88.3) | 764 (84.1) | 789 (87.0) | 781 (85.5) | 804 (88.4) | 760 (87.6) |
| Not working | 112 (10.1) | 133 (14.6) | 109 (12.0) | 114 (12.5) | 92 (10.1) | 99 (11.4) |
| London resident, n (%) | ||||||
| Yes | 318 (28.6) | 174 (19.2) | 190 (20.9) | 187 (20.5) | 186 (20.5) | 267 (30.8) |
| No | 792 (71.4) | 734 (80.8) | 717 (79.1) | 726 (79.5) | 723 (79.5) | 601 (69.2) |
| Social proximity to mental illness, n (%) | ||||||
| Yes | 836 (75.3) | 714 (78.6) | 703 (77.5) | 689 (75.5) | 673 (74.0) | 644 (74.2) |
| No | 274 (24.7) | 194 (21.4) | 204 (22.5) | 224 (24.5) | 236 (26.0) | 224 (25.8) |
Campaign awareness
Moderate levels of prompted campaign awareness were achieved among the target population following each burst of activity (39%, 44%, 38%, 39%, 59% and 47% respectively). It is noteworthy that campaign awareness following each burst was strongly associated with campaign burst expenditure (r = 0.76, P = 0.08, n = 6), but there was only a trend to significance, probably owing to the small number of data points.
Predictors of campaign awareness. Predictors of campaign awareness varied by burst, because types of media used and messages varied over time. The most consistent predictors of campaign awareness were knowing someone with a mental health problem, Black ethnicity and living in London (relative to not living in London). Notably, Black ethnicity relative to White ethnicity was positively associated with campaign awareness in four out of the six bursts (1, 3, 5 and 6). Asian ethnicity was associated with a lower likelihood of being campaign aware compared with White ethnicity but only during the first burst. Knowing someone with a mental health problem was also a consistent predictor of campaign awareness (bursts 1, 2, 3 and 5). Living in London was associated with higher campaign awareness during the first four bursts. For two of the six bursts (2 and 5), female gender was associated with a higher likelihood of campaign awareness relative to male gender.
Knowledge, attitude and intended behaviour
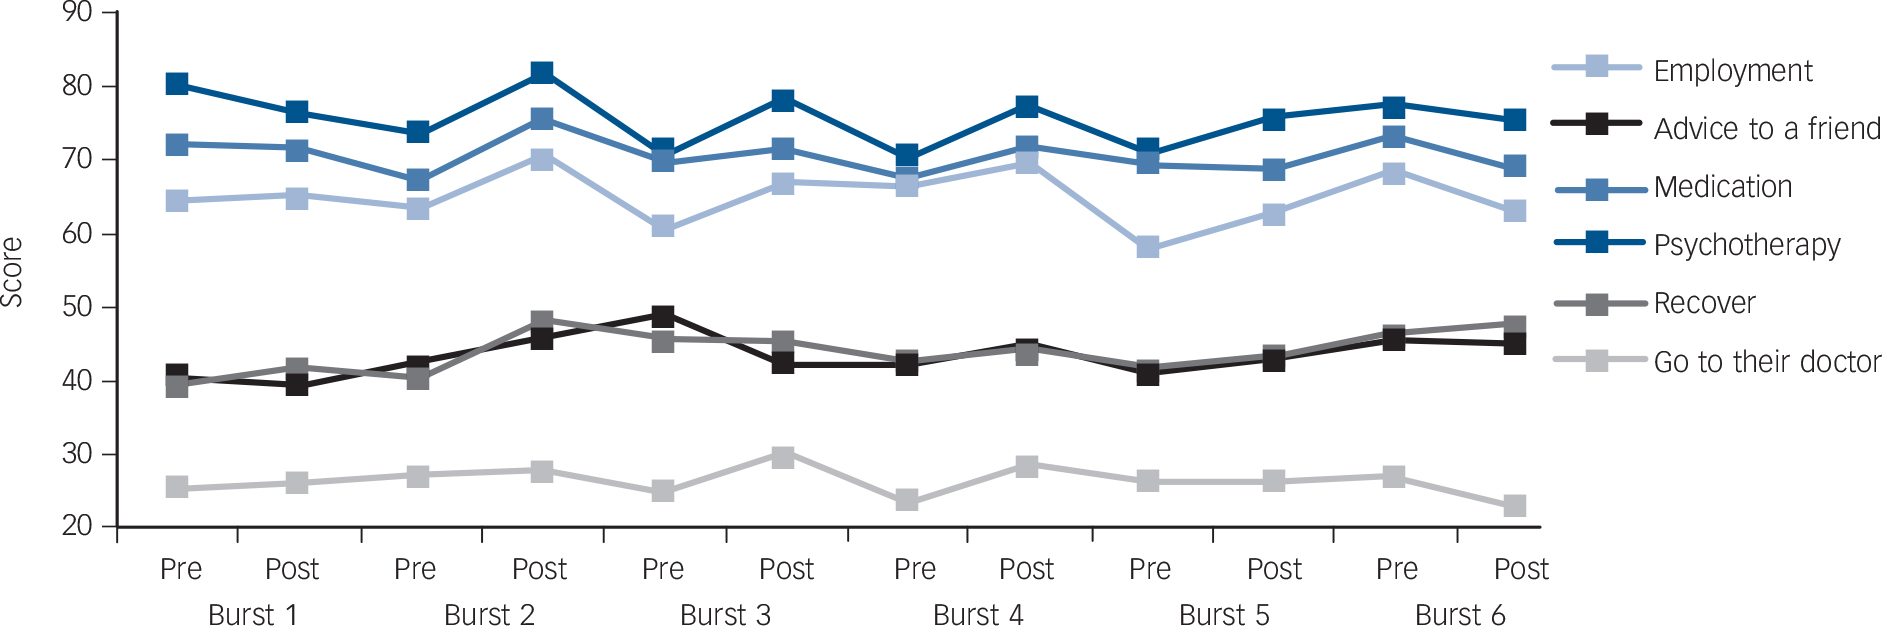
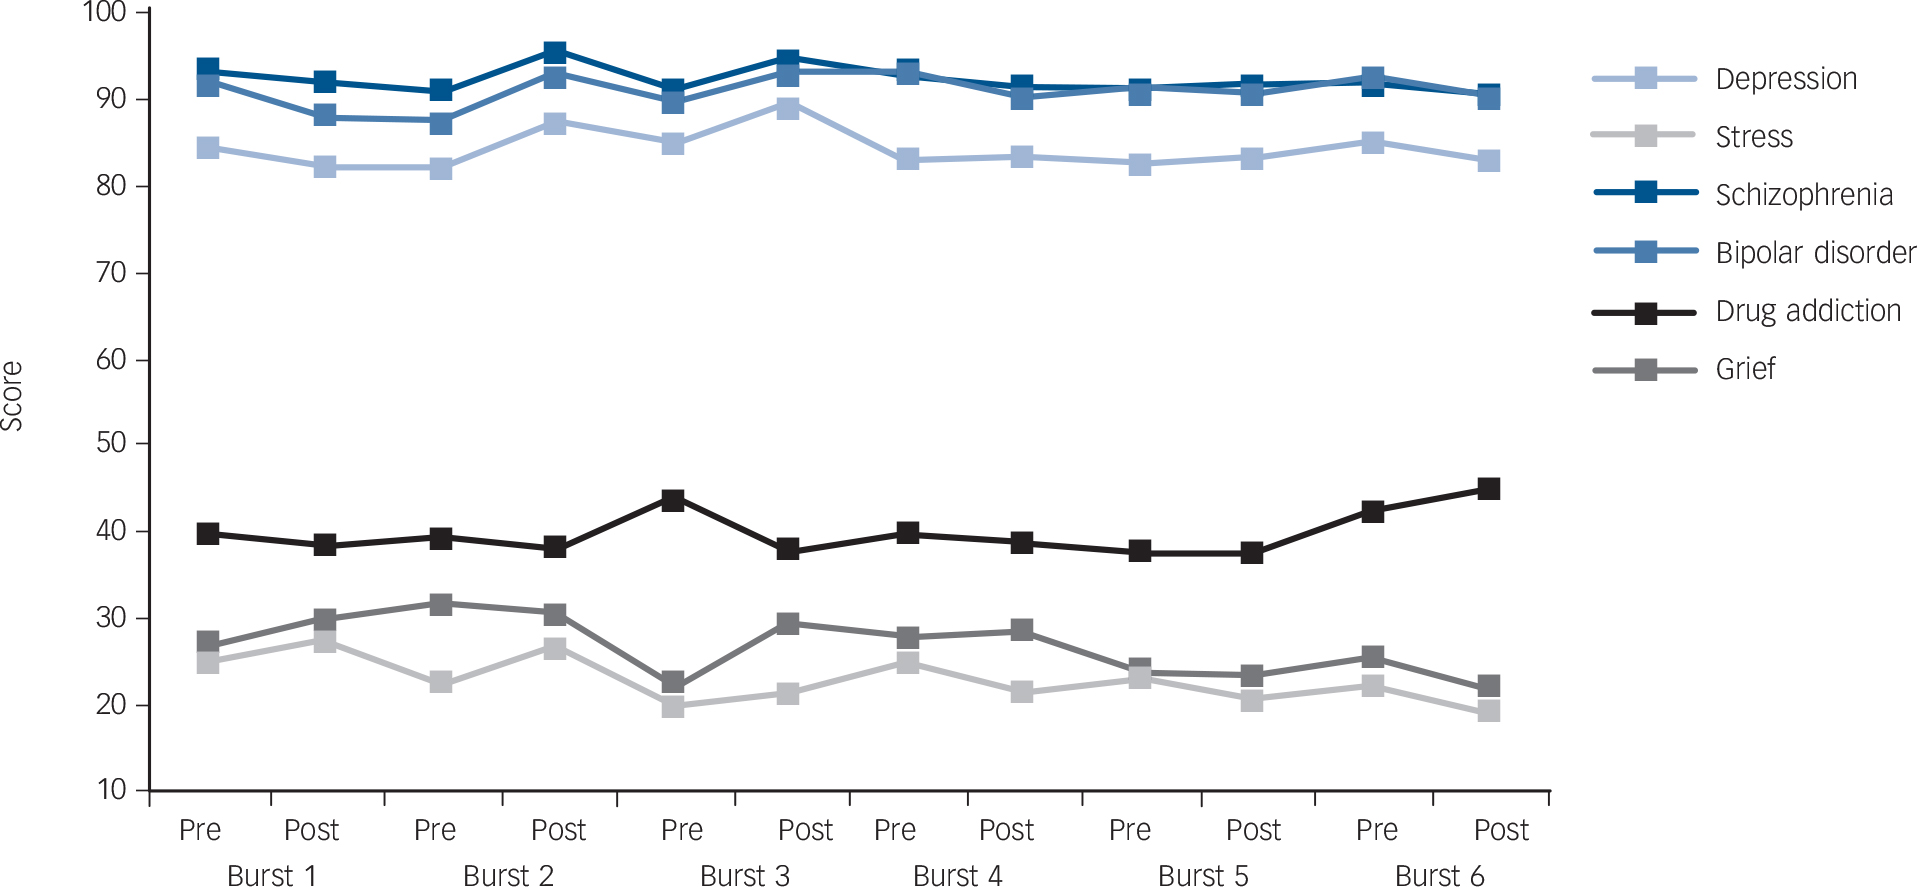
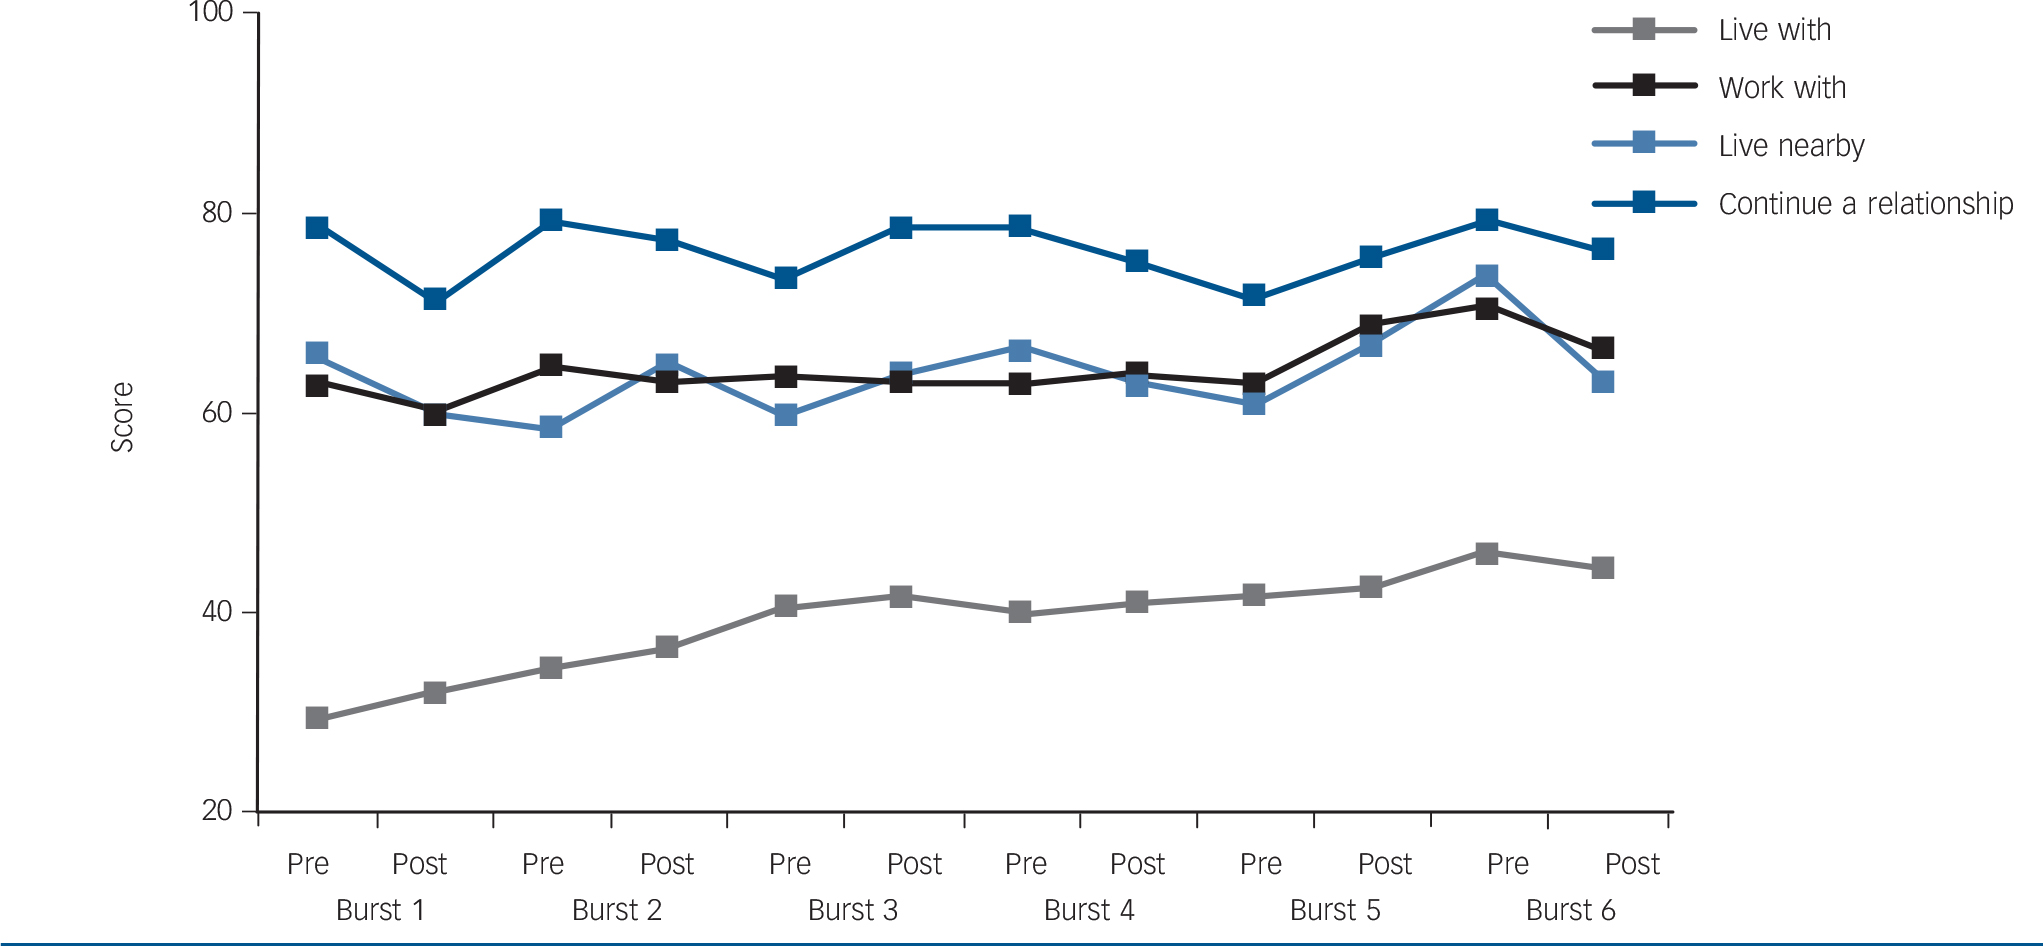
There was no significant longitudinal improvement in overall knowledge or intended behaviour over the entire campaign. Figures 1, 2, 3, 4 show the knowledge, attitude and behaviour trends by item. Figure 1 shows trends in knowledge, as measured by the MAKS, over the six bursts. There was a consistent pre-burst to post-burst improvement on the MAKS item pertaining to psychotherapy: ‘Psychotherapy (e.g. counselling or talking therapy) can be an effective treatment for people with mental health problems’. In spite of this, this item also demonstrated a significant overall decline in agreement over the six bursts. For the MAKS items addressing conceptualisation of mental illness there was a longitudinal improvement in the responses to items pertaining to grief and stress, in that there was a decline in the total target group stating incorrectly that grief or stress is a mental illness, over the six bursts (Fig. 2). One RIBS intended behaviour item (‘In the future, I would be willing to live with someone with a mental health problem’) showed consistent improvement among the total target population, growing 15 percentage points (29.3% to 44.4%) over the six bursts (Fig. 3).
Trends in agreement with Mental Health Knowledge Schedule items (part 1) for total target population, January 2009 to August 2011. Multivariable regression models were fitted for each item and the overall slopes and P-values of the ‘trend’ line associated with each item are as follows: employment slope −0.04, P = 0.06; advice to a friend 0.02, P = 0.47; medication 0.04, P = 0.08; psychotherapy −0.06, P = 0.01; recover 0.01, P = 0.63; go to their doctor −0.02, P = 0.39. All items are coded so that higher scores indicate better knowledge.
Trends in agreement with Mental Health Knowledge Schedule items (part 1) for the total target population, January 2009 to August 2011. Multivariable regression models were fitted for each item and the overall slopes and P-values of the ‘trend’ line associated with each item are as follows: depression slope −0.03, P = 0.24; stress −0.07, P = 0.003; schizophrenia −0.07, P = 0.07; bipolar disorder 0.01, P = 0.71; drug addiction 0.02, P = 0.44; grief −0.07, P = 0.002. All items are coded so that higher scores indicate better knowledge.
Trends in agreement with Reported and Intended Behaviour Scale intended behaviour items for total target population, January 2009 to August 2011. Multivariable regression models were fitted for each item and the overall slopes and P-values of the ‘trend’ line associated with each item are as follows: ‘live with’ slope 0.11, P<0.0001; ‘work with’ 0.03, P = 0.19; ‘live nearby’: 0.03, P = 0.20; ‘continue a relationship’ −0.02, P = 0.43.
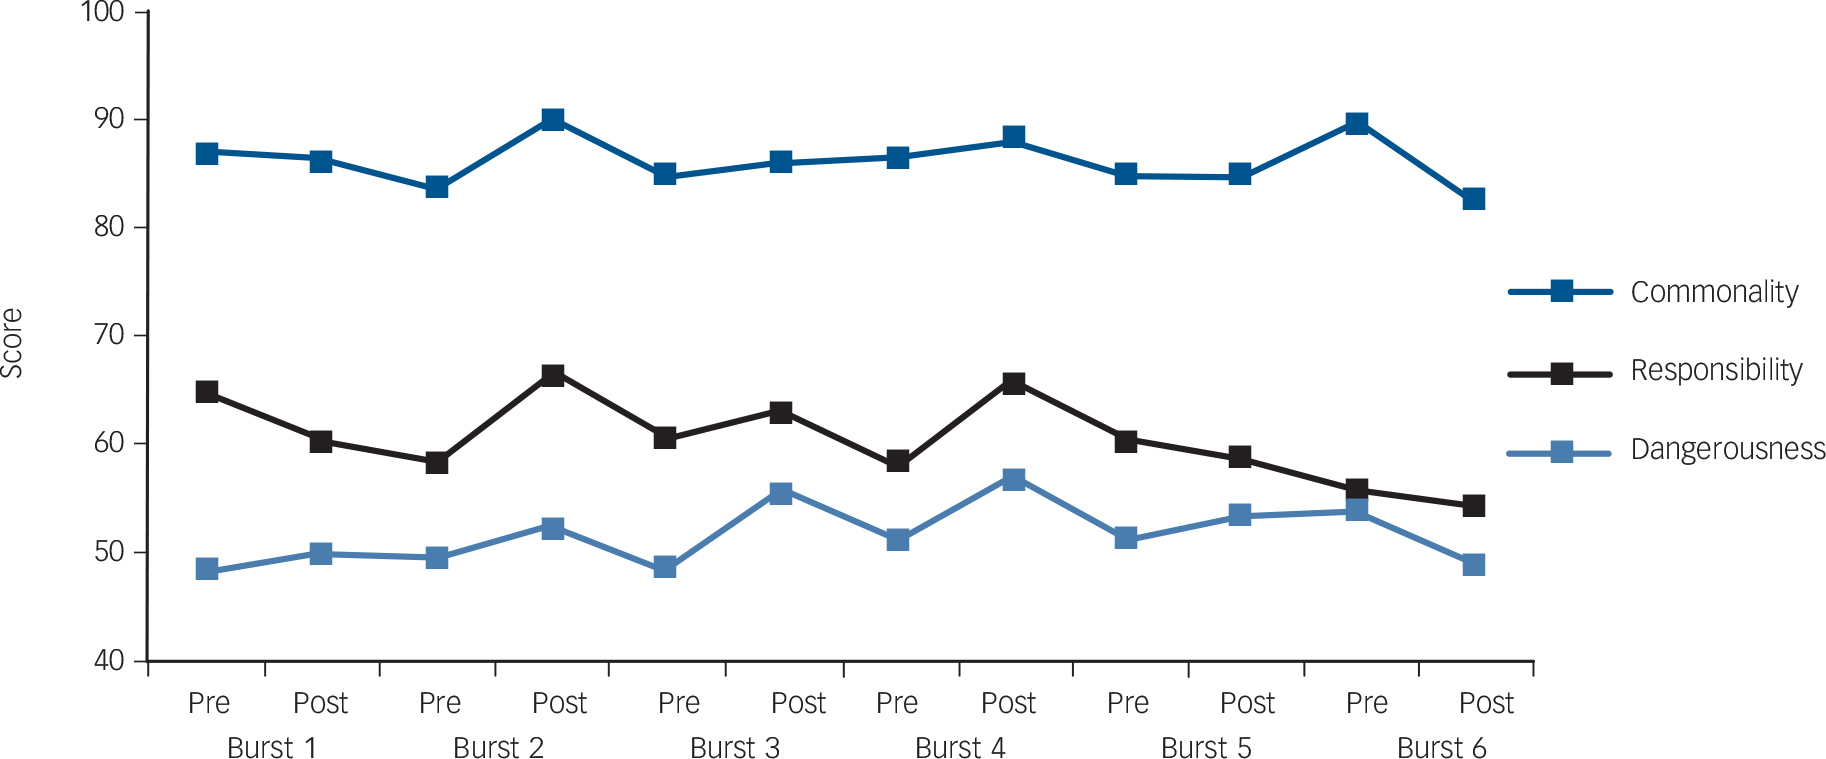
Trends in agreement with Community Attitudes toward the Mentally Ill items for total target population, January 2009 to August 2011. Multivariable regression models were fitted for each individual item and the overall slopes and P-values of the ‘trend’ line associated with each item are as follows: commonality slope 0.0, P = 0.61; responsibility −0.04, P = 0.06; dangerousness −0.001, P = 0.91. All items are coded so that higher scores indicate better knowledge.
Campaign awareness and total knowledge score
Table 2 presents the predictors of total knowledge score (MAKS items 1-6). Model 1(a) incorporates sampling weights only and model 2(a) incorporates inverse probability and sampling weights. For both models campaign awareness was a significant predictor of better knowledge. Other significant predictors of better knowledge included being of female gender, higher socioeconomic group and social proximity to people with mental health problems. Being of Asian ethnicity was associated with having a lower knowledge score in model 1(a) but not 2(a).
Predictors of total Mental Health Knowledge Schedule and Reported and Intended Behaviour Scale scores, January 2009 to September 2011 (n = 5615)Footnote a

| MAKS | RIBS | |||
|---|---|---|---|---|
| Model (1a) Sample weighting only Estimate (95% CI) |
Model 2(a) Inverse probability and sample weighting Estimate (95% CI) |
Model 1(b) Sample weighting only Estimate (95% CI) |
Model 2(b) Inverse probability and sample weighting Estimate (95% CI) |
|
| Campaign awareness | Footnote * 0.86 (0.52 to 1.19) | Footnote * 0.80 (0.52 to 1.08) | Footnote * 0.81 (0.59 to 1.02) | Footnote * 0.75 (0.53 to 0.96) |
| Burst (continuous) | –0.01 (–0.11 to 0.09) | 0.01 (–0.08 to 0.08) | 0.03 (–0.03 to 0.09) | 0.04 (–0.02 to 0.10) |
| Pre-post | 0.04 (–0.30 to 0.38) | –0.01 (–0.28 to 0.27) | –0.22 (–0.43 to −0.01) | –0.24 (–0.45 to −0.03) |
| Gender (ref. male) | Footnote * 0.62 (0.29 to 0.95) | Footnote * 0.66 (0.38 to 0.93) | 0.20 (–0.01 to 0.42) | 0.22 (0.01 to 0.43) |
| Socioeconomic group (ref. C2) | ||||
| B | Footnote * 0.52 (0.11 to 0.94) | Footnote * 0.49 (0.15 to 0.82) | Footnote * 0.27 (0.02 to 0.53) | Footnote * 0.26 (0.01 to 0.51) |
| C1 | 0.23 (–0.18 to 0.64) | 0.17 (–0.16 to 0.51) | 0.18 (–0.08 to 0.43) | 0.15 (–0.10 to 0.41) |
| Age (continuous) | 0.04 (–0.11 to 0.20) | 0.08 (–0.04 to 0.21) | Footnote * –0.21 (–0.31 to −0.12) | Footnote * –0.20 (–0.30 to −0.11) |
| Ethnic group (ref. White) | ||||
| Asian | Footnote * –0.43 (–0.81 to −0.04) | –0.42 (–1.02 to 0.18) | Footnote * –1.15 (–1.61 to −0.70) | Footnote * –1.16 (–1.62 to −0.70) |
| Black | –0.58 (–1.25 to 0.09) | –0.55 (–1.56 to 0.45) | Footnote * –0.95 (–1.72 to −0.18) | Footnote * –0.94 (–1.71 to −0.18) |
| Mixed | –0.52 (–1.30 to 0.25) | –0.59 (–1.75 to 0.57) | –0.08 (–0.98 to 0.81) | –0.11 (–1.00 to 0.77) |
| Other | –1.11 (–2.72 to 0.50) | –1.39 (–3.50 to 0.72) | Footnote * –1.57 (–3.19 to 0.05) | Footnote * –1.76 (–3.37 to −0.14) |
| Having children (ref. no children) | –0.10 (–0.47 to 0.27) | –0.15 (–0.45 to 0.16) | –0.20 (–0.44 to 0.03) | –0.22 (–0.46 to 0.01) |
| Married (ref. unmarried) | –0.05 (–0.45 to 0.36) | –0.01 (–0.35 to 0.33) | –0.09 (–0.35 to 0.17) | –0.06 (–0.33 to 0.20) |
| Employment status (ref. ‘not working’) | ||||
| Student | 1.43 (0.39 to 2.47) | 1.46 (0.09 to 2.82) | –0.30 (–1.35 to 0.75) | –0.24 (–1.28 to 0.81) |
| Working | 0.07 (–0.43 to 0.58) | 0.09 (–0.33 to 0.52) | 0.18 (–0.14 to 0.50) | 0.23 (–0.10 to 0.55) |
| London resident | 0.15 (–0.21 to 0.52) | 0.17 (–0.22 to 0.56) | Footnote * –0.51 (–0.81 to −0.21) | Footnote * –0.50 (–0.80 to −0.20) |
| Social proximity to mental illness (continuous) | Footnote * 0.60 (0.54 to 0.66) | Footnote * 0.59 (0.54 to 0.64) | Footnote * 0.44 (0.40 to 0.48) | Footnote * 0.44 (0.40 to 0.48) |
MAKS, Mental Health Knowledge Schedule; ref., reference; RIBS, Reported and Intended Behaviour Scale.
a. All items are coded so that higher scores indicate less stigmatising views.
* P<0.05.
Campaign awareness and attitudes
Table 3 presents the predictors of agreement to the three CAMI items (commonality, responsibility and dangerousness). All CAMI items were coded so that greater agreement summarised a less stigmatising response. Campaign awareness was a significant predictor of agreement (i.e. less stigmatising attitude) with the commonality and dangerousness items; however, there was no significant association with the responsibility item. Other significant predictors of agreement with the commonality item included female gender, older age and social proximity to mental health problems; other significant predictors of a less stigmatising response to the responsibility item included female gender, higher socioeconomic group and social contact with people with mental health problems. Being of Asian, Black or Other ethnicity and having children was associated with more stigmatising attitudes on all three items. Other significant predictors of a less stigmatising response to the dangerousness item included female gender, higher socioeconomic group, older age and social proximity to mental health problems.
Predictors of agreement with three items from the Community Attitudes toward the Mentally Ill scale, January 2009 to September 2011 (n = 5615)Footnote a

| Commonality | Responsibility | Dangerousness | ||||
|---|---|---|---|---|---|---|
| Sample weighting only OR (95% CI) |
Inverse probability and sample weighting OR (95% CI) |
Sample weighting only OR (95% CI) |
Inverse probability and sample weighting OR (95% CI) |
Sample weighting only OR (95% CI) |
Inverse probability and sample weighting OR (95% CI) |
|
| Campaign awareness | Footnote * 1.42 (1.15 to 1.75) | Footnote * 1.37 (1.10 to 1.70) | 1.14 (0.99 to 1.32) | 1.12 (0.97 to 1.30) | Footnote * 1.43 (1.24 to 1.64) | Footnote * 1.41 (1.22 to 1.63) |
| Burst (continuous) | 0.98 (0.93 to 1.04) | 0.99 (0.93 to 1.04) | 0.96 (0.92 to 1.00) | 0.96 (0.92 to 1.00) | 0.99 (0.96 to 1.04) | 0.99 (0.95 to 1.04) |
| Pre-post | 1.03 (0.84 to 1.25) | 0.97 (0.79 to 1.19) | 1.07 (0.92 to 1.23) | 1.05 (0.91 to 1.22) | 1.07 (0.93 to 1.23) | 1.07 (0.93 to 1.23) |
| Gender (ref. male) | Footnote * 1.50 (1.22 to 1.84) | Footnote * 1.49 (1.21 to 1.85) | Footnote * 1.68 (1.46 to 1.94) | Footnote * 1.71 (1.48 to 1.98) | Footnote * 1.21 (1.06 to 1.39) | Footnote * 1.21 (1.05 to 1.39) |
| Socioeconomic group (ref. C2) | ||||||
| B | 1.11 (0.87 to 1.43) | 1.07 (0.83 to 1.38) | Footnote * 1.45 (1.21 to 1.72) | Footnote * 1.46 (1.23 to 1.75) | Footnote * 1.23 (1.04 to 1.46) | Footnote * 1.21 (1.02 to 1.43) |
| C1 | 1.13 (0.88 to 1.43) | 1.08 (0.84 to 1.39) | Footnote * 1.25 (1.05 to 1.48) | Footnote * 1.24 (1.04 to 1.47) | 1.02 (0.87 to 1.21) | 1.01 (0.85 to 1.20) |
| Age (continuous) | Footnote * 1.19 (1.09 to 1.31) | Footnote * 1.20 (1.09 to 1.32) | 1.01 (0.95 to 1.08) | 1.01 (0.95 to 1.08) | Footnote * 1.10 (1.04 to 1.17) | Footnote * 1.11 (1.04 to 1.18) |
| Ethnic group (ref. White) | ||||||
| Asian | Footnote * 0.62 (0.50 to 0.76) | Footnote * 0.62 (0.50 to 0.77) | Footnote * 0.40 (0.34 to 0.46) | Footnote * 0.39 (0.33 to 0.46) | Footnote * 0.77 (0.66 to 0.90) | Footnote * 0.76 (0.65 to 0.90) |
| Black | Footnote * 0.58 (0.41 to 0.81) | Footnote * 0.59 (0.42 to 0.83) | Footnote * 0.77 (0.59 to 0.99) | Footnote * 0.74 (0.57 to 0.97) | Footnote * 0.54 (0.41 to 0.70) | Footnote * 0.54 (0.41 to 0.7) |
| Mixed | 1.11 (0.72 to 1.72) | 1.12 (0.71 to 1.77) | 1.25 (0.92 to 1.71) | 1.20 (0.86 to 1.66) | 0.83 (0.62 to 1.10) | 0.83 (0.62 to 1.10) |
| Other | 0.59 (0.32 to 1.08) | 0.57 (0.30 to 1.08) | Footnote * 0.55 (0.33 to 0.92) | Footnote * 0.53 (0.31 to 0.91) | 0.75 (0.45 to 1.23) | 0.76 (0.45 to 1.30) |
| Having children (ref. no children) | Footnote * 0.78 (0.62 to 0.98) | Footnote * 0.79 (0.63 to 0.99) | Footnote * 0.65 (0.56 to 0.76) | Footnote * 0.66 (0.56 to 0.77) | Footnote * 0.80 (0.69 to 0.93) | Footnote * 0.79 (0.68 to 0.92) |
| Married (ref. unmarried) | 0.91 (0.71 to 1.16) | 0.94 (0.74 to 1.20) | 1.02 (0.86 to 1.21) | 1.04 (0.88 to 1.25) | 1.03 (0.87 to 1.21) | 1.05 (0.89 to 1.24) |
| Employment status (ref. ‘not working’) | ||||||
| Student | 0.86 (0.34 to 2.16) | 0.88 (0.36 to 2.18) | 1.32 (0.68 to 2.56) | 1.41 (0.73 to 2.73) | 1.55 (0.84 to 2.88) | 1.54 (0.83 to 2.86) |
| Work | 0.83 (0.59 to 1.17) | 0.90 (0.63 to 1.29) | 0.86 (0.69 to 1.08) | 0.90 (0.72 to 1.13) | 1.01 (0.82 to 1.25) | 1.02 (0.82 to 1.26) |
| London resident | 0.95 (0.77 to 1.17) | 0.96 (0.78 to 1.19) | 0.87 (0.75 to 1.02) | 0.87 (0.74 to 1.01) | 1.15 (0.99 to 1.33) | 1.14 (0.98 to 1.33) |
| Proximity to mental illness (continuous) | Footnote * 1.20 (1.15 to 1.24) | Footnote * 1.19 (1.15 to 1.24) | Footnote * 1.13 (1.11 to 1.16) | Footnote * 1.13 (1.10 to 1.16) | Footnote * 1.14 (1.12 to 1.17) | Footnote * 1.14 (1.11 to 1.16) |
a. All items are coded so that higher scores indicate less stigmatising views.
* P<0.05.
Campaign awareness and intended behaviour
The predictors of total intended behaviour (RIBS) score are presented in Table 2. Model 1(b) incorporates sampling weights only and model 2(b) incorporates inverse probability and sampling weights. For both models campaign awareness was a significant predictor of better intended behaviour. Other significant predictors of better intended behaviour included higher socioeconomic group, younger age and social proximity to people with mental health problems. Being of Asian, Black or Other ethnicity relative to White ethnicity and living in London were associated with more negative intended behaviour.
Social contact component
In total 725 participants spoke to a volunteer before completing measures of contact duration, contact quality, disclosure, attitude change, campaign engagement and intended future behaviours. Of these 725 participants, 34% (n = 246) identified themselves as not having a mental health problem (75 men, 168 women (3 respondents did not indicate their gender); mean age 35.1 years, s.d. = 17.7); these participants were used in the analyses.
Impact of contact v. no contact
We first tested the impact of having contact with someone with a mental health problem by comparing participants who had experienced such contact with those who had not. This would allow us to determine what impact, if any, the contact had, regardless of its duration or quality. The results in Table 4 suggest a significant effect of contact on perceived attitude change and comfort in talking about one's own (hypothetical) mental health problems. Participants who had experienced contact were also more confident to challenge stigma compared with those who had not, although this difference was not significant at the 5% level (P = 0.1). We found no difference in intended future behaviour between participants who had experienced contact and those who had not.
Outcome variables according to contact

| ContactFootnote a | No contact | ||||||
|---|---|---|---|---|---|---|---|
| Mean (s.d.) | 95% CI | Mean (s.d.) | 95% CI | t | d.f. | P | |
| Attitude change | 2.67 (0.50) | 1.67 to 3.68 | 2.41 (0.53) | 1.35 to 3.49 | 3.30 | 211 | 0.001 |
| Disclosure | 3.37 (1.42) | 0.53 to 6.22 | 2.98 (1.53) | 0.08 to 6.04 | 1.72 | 208 | 0.086 |
| Confidence to challenge stigma | 3.14 (1.03) | 1.08 to 5.20 | 2.90 (0.95) | 1.01 to 4.80 | 1.65 | 229 | 0.100 |
| RIBS | 4.46 (0.71) | 3.03 to 5.88 | 4.55 (0.64) | 3.26 to 5.83 | 0.82 | 175 | 0.412 |
RIBS, Reported and Intended Behaviour Scale.
a. Participants who had experienced contact were compared with participants who had not: fluctuations in the numbers and degrees of freedom throughout the analyses arise because many participants did not complete all the measures.
Quality and quantity of contact
Using a single index of contact we found that contact predicted more positive attitude change (r = 0.33, P<0.01) and greater confidence to challenge mental health stigma (r = 0.38, P<0.01). Results did not reach conventional levels of significance for contact predicting willingness to talk about one's own mental health problems (r = 0.20, P = 0.10) and failed to predict reported intended behaviours (r = 0.06, P = 0.64). In our mediation model (Fig. 5) the indirect effect of contact on confidence to challenge stigma through attitudes was not zero, according to a 90% bias-corrected bootstrap confidence interval based on 5000 bootstrap samples (0.007 to 0.125, with a point estimate of 0.053). The paths from contact to attitudes (a = 0.13, P = 0.003) and attitudes to confidence to challenge stigma controlling for contact (b = 0.41, P = 0.07) were also not zero. The direct path from contact to confidence to challenge stigma was significant (c = 0.18, P = 0.02) and the product of a, b and c was positive (0.13×0.41×0.18 = 0.010) indicating complementary mediation. Reference Zhao, Lynch and Chen27
Mediational model of the role of attitudes in explaining the effects of contact on confidence to challenge stigma.

Discussion
The evaluation of the Time to Change social marketing campaign provides support for modest but positive and significant improvements associated with the campaign, especially in relation to intended behaviour. Although there was no consistent improvement in knowledge or attitudes at the whole population level, awareness of the campaign was consistently associated with better knowledge, attitudes and intended behaviour. This was true when controlling for potential confounders such as knowing someone with a mental health problem, which in addition to being associated with better outcomes might have made the campaign more salient. Additionally, the association between positive intergroup contact, achieved through TTC social contact events, and improved attitudes and willingness to challenge stigma and discrimination suggests that social contact can be used by anti-stigma programmes to reduce stigma and discrimination against people with mental health problems.
In terms of overall effects on the target population, the mass media component of the social marketing campaign seemed to be most effective at influencing intended behaviour. Several items indicated pre-post improvements over several bursts; however, the RIBS ‘live with’ item was the only one that showed significant longitudinal improvements among the total target population that were sustained over the entire campaign period. A low baseline agreement with the item might have allowed for more substantial growth over time compared with other items. For instance, agreement with other domains (e.g. ‘continue a relationship with’) may have shown less change owing to a ceiling effect. Agreeing to live with someone with a mental health problem, however, is also a highly active and personal behaviour which would suggest that change would be difficult to achieve. It is possible that the change associated with this item was influenced by the campaign's focus on behaviour change and emphasis on involvement with the public in ‘calls to action’. On average, knowledge about psychotherapy's effectiveness improved from pre- to post-campaign burst, yet over the study's entire length the same knowledge decreased. We could speculate that this pattern of transitory improvement plus long-term deterioration is consistent with TTC's short-term effectiveness. However, the positive effects may not have outweighed larger negative trends of societal attitudes, possibly shaped by other forces such as the worsening economic climate during the past years. If supported by other findings, this pattern calls for more intense and prolonged interventions to achieve long-term improvements.
Time to Change is the first anti-stigma programme to include an explicit target to change behaviour. This is in contrast to previous campaigns, which focused more on attitude change and improved awareness about mental health problems. Reference Sartorius30 The more recent focus on behaviour change may be in response to research which suggests that greater awareness of mental illness does not necessarily translate to improved attitudes and behaviours towards people with mental illness. For instance, recent longitudinal reviews have demonstrated an increase in mental health literacy alongside a stable or increasing trend for social distance from people with major depression or schizophrenia. Reference Angermeyer, Holzinger and Matschinger31-Reference Schomerus, Schwahn, Holzinger, Corrigan, Grabe and Carta33 Therefore, the decreased desire for social distance alongside unchanged knowledge levels during the TTC campaign is noteworthy and supports findings that improvements in knowledge may not be necessary or sufficient to ensure behaviour change.
Campaign awareness and social contact were the most consistent positive predictors of better knowledge, attitudes and intended behaviour towards people with mental illness. Incorporating inverse propensity weighting into the regression models slightly attenuated the effects of campaign awareness; however, the association between campaign awareness and knowledge, attitudes and behaviour remained significant. Although both factors demonstrated consistent positive associations, social contact had the greatest influence on mental health-related knowledge, attitudes and behaviour and continued to improve as the level of contact increased. We know from a large body of research that social contact is one of the most effective strategies for improving intergroup relations, Reference Allport19,Reference Pettigrew and Tropp20,Reference Corrigan, River, Lundin, Penn, Uphoff-Wasowski and Campion34,Reference Corrigan, Morris, Michaels, Rafacz and Rusch35 and benefits from the social contact events were likely to augment the effects of the campaign. Calls to action and engagement of the public, for instance by social contact events, might work synergistically with mass media to reduce stigma and discrimination against people with mental health problems. There is a body of evidence that interventions that contain personal information about individuals with mental health problems, and give participants the opportunity to have a discussion while evoking empathy, are more likely to succeed. Reference Mann and Himelein36 A strength of the TTC social contact events is that they not only facilitated social contact but also provided educational resources on mental health in the form of leaflets. It is likely that combining educational information with a social contact intervention might lead to greater reductions in mental health stigma than education alone, Reference Chan, Mak and Law37 and that engaging the public through events may promote changes in behaviour such as challenging stigma and discrimination.
Previous research has shown that anxiety mediates the relationship between contact and prejudice, Reference Voci and Hewstone25,Reference West and Hewstone26 In this study we attempted to explicate the mechanism that underlies the relationship between contact and confidence to challenge stigma by using attitudes as a mediator variable. There have been several studies that have found anxiety to be a predictor of attitudes, Reference Voci and Hewstone25,Reference West and Hewstone26 and also associated with motivation to respond without prejudice, Reference Plant and Devine38 therefore attitudes are a relevant alternative mediator variable to anxiety. Our study found that attitude change mediated the relationship between contact and confidence to challenge stigma and discrimination. This is intuitive, because for contact to potentially affect behaviours, attitudes need to be changed first.
Strengths and limitations of the study
To our knowledge this is the first evaluation of a national anti-stigma social marketing campaign concurrently examining associated trends in public knowledge, attitudes and intended behaviour in relation to mental illness. The evaluation involved careful definition of the method of delivery, communication messages and target groups in relation to impact. Although this study contributes new and important information that can inform the planning of future anti-stigma social marketing campaigns, there are limitations that should be considered. Although the sampling methods ensured equality of the target characteristics (gender, age, socioeconomic group and geographic region) across time points for individuals completing the online survey, different individuals were interviewed at each time point. This diminishes the potential of an effect resulting from repeating the interview; however, we cannot be certain that differences in attitudes were not due to sampling characteristics. Our assessment of campaign awareness included a detailed questioning process to assess prompted and unprompted campaign awareness for each type of media, but we could only assess reported campaign awareness and not actual awareness. Because we did not include a control group in our evaluation we cannot be certain what would have happened without any campaign activity. It would be difficult to include an adequate control at the country level owing to differences in sociopolitical context; however, performing surveys immediately before and after campaign activity and including a detailed assessment of campaign awareness allows us to better attribute changes to campaign activity. Additionally, incorporation of inverse probability weighting techniques in the regression models provided rigour when estimating the causal effect of campaign awareness on knowledge, attitude and behaviour outcomes. Moreover, pre-post improvements around each burst of activity suggest that changes can be attributed to the campaign. There were also methodological limitations associated with the evaluation of the social contact events, including low response rate and missing data. Although tens of thousands of people attended social contact events, only a few dozen people had the task of asking attendees to complete a questionnaire. Another methodological limitation is the absence of a follow-up and pre-intervention measure. A pre-intervention measure would have allowed us to control for attitudes before the intervention and follow-up data would have allowed us to determine sustained change over time.
Although our measure of intended behaviour does not capture actual behaviour, the RIBS incorporates domains that are significant to the personal lives of people with mental health problems and assesses experiences that are common among the general public. Including a wide range of measures that captured the domains of knowledge, attitudes and behaviour was a strength as it allowed for a multifaceted assessment of stigma. 4,Reference Link and Phelan39 Moreover, these findings are significant as other research suggests that public attitudes and behaviour have a clear association with the views of people with mental illness regarding their illness, expectations of discrimination and self-efficacy, Reference Evans-Lacko, Brohan, Mojtabai and Thornicroft40 in addition to facilitating help-seeking and disclosure among the public. Reference Schomerus, Matschinger and Angermeyer41,Reference Rusch, Evans-Lacko, Henderson, Flach and Thornicroft42 Nevertheless, further efforts are needed to inform changes at service user level in reported stigma and discrimination as a response to anti-stigma campaigns. Although the campaign messages did not focus on one specific illness, more information about the influence of the campaign on knowledge, attitudes and behaviour in relation to specific mental illnesses could inform whether the campaign was more or less effective in reducing stigma about certain types of mental illnesses. Reference West, Hewstone and Holmes43 The second set of MAKS items showed improvement in knowledge of mental illness conditions. Responses suggested that over time, the public was slightly less likely to consider non-psychiatric conditions such as grief or stress to be mental illnesses. Reference Rusch, Evans-Lacko and Thornicroft44 To keep the survey brief, however, in other items we enquired only about mental health problems generally.
Finally, although we oversampled BME populations at each time point, sample sizes among some BME subgroups were small. The evaluation suggests that the campaign reached diverse groups with higher campaign awareness among BME groups in four of the six bursts. Interestingly, although BME respondents tended to have greater campaign awareness, they also tended to respond more negatively to the attitude and intended behaviour questions compared with White respondents. Because experiences and perceptions of discrimination may vary by ethnic group or community, it is important to understand the influence of the campaign on subgroups. Reference Knifton, Gervais, Newbigging, Mirza, Quinn and Wilson45,Reference Shefer, Rose, Nellums, Thornicroft, Henderson and Evans-Lacko46
Implications
Over the short term the social marketing component of the TTC campaign demonstrated important population-level gains in intended behaviour with respect to living with someone with a mental illness. Although the trends associated with knowledge and attitudes were mixed, campaign awareness was associated with better knowledge, attitudes and intended behaviour. It is important to note that this impact was possible and sustained without positive antecedent changes in public knowledge or attitudes, and was achieved despite the developing economic downturn and previous evidence that such public attitudes in England were deteriorating before the start of TTC. Reference Mehta, Kassam, Leese, Butler and Thornicroft7 It is likely that better knowledge and attitudes provide a more supportive environment associated with less stigmatising behaviours, and campaigns should incorporate a multifaceted approach towards reducing stigma and discrimination. It is important to identify the messages, delivery and context when considering these improvements as they may not generalise to all anti-stigma social marketing campaigns. Therefore, it is important to consider improvements in relation to a specific message or activity. Reference Clement, Lassman, Barley, Evans-Lacko, Williams and Pagdin47,Reference Clement, Jarrett, Henderson and Thornicroft48
Future research should examine mechanisms through which social contact could be facilitated by social marketing, in addition to improving understanding of how changes in public knowledge, attitudes and behaviour among the general public influence perceptions and experiences of stigma and discrimination of people using mental health services, and how far, for example, filmed personal disclosure by people with mental health problems has a positive impact. Reference Clement, van Nieuwenhuizen, Kassam, Flach, Lazarus and de Castro49 The mass media component and the associated mass-participation social contact events probably worked together; the social contact events are likely to have contributed to the effectiveness of the wider TTC programme, and the associations with positive social contact suggest that they should be an integral part of anti-stigma campaigns. Reference Chan, Mak and Law37 Further research is needed to understand how to optimise resources and create synergies across multiple interventions and also to understand how initiatives might be integrated across communities locally and nationally to lead to the greatest population impact. Finally, maintenance of these changes should be monitored over time as it is likely that long-term investment is needed to achieve population changes. Reference Wakefield, Loken and Hornik50
Funding
The study was funded by the Big Lottery Fund and Comic Relief. G.T. is funded in relation to a National Institute for Health Research (NIHR) Applied Programme grant awarded to the South London and Maudsley National Health Service (NHS) Foundation Trust. G.T. and D.R. are funded in relation to the NIHR Specialist Mental Health Biomedical Research Centre at the Institute of Psychiatry, King's College London and the South London and Maudsley NHS Foundation Trust. C.H. and S.E.L. are supported by a grant to Time To Change from Big Lottery and Comic Relief. C.H. is funded by a NIHR Applied Programme grant awarded to the South London and Maudsley NHS Foundation Trust and a grant from Guy's and St Thomas' Charity.##
Acknowledgements
We are grateful for the comments and feedback provided by our statistical consultants, Clare Flach and Morven Leese, and to Bruce Link for his comments on an earlier draft of this article. We thank Sue Baker, Maggie Gibbons, Paul Farmer, Paul Corry, Katherine Crawshaw and Sarah Cohen for their collaboration on the evaluation. We would also like to thank Consumer Insight for their assistance with data collection.


 Open access
eLetters
No eLetters have been published for this article.