


1. Introduction
Human height is a classical model ‘complex’ trait in genetics research. It has a continuous near-normal distribution and shows strong familial resemblance. In other species, the correlation between relatives for height is also large and related phenotypes such as body size show strong response to artificial selection. For example, the enormous variation in sizes among dog breeds or the difference in size between broiler and layer chickens are the result of artificial selection in relatively short periods of time in terms of the number of generations. There are also strong environmental influences on height, as evidenced, for example, by the secular rise in average height in industrialized nations. Height in humans is easily measured and self-reports through questionnaire data or telephone interviews are highly accurate (Macgregor et al., Reference Macgregor, Cornes, Martin and Visscher2006). Height is often measured as part of medical disease studies, facilitating very large sample sizes for genetic studies. One could argue that height in humans is the equivalent of bristle number in Drosophila, in terms of its role as a model phenotype.
In the short review, we attempt to summarize what we have learned about the genetic architecture (here defined as the number of genes influencing height, their allelic spectrum, effect sizes and mode of gene action within and between loci) of height after more than a century of research.
2. Resemblance between relatives
Francis Galton was probably the first researcher who was interested in the resemblance between relatives for human height (he was also interested in intelligence and many other things), in particular, in quantifying such resemblance (Galton, Reference Galton1886a, Reference Galtonb). Galton observed a regression of progeny height towards the mean in the population ‘The deviates of the children are to those of their mid-parents as 2 to 3’ (Galton, Reference Galton1886b). In today's terms and interpretation, he estimated a heritability of two-third from the regression of offspring phenotype on the mid-parental value. Galton and others thought that the resemblance between relatives for a quantitative trait such as height indicated a discovered law of inheritance. Following the rediscovery of Mendel's work in 1901, these laws were thought to be different from those for discrete (Mendelian) traits; as for example; the title ‘On the Laws of Inheritance in Man: I. Inheritance of Physical Characters’ (Pearson & Lee, Reference Pearson and Lee1903) suggests. It was not until the classic paper by R.A. Fisher that the apparent difference in laws of inheritance between Mendelian characters and continuous traits was resolved (Fisher, Reference Fisher1918). The phenotypic correlation between first-degree relatives was first estimated about half a century ago (Figs 1 and 2) and has not changed much since then. The correlation of monozygotic (MZ) twin pairs, whether raised together or apart is about 0·8–0·9 (Bouchard et al., Reference Bouchard, Lykken, McGue, Segal and Tellegen1990; Eaves et al., Reference Eaves, Heath, Martin, Neale, Meyer, Silberg, Corey, Truett, Walters and Cloninger1999; Silventoinen et al., Reference Silventoinen, Sammalisto, Perola, Boomsma, Cornes and Davis2003; Macgregor et al., Reference Macgregor, Cornes, Martin and Visscher2006; Visscher et al., Reference Visscher, Hill and Wray2008). The correlation of first-degree relatives is about one-half of that of MZ twins and these observations have led to the commonly held view that height is a classic example of a quantitative trait with large narrow-sense heritability. From modelling the correlation of twin pairs, full-sibs and parents and progeny there appears to be little or no evidence for dominance or epistatic genetic variation. So far so good. But if we look at more distant relatives the picture becomes more complicated. Second- and third-degree relatives are more similar than predicted from a simple additive model and a narrow-sense heritability of 0·8. For example, the phenotypic correlation of cousins is about 0·2, whereas 0·1 is predicted (Fig. 1). Fisher already noted these discrepancies from the simple additive model (Fisher, Reference Fisher1918). At the extreme end is the correlation between (unrelated) spouses, which is approximately 0·2–0·3 for height.
Plots of phenotypic correlations between close relatives against their expected genetic relationships in four different studies: Pearson & Lee (Pearson & Lee, Reference Pearson and Lee1903), Virginia: (Eaves et al., Reference Eaves, Heath, Martin, Neale, Meyer, Silberg, Corey, Truett, Walters and Cloninger1999), FHM: (Kannel et al., Reference Kannel, Dawber, Kagan, Revotskie and Stokes1961, Reference Kannel, Feinleib, McNamara, Garrison and Castelli1979; Splansky et al., Reference Splansky, Corey, Yang, Atwood, Cupples and Benjamin2007) and Liu et al. (Liu et al., Reference Liu, Xiao, Guo, Xiong, Zhao and Shen2006). The red solid line shows the regression of the observed phenotypic correlation on the expected genetic relationship with the slope indicating an estimate of heritability. The blue dotted line is the regression line with a slope of 0·8 and no intercept.

Phenotypic correlations between parent–offspring, siblings, DZ twins and MZ avuncular (MZ twin with the offspring of his/her co-twin) in four different studies: Pearson & Lee (Pearson & Lee, Reference Pearson and Lee1903), Virginia: (Cloninger, 1999), FHM: (Kannel et al., Reference Kannel, Dawber, Kagan, Revotskie and Stokes1961, Reference Kannel, Feinleib, McNamara, Garrison and Castelli1979; Splansky et al., Reference Splansky, Corey, Yang, Atwood, Cupples and Benjamin2007) and Liu et al. (Liu et al., Reference Liu, Xiao, Guo, Xiong, Zhao and Shen2006).
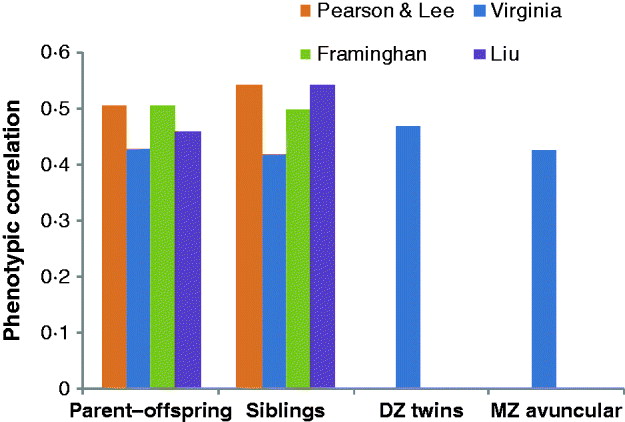
Relative to random mating, assortative mating increases the correlation between relatives. Lynch & Walsh (Reference Lynch and Walsh1998) used the Pearson & Lee (Reference Pearson and Lee1903) correlations between first-degree relatives and estimated a narrow-sense heritability under random mating of ~0·62. The expected phenotypic correlation of first cousins and second cousins is (1/8)(1+rh 2)3 and (1/32)(1+rh 2)5, respectively (Lynch & Walsh, Reference Lynch and Walsh1998), with r the phenotypic correlation between spouses and h 2 the narrow-sense equilibrium heritability after many generations of assortative mating. For r=0·2 and h 2=0·8, the expected correlations of first cousins and second cousins are therefore 0·195 and 0·066, respectively. However, these calculations assume that individuals choose mates based on phenotypic similarity (and solely on height). In humans, things are likely to be more complicated in that mate choice may be within socio-economic strata which may differ in mean phenotype. Therefore, assortative mating in humans may be partly due to the environment (Falconer & Mackay, Reference Falconer and Mackay1996). ‘Social homogamy’ as a model for the resemblance between spouses refers to assortment and cultural transmission based on correlated unobserved random non-genetic effects (Morton, Reference Morton1974). The observed phenotypic correlation of ~0·2 between the two spouses of MZ pairs (Eaves et al., Reference Eaves, Heath, Martin, Neale, Meyer, Silberg, Corey, Truett, Walters and Cloninger1999) shows that the simple model of phenotypic assortment is not consistent with these data – we would expect their correlation to be r 2h 2≈0·22×0·8=0·032. Yet, the spouses of DZ pairs had a lower correlation of ~0·1 (Eaves et al., Reference Eaves, Heath, Martin, Neale, Meyer, Silberg, Corey, Truett, Walters and Cloninger1999). Therefore, the high correlation of distant relatives is likely to be due to a combination of assortative mating and social homogamy.
3. Major mutations/single genes
There are a number of identified genes and specific mutations within them that cause considerable decreases or increases in height. Dominant mutations in the fibroblast growth factor receptor gene 3 (FGFR3) cause dwarfism (Velinov et al., Reference Velinov, Slaugenhaupt, Stoilov, Scott, Gusella and Tsipouras1994). These mutations are rare, with a frequency of between 1/10 000 and ~1/100 000. Marfan syndrome is caused by dominant mutations in the gene FBN1 that affect connective tissue. There is a range of phenotypes for carriers of a mutation, including being taller than average by about 10 cm (Lee et al., Reference Lee, Godfrey, Vitale, Hori, Mattei and Sarfarazi1991). A mutation in the orthologue of the human HMGA2 gene is responsible for the pygmy mutant mouse (Zhou et al., Reference Zhou, Benson, Ashar and Chada1995). Interestingly, a disruption of this gene in humans causes severe overgrowth (Ligon et al., Reference Ligon, Moore, Parisi, Mealiffe, Harris and Ferguson2005) and common single nucleotide polymorphisms (SNPs) in the gene are associated with small additive effects (~4 mm) (Weedon et al., Reference Weedon, Lettre, Freathy, Lindgren, Voight and Perry2007). Therefore, mutations in the same gene can cause dwarfism, giantism and subtle ‘normal’ variation.
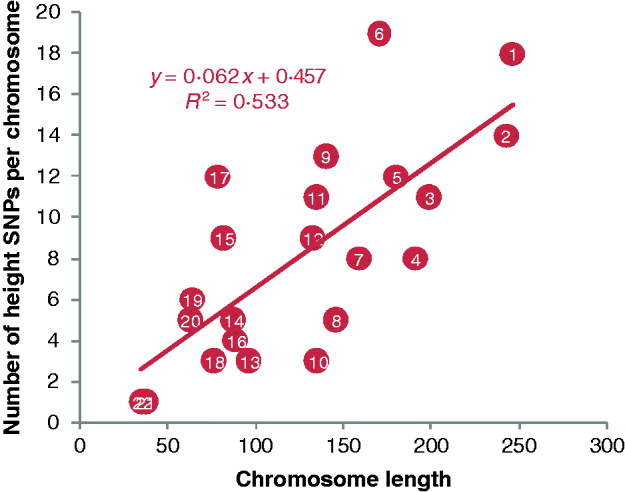
Plot of the number of height SNPs on each chromosome against chromosome length. A total of 180 height SNPs were discovered by a meta-analysis of GWAS with 183 727 individuals of European ancestry by the GIANT consortium (Lango Allen et al., Reference Lango Allen, Estrada, Lettre, Berndt, Weedon and Rivadeneira2010).
While there are numerous single-gene (monogenic) conditions that profoundly affect height (Weedon & Frayling, Reference Weedon and Frayling2008), the mutations behind them are too rare to explain much variation in the population. This does not exclude the existence of further rare mutations or low-frequency polymorphisms of large effects that contribute to variation in height.
4. Linkage analyses
Linkage analyses for rare disorders that have a large effect on height have been successful in finding causative mutations, including those for Marfan syndrome (Kainulainen et al., Reference Kainulainen, Pulkkinen, Savolainen, Kaitila and Peltonen1990) and achondroplasia (Lee et al., Reference Lee, Godfrey, Vitale, Hori, Mattei and Sarfarazi1991). Linkage analyses to find these rare mutations are not based on normal variation in height in the population but on segregating disease phenotypes in pedigrees. Linkage analyses for height itself in small or extended pedigrees have produced many ‘significant’ LOD scores (Hirschhorn et al., Reference Hirschhorn, Lindgren, Daly, Kirby, Schaffner and Burtt2001) but have not resulted in the identification of segregating variants that explain the observed linkage signals. This is not just for human height but also for many other complex traits in human populations, including disease.
Linkage analysis can also be conducted in an estimation rather than hypothesis testing framework, by correlating genome-wide (or chromosome-wide) identity by descent with phenotypic similarity (Goldgar, Reference Goldgar1990; Visscher et al., Reference Visscher, Medland, Ferreira, Morley, Zhu and Cornes2006, Reference Visscher, Macgregor, Benyamin, Zhu, Gordon and Medland2007). An application to height using full-sib pairs and microsatellite markers showed that the estimate of narrow-sense heritability from this approach was very similar to estimates from traditional twin and family studies, and allowed the partitioning of additive genetic variation across chromosomes (Visscher et al., Reference Visscher, Medland, Ferreira, Morley, Zhu and Cornes2006, Reference Visscher, Macgregor, Benyamin, Zhu, Gordon and Medland2007).
It is interesting to speculate why quantitative trait loci (QTLs) mapping has not been successful in discovering genes that affect height in the light of results of recent genome-wide association studies. It is likely that many reported significant linkage findings are false positives, due to multiple and post-hoc testing of many hypotheses. However, it seems unlikely that all reported linkage results are false positives. When we estimated genetic variation per chromosome in an unbiased manner and correlated the estimates with the number of reported QTL per chromosome, we found a significant correlation, also after conditioning on the length of the chromosome (Visscher et al., Reference Visscher, Macgregor, Benyamin, Zhu, Gordon and Medland2007). It is possible that QTLs harbour multiple low-frequency variants with large effect that are not detected in association scans but can be detected using linkage analysis. Alternatively, QTL can consist of many more common variants of small effects (in principle, detectable by association analysis) that cause between-chromosome variation in the population (Dekkers & Dentine, Reference Dekkers and Dentine1991; Visscher & Haley, Reference Visscher and Haley1996). Even though these variants of small effect size may be in linkage equilibrium in the population, within a family they are in LD and the contribution of all variants in a large chromosomal region (say, 20 Mb) can be detected by linkage. In principle, this hypothesis that linkage analysis findings can be explained by a concentration of many causal variants of small effects can be tested by having genome-wide association study (GWAS) or sequence data on closely related individuals. Then variation within and between families can be partitioned simultaneously. Regions with multiple low-frequency variants of large effect that are segregating in the population would show up as explaining a lot of variation within families but little between-family variation.
5. Genome-wide association studies
Despite the previous findings of rare mutations that cause extreme short and tall people and numerous linkage peaks that cover a large fraction of the genome, no genes or gene variants had been found that contribute to normal variation of height in the population. GWAS is designed to test for associations between SNPs and a trait in a hypothesis-free genome scan. GWAS were facilitated by the HapMap project (The International HapMap Consortium, 2005) which catalogued human common genetic variants and by the development commercial SNP chips that can rapidly genotype hundreds of thousands of SNP loci. The first two GWASs for height identified two common SNPs at genes HMGA2 (Weedon et al., Reference Weedon, Lettre, Freathy, Lindgren, Voight and Perry2007) and GDF5-UQCC (Sanna et al., Reference Sanna, Jackson, Nagaraja, Willer, Chen and Bonnycastle2008). The allelic effects of the two SNPs are ~4 mm and their allele frequencies (p) are approximately 0·5 and 0·4, respectively. Assuming Hardy–Weinberg proportions of genotypes, the variance contributed by an SNP is 2p(1−p)a 2, where a is the additive effect size (Falconer & Mackay, Reference Falconer and Mackay1996). An effect of 4 mm is 4/70=0·057 phenotypic standard deviations (SD), and so these two SNPs contribute 2×0·5×0·5×0·0572 and 2×0·4×0·6×0·0572, respectively, or ~0·2% each of the phenotypic variance for height in the general population. Subsequently, three GWAS with much larger sample size confirmed the SNPs at HMGA2 and GDF5-UQCC loci and identified an additional 42 SNPs to be associated with height (Gudbjartsson et al., Reference Gudbjartsson, Walters, Thorleifsson, Stefansson, Halldorsson and Zusmanovich2008; Lettre et al., Reference Lettre, Jackson, Gieger, Schumacher, Berndt and Sanna2008; Weedon & Frayling, Reference Weedon and Frayling2008; Weedon et al., Reference Weedon, Lango, Lindgren, Wallace, Evans and Mangino2008). On one hand, more than half of the 44 SNPs are in the vicinity of genes with plausible function and/or involved in biological pathways related to skeletal growth and development (Weedon & Frayling, Reference Weedon and Frayling2008), which provide great insight into the molecular mechanism of human growth. On the other hand, however, the effect sizes are very small, ranging from 1 to 4 mm or approximately 0·01–0·06 phenotypic SD, assuming a SD for height of 70 mm, and in total, they only explain ~5% of height phenotypic variation. Of these 44 loci, only four were identified by all of these three GWAS, only seven were identified by at least two studies and the remaining 33 were implicated by one study alone. Because the power to detect such small effects is typically low, e.g. the power to detect an SNP that explains 0·2% of the phenotypic variance was ~30% with a sample size of 10 000 (Visscher, Reference Visscher2008), it is often expected that an SNP appears to be genome-wide significant in one study but not in another study. A much larger sample size is required to detect new height SNPs with similar or smaller effects. The recent meta-analysis of 46 GWAS with an initial discovery set of 133 653 individuals and a follow-up replication set of 50 074 samples by the GIANT consortium identified 180 SNPs (Fig. 3) including the previous 44 SNPs (Lango Allen et al., Reference Lango Allen, Estrada, Lettre, Berndt, Weedon and Rivadeneira2010). These SNPs in total explain ~10% of the height variation, suggesting that the additional 135 SNPs only explain an extra ~5% of the variation. Using an approach developed by Park et al. (Reference Park, Wacholder, Gail, Peters, Jacobs and Chanock2010), Lango Allen et al. (Reference Lango Allen, Estrada, Lettre, Berndt, Weedon and Rivadeneira2010) estimated that ~700 SNPs with effects equal to or larger than those identified, which in total would explain ~16% of the phenotypic variance of height and a sample size of 500 000 is required to declare 99·6% of these loci as genome-wide significant.
Considering GWAS and meta-analysis with such large sample being conducted, we have only explained 1/8th of the heritability of height; where is the remaining heritability? This question is relevant not only for height but also for most other complex traits and diseases such as Type 2 diabetes, schizophrenia, obesity and cardiovascular diseases (Manolio et al., Reference Manolio, Collins, Cox, Goldstein, Hindorff and Hunter2009). Explanations such as gene–gene and gene interaction are not relevant to this problem because the narrow-sense heritability by its definition is the phenotypic variance explained by additive genetic variation. The main debate is between ‘rare variants or structural DNA variation that are not (well) tagged by common SNPs’ and ‘a large number of variants with small effects’. We recently proposed and applied a method to accumulate the effects of all the common SNPs and estimated that ~45% of the phenotypic variance of height can be explained by considering all the common SNPs together (Yang et al., Reference Yang, Benyamin, McEvoy, Gordon, Henders and Nyholt2010). We argued that half of the heritability for height that has not been explained by single-SNP association studies is hiding rather than missing (Gibson, Reference Gibson2010). The reason why GWAS are unable to explain this amount of genetic variation is because the effect sizes of individual SNPs are too small to pass the stringent genome-wide significant level and because of the imperfect LD between common SNPs and causal variants, especially when the minor allele frequencies (MAF) of causal variants tend to be low. More details about the methods and implications of Yang et al. (Reference Yang, Benyamin, McEvoy, Gordon, Henders and Nyholt2010) can be found in Visscher et al. (Reference Visscher, Yang and Goddard2010).
6. Non-additive variation
The resemblance between relatives for height, in particular for close relatives, suggests that most or all similarity is due to genetic factors and that most or all genetic variation is additive. The latter is consistent with theoretical expectations (Hill et al., Reference Hill, Goddard and Visscher2008). Eaves et al. (Reference Eaves, Heath, Martin, Neale, Meyer, Silberg, Corey, Truett, Walters and Cloninger1999) used an extended twin design (twins and their spouses, parents, siblings and offspring) and a total of ~30 000 individuals with multiple phenotypes, including height. They had 80 different kinds of relationships and estimated multiple variance components by fitting and selecting models. These authors concluded that ~56% of variance was due to additive genetic effects, ~16% due to assortment and ~9% due to dominance (and other non-additive effects).
Most rare (Mendelian) mutations affecting height appear to be fully dominant or recessive. Pairwise interaction tests between validated SNPs from GWAS suggest no interaction, but those SNPs were ascertained because they show strong additive effects and the statistical power to detect additive by additive epistasis is extremely low. From genome-wide-realized additive and dominance coefficients of relationship we estimated dominance variance (Visscher et al., Reference Visscher, Medland, Ferreira, Morley, Zhu and Cornes2006, Reference Visscher, Macgregor, Benyamin, Zhu, Gordon and Medland2007). It was not significantly different from zero but the power of detection was low because the additive and dominance relationships were highly correlated (~0·9).
Therefore, theory and empirical data do not support a large role for non-additive variation for height. However, the power to detect dominance variance in all experimental designs employed to date (resemblance between relatives, linkage and GWAS) has been low and we know from molecular biology that interactions at the cellular level are ubiquitous. With ever-increasing sample sizes it will become feasible to get more accurate estimates of dominance and epistatic variance. Nevertheless, if the inference that the narrow-sense heritability of human height is ~80% is correct then there is not much room for non-additive variation.
7. Prediction
The height of offspring can be predicted from those of their mid-parents with a precision of r 2≈40% (Galton, Reference Galton1886b; Aulchenko et al., Reference Aulchenko, Struchalin, Belonogova, Axenovich, Weedon and Hofman2009). The precision of this prediction follows directly from quantitative genetic theory (Falconer & Mackay, Reference Falconer and Mackay1996) and depends only on the observed phenotypic correlation between parents and progeny. Strictly speaking this is not necessarily a genetic prediction because even if the parent–offspring resemblance was due to environmental factors the prediction would hold. Here the prediction precision is defined as the proportion of variance in offspring height that is explained by the predictor (mid-parent value), i.e. the square of the correlation between predicted heights and actual observations. Note that this definition is different from the one used in livestock genetics, where the correlation between true and predicted breeding value is commonly used. This definition, called ‘accuracy of prediction’, is more logical because the best one can do with a genetic prediction is to have a correlation of unity between the predicted and the actual genetic value. The correlation between the genetic predictor and phenotype has an upper limit that depends on the heritability of the trait (see e.g.Wray et al. (Reference Wray, Yang, Goddard and Visscher2010) for relevant theory when the phenotype is disease status). The expected correlation between the phenotype and predictor from close relatives (one with a phenotype, the other to be predicted) is r=aijh 2 based on a simple additive model, where aij is the additive genetic relationship (numerator relationship or twice the kinship coefficient) between relatives, e.g. aij=1/2 for parent–offspring or siblings. The prediction precision for MZ twins is r 2=h 4, which forms the upper boundary of the prediction accuracy from individual observations on relatives. With genome-wide SNP data, we are able to predict height between ‘unrelated’ people, and the prediction accuracy depends on the number of underlying causal variants that affect height and the accuracy of the estimates of SNP effects (Goddard et al., Reference Goddard, Wray, Verbyla and Visscher2009). Theory on whole-genome methods for prediction suggest that a very large discovery sample is needed, of the order of 100 000 s of individuals with SNP and phenotype data, to predict future observations with reasonable precision (Goddard, Reference Goddard2009). However, sample sizes of 300 000+ are likely to be available in the near future and in combination with new ‘genomic selection’ statistical methods (Meuwissen et al., Reference Meuwissen, Hayes and Goddard2001) it may become feasible to make accurate predictions of height from genetic data.
Under a simple model in which all resemblance between parents and progeny is due to additive genetic effects, the proportion of variance in offspring phenotype explained by mid-parent phenotype is r 2=½h 4, e.g. 0·32 for a heritability of 0·8. Hence, if identified SNPs cumulatively explain more than 32% of the phenotypic variance then a predictor from these SNPs will do better than the mid-parent phenotype. From the latest meta-analysis of height (Lango Allen et al., Reference Lango Allen, Estrada, Lettre, Berndt, Weedon and Rivadeneira2010) approximately 10–12% of phenotypic variance is explained by all robustly associated SNPs. However, a predictor built from genomic selection methods that use all individual-level genotype data should do better than explaining ~10% of phenotypic variance. It seems plausible that the combination of ever larger samples size, improved genome coverage and better statistical methods will result in DNA-based predictions that will rival or outperform prediction based on parental observations in the near future.
8. Global variation in height and the evolution of height
Height is one of the ranges of physical phenotypes that can differ greatly between different geographically defined populations. For example, mean height in many Southern European populations, such as Portugal and Italy, is generally lower than those from Northern Europe such as the Netherlands. Regional variation in height may be due to variation due to environmental or genetic influences or a combination of both. Height heritabilities, as estimated from twin studies, are broadly constant across European countries (Silventoinen et al., Reference Silventoinen, Sammalisto, Perola, Boomsma, Cornes and Davis2003). However, a high and consistent heritability for height says nothing about the nature of differences between populations. Once we more fully catalogue the DNA polymorphisms that cause variation, the relative contributions of gene and environmental factors on mean differences can be quantified.
It is, however, abundantly clear that human height has been increasing since at least the 19th century when comprehensive records first began (McEvoy & Visscher, Reference McEvoy and Visscher2009). The mean height of Dutch men, for example, has increased from 165 cm in 1860 to a current 184 cm (Cole, Reference Cole2003). The secular rise in height probably reflects improvements in health care and diet. The secular increase in Northern European height appears to have somewhat plateaued recently but Southern Europeans continue to show strong growth patterns such that the relative gap in height is closing (Garcia & Quintana-Domeque, Reference Garcia and Quintana-Domeque2007), suggesting that environmental factors are an important source of the geographic difference in height across Europe. Supporting such a conclusion is the observation that the SNPs associated with height by GWAS do not appear to be obviously different in frequency between Northern and Southern European populations. But small differences in allele frequencies can add up. Under a number of simplified assumptions, the mean genetic difference between the populations is 2Σ(aiδp (i)) (Falconer & Mackay, Reference Falconer and Mackay1996), where the sum is over all causal variants (with effect size ai) and δp (i) is the difference in allele frequencies between the two populations. For example, 1000 loci with a difference in allele frequency of 1% and an additive effect of 1 mm each would contribute to a mean difference of 2 cm. As previously noted, the identified 180 loci control only 10% of the variance in height and many more loci of very small effect will contribute to height variation. To fully test the extent to which differences in population height are genetic, we probably need to have more loci identified. Furthermore, height GWAS, as with the study of many traits, have been focused on European populations making it even more challenging to determine whether broader geographical differences in height between continents are genetic or environmental. It is yet unclear whether the catalogue of the variants that contribute to height are the same in identity and/or effect between populations. From height GWAS that have been conducted in Korean and Japanese populations (Cho et al., Reference Cho, Go, Kim, Heo, Oh and Ban2009; Okada et al., Reference Okada, Kamatani, Takahashi, Matsuda, Hosono and Ohmiya2010), we know that several loci were previously identified in Europeans and several novel loci were detected. A difference in both effect size and allele frequency between Europeans and Koreans was noted for the SNP in HMGA2 that is most strongly associated with height – the SNP explains about four times more variation in the European population. However, until causal variants have been identified, it is difficult to draw strong conclusions from allele frequencies and effects sizes at markers that are in LD with one or more causal variants.
9. Height evolution
Given that it is clear that many hundreds of genetic variants contribute to height, it is unlikely that at least some of these do not differ in frequency across populations either due to genetic drift or natural selection. Genetic drift is an important force in the emergence of new populations since their formation typically involves a bottleneck effect. Genetic drift could thus easily cause some populations to have more tall rather than short alleles (or vice versa). Alternatively, under selection, the frequency of a genetic variant that affects height and simultaneously confers an advantage or disadvantage to the prevailing environment could also lead to marked geographic differences in height if the selective force(s) and episode differ in geographic extent or intensity. The striking differences in stature between pygmy populations and their neighbours is thought to be the result of natural selection, most likely linked to some facet of their tropical rainforest environment, because the pygmy phenotype occurs in multiple unlinked rainforest localities in Africa, South America and South East Asia (Perry & Dominy, Reference Perry and Dominy2009). Several theories regarding this observation have been proposed including better mobility (Diamond, Reference Diamond1991) or more effective thermoregulation (Cavalli-Sforza, Reference Cavalli-Sforza1986). Small body size, and consequent reduced energy needs, might also be advantageous for a lifestyle where food supply is limited or uncertain (Shea & Bailey, Reference Shea and Bailey1996). Once the genetic variants underlying the pygmy phenotype across the world are unravelled, we will be able to tell if this remarkable convergent evolution has occurred through polymorphisms in the same set of genes or whether it was achieved by different genetic and biological pathways. Apart from the role of natural selection in explaining regional variation, it is likely that positive and negative selection have operated in tandem (purifying selection) at the broader species level to ensure that height is restricted to the observed normal range. Sexual selection and positive assortative mating also may have contributed to differences in height between populations.
10. Conclusions and the way forward
Combining the evidence from the resemblance between relatives, major mutations and GWAS, we can conclude that height is a typical complex trait with a range of allele frequencies of causal variants from rare Mendelian mutations to common polymorphisms. The bulk of genetic variation appears to be due to causal variants in linkage disequilibrium (LD) with common SNPs, which is surprising (to some). With current knowledge the model of genetic variation for human height appears consistent with most segregating variants being evolutionary neutral or nearly neutral. However, this conclusion is driven in part by a lack of discovery about causal variants that cause variation in the population, since signatures of selection will be weaker at sites in LD with causal variants than at the variants under selection, in particular for negative selection.
One important question, not just for human height, is how much variation in the population can be explained by low-frequency variants, for example, those with a frequency of about 1% in the population. Sequencing efforts such as the 1000 Genomes project (Siva, Reference Siva2008) and in the near future the availability of full genome sequences on many individuals will provide a test bed. Associated variants that have been detected to date each explain about 0·1–0·4% of the phenotypic variance. If causal variants have a frequency of 1% in the population, then they will be detected with current sample sizes of ~100 000 if their effect sizes are ~1·6–3·1 cm. Effects at associated SNPs, many of which are likely to be in strong LD with causal variants, are of the order of a few mm, and rare mutations (e.g. those causing Marfan syndrome, tall stature or dwarfism) have effect sizes of 10–100 cm. It seems likely that there must be variants with effect sizes in between these extremes.
What have we learned from over a century of genetics research on human height? Research into the resemblance between relatives and partitioning on phenotypic variation has not really added that much since the work of Galton, Pearson and Fisher. It is only in the last decade and in particular the last 5 years that genome-wide marker technology has enabled the mapping of ‘polygenes’. The results are interesting but, perhaps, not surprising: underlying variation in height there are many loci, most with small effect sizes, which appear to work additively. It seems that the mutational target for height is high in the genome, in that mutations in many genes can affect height.
For the near future, one exciting by-product of genomics technologies is that old questions can be addressed with new data. We name a few possibilities here but the possible list is much longer and only limited by the imagination of the researcher:
1. Assortative mating. With sufficient genetic variation explained by mapped loci, estimated additive genetic (breeding) values can be calculated from marker data and the phenotypic correlation between spouses can be compared with their genetic correlation. A social homogamy model would predict no correlation of breeding values in the absence of genetic substructure in the population.
2. Estimation of non-additive variation. With large sample sizes (10 000s) of genotyped sibling pairs, genetic variance can be partitioned into additive, dominance and additive-by-additive variance, using the same method as Visscher et al. (Reference Visscher, Medland, Ferreira, Morley, Zhu and Cornes2006, Reference Visscher, Macgregor, Benyamin, Zhu, Gordon and Medland2007). It may be possible to estimate dominance variance from GWAS data, fitting an additive and dominance relationship matrix simultaneously.
3. Estimation of genetic correlations between height and disease. Height is phenotypically correlated with a range of other traits, including disease (Gunnell et al., Reference Gunnell, Okasha, Smith, Oliver, Sandhu and Holly2001; Zuccolo et al., Reference Zuccolo, Harris, Gunnell, Oliver, Lane and Davis2008). The whole-genome approaches for estimating genetic variation can also be used to estimate genetic covariance even when traits are measured on different people. In a prediction framework, this was done for schizophrenia and bipolar disorder (Purcell et al., Reference Purcell, Wray, Stone, Visscher, O'Donovan and Sullivan2009).
4. Reconciling linkage and association results. If we have GWAS or sequence data on pedigrees then between and within-family variation, either across the genome or for a chromosome or locus, can be estimated simultaneously.
5. Estimating between-group differences. If a proportion of the variation is explained by known variants then estimated breeding values can be calculated for individuals from different groups and these differences can be compared to phenotypic between-group differences that are estimated from different individuals. For example, what is the mean additive genetic value from known variants for Dutch people compared to, say, Italians, and how does that compare to the phenotypic difference in height between these populations? Hence, in principle, the proportion of phenotypic between-group difference due to genetic factors can be estimated.
6. Variation due to the X-chromosome. The approach pioneered by Yang et al. (Reference Yang, Benyamin, McEvoy, Gordon, Henders and Nyholt2010) can be used for individual chromosomes. For the X-chromosome, different models of dosage compensation (X-inactivation) make specific predictions about genetic variance in males and females, and these can be tested empirically.
We acknowledge funding from the Australian National Health and Medical Research Council (grant nos. 389892, 613672 and 613601) and the Australian Research Council (grant nos. DP0770096 and DP1093900). We thank Bill Hill for many helpful comments, Mike Goddard for discussions and two referees for useful suggestions.



