


Introduction
Inventors, or those who produce valuable intellectual property, are central actors in the American knowledge economy and are an equally important constituency for those elected officials within the Democratic Party who have embraced the knowledge economy and have worked to hasten its development. Footnote 1 Despite the importance of inventors in the American political economy, social scientists know surprisingly little about the political beliefs and behaviors of those who produce intellectual property and even less about how their behavior has changed over time. As a result, it is difficult to determine whether the Democratic Party’s attempts to cultivate the knowledge economy have allowed it to reap electoral rewards.
Theory offers potentially competing answers to this question. On the one hand, because prominent Democrats have publicly championed the knowledge economy since at least 1972, Footnote 2 we might expect those efforts to have motivated American inventors to express deeper levels of support for Democratic candidates over time, much in the way that the Party’s positions on racial liberalism and labor legislation cultivated deeper levels of support for Democrats among minorities and the working-class. Footnote 3 On the other hand, the imperatives of divided government forced lawmakers to rely heavily on market-based reforms, like changes to US patent law, to promote knowledge economy development Footnote 4 and, as a result, knowledge economy development to date has generally been confined to a few regions, like California’s Silicon Valley Footnote 5 . Accordingly, we might also expect that American political institutions—namely winner-take-all elections in single-member districts—have concentrated the electoral payoffs to a few Congressional Districts or states. Footnote 6
To the extent existing studies address this question, they do so indirectly or by focusing on specific groups or regions, an approach that has the potential to bias the results. Popular news stories frequently publish headlines like “It’s True: Tech Workers Overwhelmingly Support Democrats in 2018,” but these analyses are often limited to a small number of companies (in this case, Amazon, Apple, Facebook, Microsoft, and Google), or a small number of industries (in this case information technology companies), or a small number of regions (in this case, the Silicon Valley or the Seattle suburbs). Footnote 7 As indicated below, any of these choices has the potential to bias the findings. Similarly, Bramlett, Gimpel, and Lee (Reference Bramlett, Gimpel and Lee.2011) find that major campaign donors in both parties are increasingly concentrated to metropolitan areas with distinct political preferences. Footnote 8 But not all metropolitan areas are deeply integrated into the knowledge economy, and those that are have affluent donors in many occupations outside of or adjacent to the knowledge economy. It remains an open question whether these trends also apply to those directly involved in the production of new technologies.
Other aspects of the political behavior of knowledge economy workers are also under-studied. Even if inventors have developed stronger attachments to the Democratic Party over time, it is an open question whether they have done so by virtue of their status as inventors or whether they are simply caught up in deeper political currents shaping the partisan preferences of certain industrial sectors or certain regions, like the growing rural–urban divide. Footnote 9 This question cannot be answered in the absence of longitudinal data measuring behaviors across time. News sources also routinely emphasize that the Democratic Party leverages affluent donors who reside in relatively safe states or districts to fund more competitive campaigns across the country, as indicated by ubiquitous news references to California as a “political ATM.” Footnote 10 This hypothesis has some empirical support, though it appears that both political parties are adept at leveraging donor networks in affluent metropolitan areas. Footnote 11 It is an open question whether knowledge economy workers engage in strategic behaviors, like donating heavily to outside campaigns, which might increase their influence within the Party and act as a countervailing force to their spatial concentration.
To test these hypotheses, I developed a unique data set containing ideology scores and information on the donation behavior for 30,603 American inventors across 18 election cycles. Specifically, I used the research data sets provided by the US Patent and Trademark Office to identify US residents listed as named inventors on a US patent applied for on or after January 1, 1979. I then merged the inventor data with campaign contribution data from the Database on Ideology, Money in Politics (DIME) Footnote 12 to capture campaign donations and the common-factor ideology scores imputed from those donations among US inventors for every election cycle from 1980 through 2014. Finally, I linked the self-reported donor employer names to organizations in the Capital IQ database to obtain unique employer identifiers and industry data (4-digit SIC codes), where available. With such data, it is possible to analyze changes in aggregate donation patterns and their geographic expression; it is also possible to determine whether American inventors are unique in their behavior after controlling for things like gender, geography, and place of work (firm or sector). I briefly describe and motivate the construction of the data set in Section “Construction of the Dataset” (and more details are in Section A.1 of the Appendix).
Analysis of the data set confirms that, while the Democratic Party has made significant inroads among American inventors in terms of garnering higher shares of donors and donations, the vast majority of those benefits have increasingly come from only a few regions and have flown to a relatively small number of candidates, as shown in Sections “Inventors Have Strengthened Their Attachment to the Democratic Party” and “The Democratic Party’s Electoral Rewards Are Geographically Concentrated”. I also find that, while American inventors who contribute to Democrats have become much more liberal over time, on average, this development seems to be driven by changes in political geography, as shown in Section “Changes in Inventor Partisanship and Ideology Arise from Geographic Trends”. The average ideology scores of Democratic inventors are not substantively different from those of their peers (those of the same gender who work at the same firm and live in the same Congressional District), and the large observed decline in ideological variance among Democratic inventors has been significantly driven by similar declines in the average ideology scores across the districts in which American inventors reside. Finally, the results suggest that, in recent elections, inventors do not exhibit strategic behaviors and they differ from their peers only in the extent to which they have forgone donating to Democrats in favor of donating to their employer’s corporate political action committee (PAC).
Taken together, the results suggest that American political institutions have limited the electoral payoffs for the Democratic Party, that American inventors who donate to campaigns increasingly live in liberal enclaves of similar ideological persuasion, and that knowledge economy participation motivates regional rather than individual differences in political behavior. They also suggest that, despite growing somewhat more liberal over time as a group, inventors increasingly choose to funnel their political contributions to employer PACs that give to both parties.
This article makes three contributions to the literature. The first is to add to a small and growing literature on the ways in which American political institutions have shaped knowledge economy development in the United States, Footnote 13 especially the debate about whether agglomeration—or the tendency for innovation to increasingly concentrate in a small number of regions—is making the knowledge economy politically unstable. Footnote 14 I do so by addressing a series of empirical questions raised in this debate about whether the Democratic Party has succeeded in attracting more knowledge economy workers to its coalition over time; if so, whether the spatial concentration of innovation limits the Party’s electoral benefits; and, if so, whether strategic behaviors could plausibly surmount those limitations.
The second contribution is to supplement what we know about the political behavior of knowledge economy workers, an under-studied group in American politics, by considering how their partisan preferences have changed over time and whether those changes are rooted in broader sectoral or geographic trends. Our dominant understanding of this group is based a single survey conducted in 2017 which compared the policy preferences of technology entrepreneurs to those of partisan donors and the general public. Footnote 15 I build on this groundbreaking study by analyzing changes in partisanship and ideology over time and by using regression analysis to compare the political behavior of inventors to those who live and work in the same place.
The third contribution is to offer a tentative theoretical critique of neoliberalism that applies outside of the article’s specific setting. I use the term neoliberalism to refer to policies (like patent reform) that induce changes in individual or firm behavior to produce a desired outcome (like more private sector spending on technological development) in lieu of alternatives (like heavier federal spending on research and development) that give the state a more prominent role in shaping economic affairs. Such policies are used in many contexts and their proliferation since the 1980s has led one scholar to describe them collectively as a “submerged state.” Footnote 16 By focusing on those who develop intellectual property, this study analyzes changes in political behavior among the direct beneficiaries of the political movement to strengthen US and foreign patent law which unfolded between 1980 and 1994. Footnote 17
I argue that, irrespective of whether neoliberal policies produce ideal economic outcomes, their well-documented (and in many cases expected) tendency to exacerbate inequality creates a special problem in a political system with winner-take-all elections in single-member districts. Specifically, American institutions have the potential to create a political form of “double marginalization” in economic policymaking. By first constraining the economic policy choice set to those policies that exacerbate geographic inequalities Footnote 18 and then impeding the formation of cross-regional coalitions that might advocate for a more equitable geographic distribution of resources, American institutions may doom many such reforms to marginal (and highly unequal) success. I comment on this possibility and other implications in the Conclusion.
Prior work and hypotheses
Is the American knowledge economy politically sustainable? Prior work suggests contrary answers.
Iversen and Soskice argue that, in the 1980s and 1990s, elected officials in advanced capitalist democracies including the United States promoted the knowledge economy by enacting a set of policies, like increased investments in higher education and reduced trade barriers, demanded by middle-class voters. They did so to spread the economic benefits of the knowledge economy transition “to a majority of voters” and expand the size of the political coalition supporting a further deepening of these policies. Footnote 19
In this theory, knowledge economies are politically stable and resilient in the face of economic shocks and rising populism. Their underlying policies have a strong electoral connection to a broad political coalition. And the tendency for innovation to concentrate in a small number of highly productive regions (or agglomeration) limits capital mobility and restrains the power of business interests to influence policy in other directions. Footnote 20
Short argues, in contrast, that after the economic turmoil of the 1970s, the two main political parties in the United States staked out unique positions on the macroeconomy: a Republican approach based on market fundamentalism and a Democratic approach that sought to promote economic development through technological innovation, but which also envisioned a significant role for the government in this process. The imperatives of divided government in the 1980s and 1990s then forced elected Democrats to abandon many policies demanded by the middle class, like investing in higher education, and to instead pursue market-based policies, like patent reform, to hasten the knowledge economy transition. Footnote 21
In this theory, the American knowledge economy is politically unstable. It relies heavily on market-based or “neoliberal” policies that are more firmly rooted in the demands of business managers at companies that invest in technology rather than middle-class voters, thus weakening the electoral connection. And those policies are known to exacerbate geographic disparities in a political system where the main political parties must win a majority of districts and states (irrespective of whether they win a majority of voters) in order to govern.
These competing theories raise multiple empirical questions that have yet to be studied in American political science. Four such questions are addressed in this article.
First, is it true that knowledge economy workers have developed stronger ties to the Democratic Party over time? Many popular accounts support this hypothesis but often confine their analysis to “tech workers” at a small number of companies or a small number of regions. Footnote 22 Survey evidence suggests that Democratic donors believe technology entrepreneurs will have increasing influence on elected Democrats in the future, but these studies tell us little about historical trends. Footnote 23 At the same time, existing work also suggests that technology entrepreneurs have idiosyncratic preferences that do not make them obvious allies with the Democratic Party on all issues, especially when it comes to business regulation. Footnote 24 The inventor-donor dataset allows us to explore this question by examining the historical political behavior of those who invent new technologies in many sectors across the United States.
Second, if knowledge economy workers have developed stronger ties to the Democratic Party, are the Party’s electoral rewards increasingly confined to a small number of regions? Prior work suggests the answer should be yes. Economists have documented that technological production has become increasingly concentrated, geographically, over time. Footnote 25 And political scholars have documented a similar trend in campaign contributions, generally. Footnote 26 The inventor-donor dataset allows us to determine whether this remains true of knowledge economy workers without biasing the results by focusing on only a few technological domains or regions.
Third, is any observed affinity between knowledge economy workers and the Democratic Party a byproduct of their status as producers of new technologies (an individual characteristic) or of broader sectoral and regional trends? To my knowledge, no prior work has addressed this question because there is no longitudinal nationwide dataset of knowledge economy workers whose preferences or behavior can be compared to those who work in the same industry or reside in the same region. The inventor-donor dataset enables such an analysis.
Fourth, does “monetary surrogacy,” or the ability of knowledge economy workers to strategically invest in competitive elections nationwide, act as a countervailing force to agglomeration in the American political system? Prior work has documented a growing share of contributions from donors outside of the recipient’s district or state Footnote 27 and that the competitiveness of a race is a significant predictor of receiving outside donations. Footnote 28 But prior work also suggests they, even if inventors behave in this manner, they would still face significant obstacles to influencing member policy, Footnote 29 especially when directing donations to outside competitive districts. Footnote 30 The inventor-donor dataset allows us to qualitatively assess whether knowledge economy workers exhibit these behaviors.
Construction of the dataset
The process for creating the inventor-donor data set involved three main steps: (1) identify all inventors (first and last name, firm, and city and state of residence) listed on US patents that were applied for on or after 1 January 1979 and who resided within the United States using research datasets provided by the US Patent and Trademark Office; (2) identify the subset of these US inventors that also appear in the DIME database using fastLink Footnote 31 and acquire data on their contribution history and imputed ideology; and (3) match the self-reported employer names from the DIME database to organizations in Capital IQ to generate unique identifiers for these organizations plus other information, like SIC codes, where available. More details on each of these steps and statistics characterizing the aggregate dataset are provided in Section A.1 of the Appendix.
The merge between inventor and donor data (steps 1 and 2) was executed using fastLink. Footnote 32 In the final dataset, I set the posterior probability of a match to a high threshold (0.99) to minimize false positives, but the results are robust to using a lower threshold (0.9) which increases the sample size by about 17 percent (from 30,603 inventor donors to 35,778). The merge between donor employers and Capital IQ firms was executed using Capital IQ’s lookup algorithm, but I manually audited the links for over two thousand firm names representing almost 75 percent of all inventor campaign contributions and, for the remaining firms, retained only those links that also had a high degree of string similarity.
A primary advantage of this dataset is that it allows us to study the political behavior of the people and organizations that produce new technologies while remaining agnostic as to the boundaries of what constitutes “technology,” which can bias the results of any political analysis. US patent law places very few restrictions on what constitutes patent eligible subject matter, Footnote 33 and so, subject to certain disclosure requirements and an examination of prior art, the Patent and Trademark Office generally issues patents for any new and non-obvious invention, broadly construed. Accordingly, the technologies that are the subject of this study are not limited to the computer and internet technologies that tend to dominate the news cycle but also include new drugs, nanotechnology, genetically modified crops, and many other lesser-known domains of invention, like the design (look and feel) of new sneakers. While this may seem over-inclusive to some, it is important to cast a broad net to avoid the bias inherent in individual judgments about what constitutes “technology.”
Table 1 illustrates this point. To generate the table, I identified the primary technological domain of each inventor-donor using the classification scheme developed by the National Bureau of Economic Research, and then tabulated the total dollar amount of campaign contributions across all election cycles within each domain. The table presents the top 7 technology domains with the highest share of donations going to Democratic candidates and committees (“High Dem Share”) and the top 7 with the highest share of donations going to Republican candidates and committees (“High Rep Share”). The table shows that inventors in computing (computer hardware and software, computer peripherals, and semiconductor devices) and some other areas like optics and genetics give quite heavily to Democratic candidates and committees. At the same time, inventors in other technological domains, including those related to agriculture and resource extraction, donate quite heavily to Republican candidates and committees. All of these inventors are arguably working at the technological frontier within their respective industries and are therefore participating in the knowledge economy. But an exclusive focus on those who work in computer and internet technology would suggest—inappropriately in my view—that commanding majorities of all knowledge economy workers have a strong partisan attachment to the Democratic Party. An analysis of all inventor-donors helps avoid this bias.
Donations by technology classes show political bias

Note: Each row shows the aggregate contributions made by inventor-donors in certain technological subcategories (in millions of 2019 dollars) as well as the share of that total going to Democratic and Republican candidates and committees. There are 37 technology subcategories in the NBER scheme but only 14 are presented in the table, reflecting the top 7 domains with the highest share going to Democrats and the top 7 domains with the highest share going to Republicans.
Though the lack of comparable databases makes it difficult to benchmark descriptive statistics, the database can be used to replicate prior findings in ways that provide some confidence that it is soundly constructed. For example, Rodden reports that Democratic presidential vote share was not correlated with measures of patent output (patents per thousand people on the log scale) as recently as 1996, but the two variables have become strongly correlated since then. Footnote 34 Data from the inventor-donor dataset produces similar findings, albeit with respect to donor rather than vote shares. For each of four election cycles (1980, 1996, 2004, and 2012), Figure 1 shows the share of all patents applied for by inventors located in each Congressional District against the share of all inventor donations to Democratic candidates and committees by inventor-donors located in that same district. The blue line shows the results of regressing Democratic contribution shares on patent shares. The figure shows that, from 1980 through 1996, the patent share of a Congressional District was not significantly associated with the share of total donations to Democratic candidates or committees by inventor-donors. But since 1996 that relationship has grown more positive. In this way, changes in regional donation patterns from the inventor-donor dataset mirror changes in regional voting patterns reported in other studies.
For each of four presidential elections (1980, 1992, 2004, and 2012), each panel shows the share of all patents applied for by US inventors in each Congressional District against the share of all contributions to Democratic candidates and committees from inventor-donors in the same District. Patents with more than one inventor were counted as a fractional share (1 divided by the number of inventors) accruing to each inventor. Congressional District boundaries are based on the 1990 Census. Districts that produced no patents or no campaign contributions are treated as missing data. The blue line shows the best linear fit given the data (i.e., a regression of contribution share on patent share).

Analysis
Inventors have strengthened their attachment to the democratic party
If the Democratic Party’s commitments to the knowledge economy have produced electoral payoffs, we would expect to observe the Democratic Party earning larger aggregate shares of either inventor donations or inventor donors, the latter of which neutralizes any potential bias from a small number of donors who contribute exceptionally high amounts to political campaigns. We would also expect to see higher shares of inventors change their party affiliation from Republican to Democrat than vice versa. And we would expect new donors to have more liberal ideology scores on average and to exhibit less ideological variance around the party mean over time.
For each election cycle from 1980 to 2014, Figure 2 shows the total amount of political contributions (in millions of 2019 dollars) that American inventors made to each of the two major parties (left panel) as well as the total number of inventors that donated to each of the two major parties (right panel). Though Republicans attracted about 73.3 percent of inventor donations in the 1980 election cycle, the parties were almost at parity in the 2008 election cycle, and though Republicans still held an advantage in the 2014 cycle, it was significantly smaller than in prior years (58.5 percent of donations in a cycle where 67.7 million dollars was raised by the two parties).
The left panel in this figure shows total contributions by American inventor-donors in all federal elections from 1980-2014 broken down by recipient type: Democratic candidates and PACs (blue line) and Republican candidates and PACs (red line). The contribution amounts are reported in millions of 2019 dollars. The right panel shows the total number of American inventor-donors that contributed to each recipient type for each election cycle from 1980-2014. Inventor-donors are political donors who reside in the United States and are listed as an inventor on any United States patent applied for on or after 1 January 1979. Both vertical axes are on the logarithmic scale.

Democratic gains among inventors are even more significant when considering the share of donors rather than donations: though 68.5 percent of inventors contributed to Republicans in the 1980 election cycle, 62.9 percent of inventors contributed to Democrats in the 2014 cycle. This suggests that, between 1980 and 2014, the Democratic Party’s commitments to knowledge economy development effectively reversed the Republican Party’s commanding advantage in the number of knowledge economy workers who contribute to political campaigns.
The aggregate results in Figure 2 combine the effect flowing from changes in the sample (as more inventors donate to campaigns over time) as well as the effect flowing from changes within individuals (as some inventors who previously contributed change their partisan attachments). To assess the strength of the latter channel, I limited the dataset to those donors who only contributed to one of the two main parties in any given election cycle and used the party affiliation of the recipient to impute a partisan attachment for each donor. Footnote 35 I then calculated the share of single-party inventor donors in each election cycle who changed their party affiliation (compared to the last election cycle) from Democrat to Republican or from Republican to Democrat.
Figure 3 shows the results. Except for the 1996 election cycle, higher shares of inventors switched their partisan affiliation from the Republican to Democratic Party (than vice versa) from 1980 to 2004, but party defections were about the same starting around 2006 and have remained at low levels since. In short, the Democratic Party’s commitments to the knowledge economy did not simply induce more liberal inventors to start donating to political campaigns. It also seems to have induced donors with established records of contributing to change their partisan commitments at relatively high rates.
The figure shows the share of single-party donors in each election cycle who switched from being a Republican to a Democratic donor (blue) and from being a Democratic to a Republican donor (red).

Similar results emerge if we focus on donor ideology. Figure 4 depicts how inventor ideology has changed over time. For each election cycle from 1980 through 2014, it shows the average ideology score (left panel) and the variance in ideology scores (right panel) for two sub-populations: those who contributed to Democratic candidates and committees (blue line) and those who contributed to Republican candidates and committees (red line).
This figure shows the average (left panel) and variance (right panel) of the ideology scores for those inventor-donors who contributed to Democratic candidates and committees (blue line) and those who contributed to Republican candidates and committees (red line) in each election cycle from 1980 through 2014.

As shown, the average ideology score among Republican donors remained relatively stable at about 0.75 until the 2006 election cycle, when it increased a bit. This suggests that inventors who contribute to Republicans were fairly conservative to begin with and have become slightly more conservative since 2006. In contrast, the average ideology score among Democratic donors remained constant and close to zero (at about −0.08) through 1990 but then dropped dramatically over the next twelve election cycles, reaching a low of −1.23 in the 2012 election cycle. This suggests that inventors who contributed to Democrats were a relatively moderate group to begin with but became much more liberal beginning with the election of 1992. Because ideology scores are fixed and do not change over time, these trends arise solely from changes in the sample, meaning those inventors who began donating to Democratic campaigns in 1992 were consistently more liberal than those inventors who had donated to Democratic campaigns in the 1980s.
Similarly, the variance or spread in ideology scores for Republican donors was quite small from the beginning and appears to have slightly increased over the course of the entire time series. In contrast, inventors who gave to Democrats appeared to be relatively moderate, on average, because they had widely varying ideology scores in early election cycles. But from roughly 1992 through 2012, the variance in ideology scores for Democratic donors dropped dramatically so that in recent elections, Democratic donors have been as tightly distributed about their mean as Republican donors were in 1980 and 1982. In short, American inventors that contribute to political campaigns have become more polarized, as we observe both higher separation between average ideology scores and lower variances around those means, but that polarization arises mostly from ideological changes that took place among inventors who contribute to Democrats.
In sum, the Democratic Party has made tremendous gains among knowledge economy workers since 1980. It effectively reversed a strong Republican advantage in the number of inventors who donate to each party and is competitive in terms of total contributions. For more than 20 years, from 1982 to 2004, it consistently recruited higher shares of inventors to switch their partisan affiliation. And inventors who contribute to Democrats have become much more liberal as a group, on average, and much more homogenous in their ideological leanings.
The Democratic Party’s electoral rewards are geographically concentrated
In a majoritarian political system with single-member districts, the tendency for knowledge economy work to cluster (or agglomerate) in a handful of regions with strong pre-existing advantages might limit the electoral payoffs to be earned from supporting the knowledge economy transition. Footnote 36 Figure 5 illustrates this trend. It shows that the share of patents coming from the top 1 percent of counties, based on patent production, has steadily increased since the mid-1980s. While the most innovative counties in the US produced 25 percent of all patents in 1980, by 2014, their share of all patents was more than 45 percent. We would therefore expect to see patterns of political behavior that reflect patterns of economic behavior, with an increasing geographic concentration in innovation translating to an increasing geographic concentration in inventor donations.
The figure shows the share of all patents coming from the top 1 percent of zip codes.

Figure 6 indicates that this has taken place. For each of five presidential election cycles (1980, 1988, 1996, 2004, and 2012), the figure shows, for each party, the share of inventor donations coming from the top 1 percent of zip codes, by donation amount (left panel), and the share of donations going to the top 1 percent of candidates (right panel). Campaign contributions, by this measure, have become even more concentrated than inventions. The Democratic Party’s share of donations flowing from the top 1 percent of zip codes has grown, for example, from about 25 percent in the 1980 election cycle to more than 50 percent in the 2012 election cycle. Also, the top 1 percent of Democratic candidates who receive the most inventor donations has increased their share of donations from about 16 percent to about 67 percent. Inventor contributions to Republican have experienced similar trends, though the levels of concentration are not quite as severe as for Democrats. And while growing concentration in receipts is dominated by donations to presidential candidates, the trends still exist in midterm elections. Footnote 37
The figure shows the share of all donations from American inventors flowing from the top 1 percent of zip codes, by donation amount (left panel), and the share flowing to the top 1 percent of political candidates, by donation receipts (right panel).

Changes in inventor partisanship and ideology arise from geographic trends
While Figure 2 suggests that the Democratic Party has made significant progress in courting inventors as a constituency, it is amenable to multiple interpretations. Importantly, changes in aggregate donation patterns do not reveal whether inventors, as a class, have begun to favor Democrats by virtue of their status as producers of new technologies or whether inventors increasingly reside in metropolitan areas that have acquired stronger attachments to the Democratic Party over time. The same is true of sectoral trends. If the Democratic Party has taken policy positions that are consistent with the interests of some industries, like solar power companies, but opposed to others, like conventional carbon-based energy companies, the patterns documented above may suggest that inventor behavior reflects a deeper sectoral realignment in American politics.
To disentangle the effects of geography, industry, and inventorship, I matched inventor donors to non-inventor donors who have the same (imputed) gender, work at the same organization, and reside in the same Congressional District. Footnote 38 For each election cycle, I then regressed each of two dependent variables—a continuous ideology score and a binary variable indicating whether the donor contributed to Democratic candidates or committees—on a binary variable indicating whether the donor is an inventor. The evolution in the coefficients on the inventorship variable, over time, reveal whether inventors have become more liberal or developed a stronger propensity to contribute to Democrats after controlling for differences arising from gender, place of work, and place of residence.
The regression output is reported in Section A.3 of the Appendix, but the main results are illustrated in Figures 7 and 8. Footnote 39 As shown in Figure 7, from 1980 through 2006, inventors were just as likely as their peers to donate to Democrats, but since the 2008 election cycle, they have become slightly less likely than their peers to donate to Democrats. These results are consistent with Broockman et al. to the extent they suggest that inventors have somewhat unique political preferences and may be more conservative than their peers in certain dimensions. Footnote 40 But the results also suggest that changes in political geography are driving Democratic gains among inventors: after controlling for geography, inventorship actually pulls in the opposite direction and would alone suggest that the Democratic Party has been losing, not gaining, ground with this constituency.
This figure shows the point estimates and 95 percent confidence intervals from regressing a binary variable indicating whether the donor contributed to a Democratic candidate or committee on a binary variable indicating whether the donor is an inventor, after matching inventors with non-inventors who have the same imputed gender, place of work, and place of residence. These logistic regressions are run for each matched data set within each election cycle from 1980 through 2014. The vertical axis reflects the estimated difference in the logged odds of donating to a Democratic candidate or committee between inventors and non-inventors, with negative numbers implying less than even (50-50) odds.

This figure shows the point estimates and 95 percent confidence intervals from regressing ideology scores on a binary variable indicating whether the donor is an inventor, after matching inventors with non-inventors who have the same imputed gender, place of work, and place of residence. These linear regressions are run for each matched data set within each election cycle from 1980 through 2014. The vertical axis reflects an estimated difference in mean ideology scores between inventors and non-inventors.

Similar findings emerge from analyzing changes in inventor donor ideology arising from changes in the population of Democratic inventor donors. Figure 8 shows the results when the dependent variable is donor ideology. It suggests that inventors in early election cycles were slightly more conservative than their peers and slowly became more liberal than their peers over time, though the effect is not precisely estimated and is not significantly different from zero until 2002. That trend, however, appears to have reversed around 2006 and by 2014, inventors were only slightly more liberal than their peers (differing only by −0.13 points on the common factor ideology scale in 2012). Footnote 41 Accordingly, after controlling for geography and other factors, differences between inventors and non-inventors explain only about 11 percent of the total change in average ideology scores among Democratic donors (of about −1.15 points).
Though individual characteristics, like inventorship, do not seem to explain increasing liberalism among Democratic donors, it is still possible that we are confounding geographic with firm-level or sectoral behaviors. To explore this question, I first expanded the inventor donor database, for the 1992 and 2012 election cycles, to include campaign contribution data on all workers at firms that produce intellectual property. Specifically, as described in Section A.1 of the Appendix, I used patent data to identify all companies that produced at least five patents Footnote 42 in the five years prior to each election cycle. I then merged these firm names with the DIME database to gather contribution and ideology data on all employees for these firms (inventors and non-inventors alike) in each election cycle. Last, I linked new firm names (for those firms which did not have inventor donors) to Capital IQ firm identifiers and 4-digit SIC codes.
With this dataset, I performed a variance decomposition on the subsets of knowledge economy workers who contribute to Democrats and who contribute to Republicans. The motivation and technical details for this analysis are described in Section A.2 of the Appendix.
The results suggest that Democratic knowledge economy workers are becoming more polarized primarily by virtue of the place they live rather than the place they work, though residual variation in ideology scores within districts and firms remains an important contributor as well. Figure 9 illustrates the main findings. It reveals that, for both Democratic and Republican knowledge economy workers, the variance in the average ideology scores between firms did not materially change between 1992 and 2012. This means that differences between firms cannot explain increasing polarization among knowledge economy workers.
This figure shows the empirical standard deviation in the distribution of average ideology scores across Congressional Districts (top line) and across organizations (middle line) as well as the residual deviation within districts and organizations (bottom line). The estimates are produced by fitting the model described in Section A.2 of the Appendix. The estimates are reported for two different election cycles: 1992 (black points and 95 percent confidence intervals) and 2012 (gray points and confidence intervals). The estimates are also reported from fitting the model to two different data sets: Democratic donors (left panel) and Republican donors (right panel).

In contrast, for Democratic knowledge economy workers, the estimated variance in the average ideology scores between Congressional Districts plummeted by about 84 percent and, as of 2012, was close to zero (the point estimate is 0.058). In other words, Democratic knowledge economy workers have come to increasingly reside in homogeneous liberal enclaves, so that there is almost no variation left in the average ideology scores across the districts in which these workers reside.
A significant decline in the residual variance, by about 40 percent between 1992 and 2012, also suggests that polarization among Democratic knowledge economy workers increased within firms and districts as well. But the amount of ideological variation remaining within firms and districts is still relatively large (comparable in size to the variance between firms). The most salient and surprising result is the virtual dissipation of any meaningful variation between districts.
The results are similar when the variance decomposition is run using Congressional Districts and 4-digit SIC codes instead of firms. Whether the alternative source is hypothesized to be place of work or industrial affiliation, increasing geographic polarization emerges as the more plausible source of increasing polarization among knowledge economy workers who contribute to Democrats.
Strategic donation patterns
Do inventors exhibit strategic behavior that might allow their donations to sustain a broad political coalition? I approached this question in two ways. First, I analyzed patterns of local and out of district giving among inventor donors in the 2012 presidential election and the 2014 midterm elections (the most recent elections in the data set). Second, the regression results from Section “Changes in Inventor Partisanship and Ideology Arise from Geographic Trends” revealed that inventor donors since 2006 have become less likely to donate to Democrats, but additional analyses Footnote 43 revealed that they have not become more likely to donate to Republicans but have instead become more likely to donate to relatively centrist PACs of unknown partisan affiliation (PAC-UPAs). Footnote 44 I therefore audited these contributions for the inventor donors in the matched data set for the 1992 and 2012 election cycles to better understand this behavioral shift.
Closer inspection of the top recipients in 2012 and 2014 suggests that inventor donations remain concentrated partly because inventors (from both parties) give mostly to local candidates and partly because Democratic donors send much of their more expressive or strategic donations to candidates who either reside in states that are leading knowledge economy development or who have publicly promoted the knowledge economy. On the whole, local giving among inventors has declined, but still made up a majority of donations in the 2014 election cycle (down from 71.6 percent to 51.8 percent of all inventor donations from 1982 to 2014). Among Democratic recipients, in the 2012 presidential election, three of the biggest recipients of inventor donations behind presidential candidate Barack Obama were Senate candidate Elizabeth Warren from Massachusetts, Senator Maria Cantwell of Washington, and Congresswoman Nancy Pelosi of California. Pelosi raised almost all (98.6 percent) of those donations from local donors, but Warren and Cantwell both raised higher shares from out of state donors (47.2 and 33.5 percent, respectively).
Similarly, in the 2014 midterm elections, Senators Ed Markey of Massachusetts and Kay Hagan of North Carolina were two of the top four recipients and both drew significant shares of inventor donations from out of state donors (47.9 and 37.5 percent, respectively). But the top recipient in that cycle was Senator Cory Booker of New Jersey, who has taken prominent positions on the knowledge economy Footnote 45 and who received 81.8 of his donations from out of state inventors; the fourth largest recipient was Senator Gary Peters of Michigan who has sought to promote technological innovation in his home state, especially within the auto industry, Footnote 46 and who received 73.1 of his donations from out of state inventors. As these examples suggest, there is some opportunity to cultivate inventor support for candidates in non-leading states, but few have successfully capitalized on those opportunities. The dominant tendency is instead for large shares of Democratic inventor donations to flow to local candidates, candidates in regions that are leading the knowledge economy transition, or to knowledge economy advocates in relatively safe seats. Footnote 47
Similarly, since 2006, inventors have become less likely to donate to Democrats and more likely to donate to PAC-UPAs. An audit of these donations revealed that the vast majority of these donations are going to PACs representing the donor’s employer, and that the share of PAC-UPA donations flowing to employer PACs increased from about 83 to about 89 percent between 1992 and 2012 (see Table 2). The data cannot tell us whether this reflects underlying donor preferences, as employees may feel obligated to contribute to their employer’s PAC for many reasons. Footnote 48 Irrespective of the behavioral motivation, the outcome does not suggest that inventors are behaving in a way to strategically benefit Democrats. On the contrary, they appear to be more frequently contributing to and contributing larger shares to employer PACs with weaker attachments to the Democratic Party.
The PAC-UPAs Inventors Favor Are Employer Corporate PACs
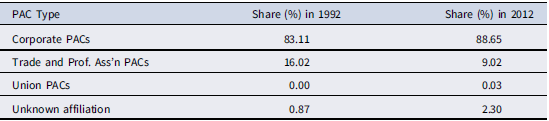
Note: This table shows the results of sub-categorizing the PAC-UPAs that received donations from inventors in the matched data set as PACs representing trade and professional associations, corporations and their employees, or unions, with the remainder being categorized as PACs of no discernible affiliation. The share of donations to each type of PAC-UPA are shown for the 1992 election (column 2) and the 2012 election (column 3).
5 Conclusion
As a group, inventors, or those who produce the new technologies that drive the knowledge economy, have come to favor Democrats when donating to political campaigns, and those who contribute to Democrats have also become more liberal since the 1992 election cycle. Similarly, from 1982 to 2004, relatively large shares of single-party donors switched their party affiliation from Republican to Democrat. These findings generally support the hypothesis that the Democratic Party’s rhetoric and policy commitments on knowledge economy formation have allowed it to reap electoral rewards.
But closer inspection of the data suggests that these rewards may be highly unequal and qualified, in ways that call into question the knowledge economy’s viability as a dominant platform of economic development. Just as innovation has become increasingly concentrated in geographic space, so have donations from inventors become more concentrated, with roughly 60 percent of donations to each party coming from only 148 zip codes in the 2012 election cycle. Also, larger shares of these donations increasingly flow to presidential candidates and a small number of Congressional candidates who either live in states that are leading knowledge economy development or who have publicly supported the knowledge economy. In a majoritarian system with single-member districts, the concentration of knowledge economy development to a few regions seems to be generating large political payoffs for some candidates and more muted results for many others.
Of course, the campaign finance system has developed institutions for distributing money to more competitive races, but it is not yet clear whether it does so in ways that create concrete electoral incentives for the many Democratic candidates outside of known knowledge economy hubs to take up or maintain the cause of knowledge economy development. If as yet unobserved voting behavior among inventors follows their donation behavior, institutions for redistributing donations may offer little recourse, as inventor votes will remain concentrated, nevertheless. Moreover, even if the Democratic Party finds it useful to draw resources from affluent knowledge economy hubs to fund competitive races around the country, the evidence suggests that the parties are somewhat evenly matched when it comes to leveraging urban donor networks Footnote 49 and that this form of monetary support is not likely influence member policy. Footnote 50
More broadly, these results suggest that American political institutions create at least two major perils for those who seek to mobilize the force of the government to undertake bold new programs of economic development. First, in a setting where the two main political parties have staked out divergent philosophies on macroeconomic management, those aspects of the nation’s governing institutions that protect the rights of political minorities may tend to give neoliberal strategies a higher likelihood of becoming law. Footnote 51 But the market-oriented reforms that those strategies rely upon and the unequal (and limited) response of state governments in a federalist system may also tend to exacerbate pre-existing regional inequalities.
Then, in the absence of a more robust effort by the federal government to equalize regional patterns of economic development, winner-take-all elections in single-member districts may cause economic agglomeration Footnote 52 to turn into political agglomeration, Footnote 53 where geographic concentration in economic gains leads to concentration in electoral payoffs and relatively few political candidates perceive a benefit from supporting or broadening the policies driving the economic transition. This in turn may impede the formation of the kinds of wide cross-regional coalitions, at the electoral level, that would be needed to overcome the imperatives of divided government to assert the federal government’s hand more forcefully. Opportunities to broaden these policies to bring benefits to more regions may then be confined to relatively rare moments when the Democratic Party controls the government. The Biden administration’s success with the Inflation Reduction Act, the CHIPS and Science Act, and the Infrastructure Investment and Jobs Act from 2021 to 2022 suggests that Democratic Party leaders are aware that its previous approach to knowledge economy development has produced unequal economic gains that have turned into significant political liabilities.
Political scientists have previously documented that the nation’s governing institutions tend to create gridlock and are resistant to policy change. Footnote 54 And some have shown how the fact of agglomeration has created geographic cleavages (the “rural–urban divide”) that tend to impede the Democratic Party’s ability to translate aggregate economic growth into a governing majority. Footnote 55 These institutional constraints may, however, be linked in a way that scholars have yet to appreciate and which deserves further exploration.
A Appendix
A.1 Constructing the Inventor-Donor Database
As indicated in the main article, the process for creating the inventor-donor data set involved three main steps: (1) identify all inventors (first and last name, firm, and city and state of residence) listed on US patents that were applied for on or after 1 January 1979 and who resided within the United States using research datasets provided by the US Patent and Trademark Office; (2) identify the subset of these US inventors that also appear in the DIME database using fastLink and acquire data on their contribution history and imputed ideology; and (3) match the self-reported employer names from the DIME database to organizations in Capital IQ to generate unique identifiers for these organizations plus other information, like SIC codes, where available.
To implement the first step, I used the research datasets published by the PTO on the Patentsview website to build a database containing the first and last name, city and state, and organizational assignee (a firm, a university, a government agency, etc.) for all inventors who applied for a US patent on or after 1 January 1979, who listed an address in the US in their correspondence with the PTO (i.e., were American residents at the time of the patent application), and who assigned their patent to some organizational entity. Assignees are usually employers; by law, the inventors named on a patent must be people, but ownership of the patent routinely passes to that person’s employer by virtue of the employment contract. If that does not happen, ownership passes to the inventors (there is no assignee). Because employer is an essential field for matching with DIME data, I exclude instances where ownership passes to the inventors and keep only instances where patent ownership passes to some organization.
To implement the second step, I gathered the same information (name, city and state, and employer) from the DIME database. Using fastLink, I then identified those American inventors who also contributed to a political campaign at some point from 1979 through 2014 (the 1980-2014 cycles). I completed the matching in three steps. First, I stratified the patent and donor data by both election cycle and state. The algorithm would therefore only find a match if an inventor both applied for a patent and made a campaign contribution in the same election cycle (an election year and the prior year). These matches are the strongest because the invention and donation occur close in time. Second, I stratified the remaining data (after purging matches from the first step) by state and repeated the matching for inventors in all states except California, New York, and Texas. These results introduce the possibility of more error because the acts of invention and donation are not close in time. But it captures instances where, for example, an inventor at Microsoft who lives in Washington and stays in Washington applies for a patent in, say, 1991 but does not donate to a campaign until, say, 2008. Third, and finally, for the remaining data in California, New York, and Texas, I stratified by both state and the first letter of the inventor’s last name. Without this further stratification for these three large states, probabilistic matching was not computationally feasible.
The administrators of both the Patentsview and the DIME data sets have run their own disambiguation algorithms to generate unique identifiers for inventors (in Patentsview) and donors (in DIME). To ensure a higher quality of matching, I kept only those high probability matches where both datasets agreed that the match identified a unique individual. In other words, I abandoned instances where a single DIME identifier was matched to more than one Patentsview identifier and vice versa. This produced a dataset of 30,603 American inventors who contributed to a political campaign from 1979 through 2014.
Once inventor-donors are matched in this fashion, it is possible to use the unique identifiers in both data set to construct an invention record, containing data on all patents applied for by these inventor-donors from 1979-2019, and a donor record, containing data on all campaign contributions made by these inventor-donors from 1979-2014. Below, I focus exclusively on analyzing the donor record of American inventor-donors. Footnote 56 I also confine the donor record to campaign contributions made in all federal elections from the 1980 cycle through the 2014 cycle. The donor and recipient party coding in the DIME database appear to be a mix of FEC codes and legacy Voteview codes. In the analysis below, I re-coded the recipient types as Democratic candidates and committees, Republican candidates and committees, and political actions committees of unknown partisan affiliation (PAC-UPAs) and ignored contributions to other partisan entities (which were not substantial in any time period). PAC-UPAs are committees that either do not have a partisan designation in the underlying DIME data, do not have an ideological score or have a “middling” ideological score (greater than −0.5 and less than 0.5) which makes it difficult to impute a partisan tendency based on donation patterns, and do not have the text strings “Republican” or “Democrat” in their name.
The DIME dataset does not have disambiguated firm or organizational identifiers, and it is problematic to use those provided in the Patentsview dataset for several reasons. I therefore implemented my own name matching between the self-reported employer listed in the donation record of American inventor-donors and the organizations in Standard & Poor’s Capital IQ database. To execute this third step, I first excluded instances where the DIME employer was missing or appeared to be conflated with occupation or employment status (CEO, engineer, retired, etc.). I then ranked the remaining employer names in descending order by the number of inventor donations (not the dollar amount) associated with that employer. I fed all of these names into Capital IQ’s proprietary lookup algorithm to generate a suggested match and then audited the matches in two steps. First, because the top 2,212 of these names account for roughly 74.6 percent of all inventor donations across all election cycles, I manually audited the proposed matches, leading to 2,050 valid matches. For the remaining results, I implemented a relatively soft constraint on name similarity: that the DIME employer name and Capital IQ organization name had a Jaro-Winkler distance less than or equal to 0.15, which produced another 21,204 matches. Footnote 57 Together, these 23,254 self-reported employer names were linked to 14,735 unique organizations with Capital IQ identifiers.
The matching analysis implemented in Section “Construction of the Dataset” utilizes the subset of inventor-donor data where the DIME employer was linked to a Capital IQ organization through one of these 23,254 matches. Table A1 presents some summary statistics about this subset of the inventor-donor data for each election cycle. The second column shows the total number of donors in the DIME database in thousands. The third column shows the percentage of all donors that are inventor-donors, which varies over time between 0.5 and 2.4 percent of all donors. The fourth column shows the percentage of all donors that are linked to Capital IQ organizations. It reveals that the link between DIME employers and Capital IQ organizations is weakest in the 1980s, which is to be expected given that the Capital IQ database has the best coverage from the mid-1990s to the present. The fifth column shows the share of all donors that are linked to Capital IQ organizations that are inventor-donors, which essentially defines the pool of inventor-donors eligible for matching. It shows that the linking to Capital IQ organizations slightly reduces the share of inventors compared to all donors (column three) in the 1980s, that there is no relative loss in the 1990s, and that the linking slightly reduces the relative share of non-inventors from 2000 to 2014. But it does not do so dramatically in any election cycle. The sixth column shows the number of inventor-donors that were matched to non-inventor donors by organization, Congressional District, and imputed gender, and the seventh columns shows the matching success rate, which is number of matched inventor-donors as a share of inventor-donors linked to Capital IQ organizations. It shows that matching succeeds in 20-31 percent of cases in the 1980s, 35–44 percent of cases in the 1990s, and in 56–67 percent of cases from 2002 to 2014.
Summary of the inventor-donor dataset

Note: This table presents basic summary statistics about the inventor-donor data set and the subset of that data linked to Capital IQ organizations used for the matching analysis in Section “Construction of the Dataset”. For each election cycle (column 1), it shows the total number of donors in the DIME data (column 2), the share of total donors that are inventors (column 3), the share of total donors and that are linked to Capital IQ organizations (column 4), and the share of donors linked to Capital IQ organizations that are also inventors (column 5). The last two columns show the number of inventor-donors matched to non-inventor donors by firm, gender, and Congressional District (column 6) and the matching success rate as a share of inventor-donors linked to Capital IQ organizations (column 7).
The ANOVA analysis implemented in Section “Analysis” is slightly different. Here, the goal is to understand whether polarization is increasing among knowledge economy workers who contribute to Democrats even if that organization’s inventors do not donate. For this exercise, carried out only in the 1992 and 2012 election cycles, I supplemented the data set with data on non-inventor donors at known IP producers. Specifically, I used patent data to first identify all IP producers (any organization that was issued a patent) from 1987-1991 and from 2007-2011 (the five years prior to each relevant election year). I then linked self-reported DIME employers to these IP producers and, for those employers not already matched above, I linked the IP producer names to Capital IQ firm names. This allowed me to link DIME employers to an additional 887 Capital IQ organizations in 1992 and an additional 7,200 Capital IQ organizations in 2012. These organizations produced IP in the years leading up to the election cycle and had employees who donated in federal elections but did not have inventor-donors who made contributions.
Table ?? characterizes the data set used in the ANOVA analysis. For each election cycle, column 2 shows the total number of donors in the DIME data and column 3 shows the share of those donors (inventors and non-inventor employees at IP producers) that are linked to Capital IQ organizations. Columns four through six show the number of organizations, Congressional Districts, and industries (4-digit SIC codes) that are represented in this data set. As shown, the data set covers virtually all Congressional Districts in each election cycle, Footnote 58 and captures data on donors from 957 organizations in 339 industries in 1992 and 6,038 organizations in 714 industries in 2012.
A.2 ANOVA Analysis Motivation and Details
This variance decomposition described in the paper was predicated upon and modeled after similar analyses conducted in prominent studies of rising wage inequality. Footnote 59 In those studies, the question was whether increasing wage inequality—reflected by an increasing variance in the overall wage distribution over time—was best explained by changes between firms, with the average wages of some superior firms pulling away from the average wages of their competitors, or within firms, with executive pay (for example) pulling away from pay for administrative staff across many firms.
Here, the phenomenon to explain is not increasing variance in the wage distribution over time but decreasing variance in the ideology distribution over time among knowledge economy workers that give to Democratic candidates and committees. To determine whether geographic or firm-level shifts are driving the declining ideological variance among Democratic inventors, I implemented a Bayesian form of ANOVA decomposition for each subset of knowledge economy workers in the 1992 and 2012 election cycles using the runjags library in R. Footnote 60 Specifically, I fit the following non-nested hierarchical model to each data set in each election cycle:
 $${y_i}\sim {\cal N}\left( {_{j\left[ i \right]} + {b_{k\left[ i \right]}},\sigma _y^2} \right)$$
 $${a_j}\sim {\cal N}\left( {0,\sigma _a^2} \right)$$
 $${b_j}\sim {\cal N}\left( {0,\sigma _b^2} \right)$$
Here yi represents the ideology score for donor i residing in Congressional District j[i] and working at organization k[i]. The estimated standard deviations, σa, σb, σy can be interpreted as point estimates of the variation in the average ideology across districts, the average ideology across organizations, and the residual variation within districts and organizations, respectively. Following Gelman and Hill, I report finite population empirical standard deviations since there is no super-population of Congressional Districts beyond those observed in the data, though this choice does not impact the results. Footnote 61
A Bayesian form of ANOVA is preferable, here, because the goal is not to test whether the batches of coefficients for Congressional Districts and organizations, a j[i] and b k[i], are statistically significant sources of variation in ideology among Democratic knowledge economy workers. Both variables are highly significant in this respect in both election cycles. The goal is rather to precisely estimate (and efficiently compute) the amount of observed variation between the batch of district effects and organization effects in each period, and the residual variation within both districts and organizations, and determine which plausibly explains the overall decline in the variance of ideology scores among Democratic knowledge economy workers.
A.3 Regression Output
Regression results for ideology model—full matched datase

Note: This table shows the results of regressing common factor (CF) ideology scores on a binary variable indicating whether the donor is an inventor in the matched inventor data set (as described in Sections “PriorWork and Hypotheses” and “Construction of the Dataset”) for each election cycle from 1980-2014.
*p < 0.1; **p < 0.05; ***p < 0.01.
Regression output for ideology model—switchers

Note: This table shows the results of regressing common factor (CF) ideology scores on a binary variable indicating whether the donor is an inventor among switchers (as described in Sections “PriorWork and Hypotheses” and “Construction of the Dataset”) for each election cycle from 1980-2014.
*p < 0.1; **p < 0.05; ***p < 0.01.
Regression results for democratic donor model—full matched dataset

Note: This table shows the results of regressing a binary variable indicating whether the donor contributed to a Democratic candidate or committee on a binary variable indicating whether the donor is an inventor in the full matched dataset (as described in Sections “PriorWork and Hypotheses” and “Construction of the Dataset”) for each election cycle from 1980-2014.
*p < 0.1; **p < 0.05; ***p < 0.01.
Regression results for democratic donor model—switchers

Note: This table shows the results of regressing a binary variable indicating whether the donor contributed to a Democratic candidate or committee on a binary variable indicating whether the donor is an inventor among switchers (as described in Sections 2 and 3) for each election cycle from 1980-2014.
*p < 0.1; **p < 0.05; ***p < 0.01.
Regression results for democratic share model—full matched dataset

Note: This table shows the results of regressing the share of donations given to Democratic candidates and committees on a binary variable indicating whether the donor is an inventor (inventor) and a binary variable indicating whether the donor contributed to a Democratic candidate or committee (dem_donor). Conditional on being a Democratic donor, it captures the difference between inventors and non-inventors in the share of total contributions made to Democratic candidates and committees. The regressions were run in the full matched dataset (as described in Sections “PriorWork and Hypotheses” and “Construction of the Dataset”) for each election cycle from 1980-2014.
*p < 0.1; **p < 0.05; ***p < 0.01.
Regression results for democratic share model—switchers

Note: This table shows the results of regressing the share of donations given to Democratic candidates and committees on a binary variable indicating whether the donor is an inventor (inventor) and a binary variable indicating whether the donor contributed to a Democratic candidate or committee (dem_donor). Conditional on being a Democratic donor, it captures the difference between inventors and non-inventors in the share of total contributions made to Democratic candidates and committees. The regressions were run among switchers (as described in Sections “Prior Work and Hypotheses” and “Construction of the Dataset”) for each election cycle from 1980-2014.
*p < 0.1; **p < 0.05; ***p < 0.01.
Regression results for republican share model—full matched dataset

Note: This table shows the results of regressing the share of donations given to Republican candidates or committees on a binary variable indicating whether the donor is an inventor (inventor) and a binary variable indicating whether the donor contributed to a Democratic candidate or committee (dem_donor). Conditional on being a Democratic donor, it captures the difference between inventors and non-inventors in the share of contributions made to Republican candidates and committees. The regressions were run in the full matched dataset (as described in Sections “Prior Work and Hypotheses” and “Construction of the Dataset”) for each election cycle from 1980-2014.
*p < 0.1; **p < 0.05; ***p < 0.01.
Regression results for republican share model—switchers

Note: This table shows the results of regressing the share of donations given to Republican candidates or committees on a binary variable indicating whether the donor is an inventor (inventor) and a binary variable indicating whether the donor contributed to a Democratic candidate or committee (dem_donor). Conditional on being a Democratic donor, it captures the difference between inventors and non-inventors in the share of contributions made to Republican candidates and committees. The regressions were run among switchers (as described in Sections “Prior Work and Hypotheses” and “Construction of the Dataset”) for each election cycle from 1980-2014.
*p < 0.1; **p < 0.05; ***p < 0.01.
Regression results for PAC-UPA share model—full matched dataset

Note: This table shows the results of regressing the share of donations given to PAC-UPAs (PACs of unknown partisan affiliation) on a binary variable indicating whether the donor is an inventor (inventor) and a binary variable indicating whether the donor contributed to a Democratic candidate or committee (dem_donor). Conditional on being a Democratic donor, it captures the difference between inventors and non-inventors in the share of contributions made to PAC-UPAs. The regressions were run in the full matched dataset (as described in Sections “Prior Work and Hypotheses” and “Construction of the Dataset”) for each election cycle from 1980-2014.
*p < 0.1; **p < 0.05; ***p < 0.01.
Regression results for PAC-UPA share model—switchers

Note: This table shows the results of regressing the share of donations given to PAC-UPAs (PACs of unknown partisan affiliation) on a binary variable indicating whether the donor is an inventor (inventor) and a binary variable indicating whether the donor contributed to a Democratic candidate or committee (dem_donor). Conditional on being a Democratic donor, it captures the difference between inventors and non-inventors in the share of contributions made to PAC-UPAs. The regressions were run among swtichers (as described in Sections “PriorWork and Hypotheses” and “Construction of the Dataset”) for each election cycle from 1980-2014.
*p < 0.1; **p < 0.05; ***p < 0.01.


 Open access