

Introduction
In practice, an optimisation program is used to formulate commercial diets to meet the minimum nutrient constraints in order to minimise feed costs. With phytase, potentially unjustifiable high contributions will result in reduction of safety margins or even lead to nutrient and energy deficiencies with a negative impact on animal performance. When applying values, it is important to understand that it is not possible to compare matrices from different phytases directly. This is because varying methodologies are used by phytase suppliers to determine the matrix values.
For example, the phosphorus equivalence for 500 FTU/kg of first generation fungal 3-phytase (produced from A. niger) was evaluated in many research studies using different assessment criteria. It was recommended that 500 FTU/kg of this phytase can replace 0.80 g dP, 1.00 g P from monocalcium P (MCP) and 1.15 g P from dicalcium P (DCP) (https://nutrition.basf.com/en/Animal-nutrition/Natuphos.html). Since then, new phytases have been developed. For example, E. coli-sourced 6-phytase was marketed in the early 2000s, and had a higher efficacy than the first generation commercially available fungal 3-phytase (Tran et al., Reference Tran, Hatti-Kaul, Dalsgaard and Yu2011; Rodriguez et al., Reference Rodriguez, Han and Lei1999a, Reference Rodriguez, Han and Leib). Today, new generation phytases are available and studies have shown that not all phytases are the same for efficacy in the gastrointestinal tract (GIT) of pigs and poultry (Plumstead et al., Reference Plumstead, Kwakernaak and van der Klis2012; Menezes-Blackburn et al., Reference Menezes-Blackburn, Gabler and Greiner2015). Historically, standard phytase activity (conventionally expressed as FTU, sometimes FYT and OTU) has been measured at pH 5.5, and all feed phytases, whether older or newer versions, have been applied in animal feed based on such activity (e.g. 500 FTU/kg) at this pH. Menezes-Blackburn et al. (Reference Menezes-Blackburn, Gabler and Greiner2015) evaluated the efficacy of seven commercial phytases in an in vitro assay and observed that they had different pH optima and efficacy in degrading inositol hexaphosphate (IP6) in the different sections of the GIT. For example, maximum activity for E. coli and Citrobacter phytases are seen in the range of pH 4-5; the first generation fungal phytase at pH 5.5, and new generation bacterial phytases (Buttiauxella-origin) at pH 3, whereby relative activity at pH 3.0 was 235% of the activity at pH 5.5).
As shown in Table 1, the measured activity at pH 3.0 can be remarkably different among these commercial phytases, ranging from 56% to 235% when expressed as relative activity of that found at pH 5.5. Clearly, this indicates differences in activity within the wide pH range in the stomach, gizzard and proventriculus and results in differences in IP6 degradation rate and different phosphorus matrix values.
Some examples of current commercially available 3- and 6-phytase and their pH optima***

* Adapted from Lei et al (Reference Lei, Weaver, Mullaney, Ullah and Azain2013) with modifications; †, 3 or 6 phytase
†† standard activity measurement (FTU) is performed at pH 5.5 (ISO 30024. 2009), the optimal pH of phytases denoted with # represents the range in pH at which the activity of the phytase exceeds the activity at pH 5.5 based on an in vitro test by DuPont laboratory (Christensen et al., Reference Christensen, Mejldal, Romero and Dersjant-Li2017)
¶ Activity at pH 3.0 expressed as % relative activity of pH 5.5 (Menezes-Blackburn et al., Reference Menezes-Blackburn, Gabler and Greiner2015)
‡ Phytase activity needed to achieve 50% reduction in IP6, with high buffer volume
** Unpublished data (Ralf Greiner, personal communications)
*** Other biochemical properties such as Km, Kcat are not included in this Table, as these parameters are measured as per g pour enzyme protein, not on per FTU basis. Phytase is applied in feed based on FTU, not per g protein
Table 1 represents only a few of the currently available commercial phytases, there are also other phytases in the market including phytases produced in China and India that are commercially in Asia, and a new phytase with trade name Phytaverse from Novus, however, due to that these phytases are not available in EU and most of other countries and limited information is available on these phytases, so they are not included in the Table.
Various phytase matrices for nutrient and energy values are recommended by the different phytase suppliers. However, it is important to understand that matrix values are not comparable when different methodologies are used to determine matrix values. This will help the nutritionists to apply specific matrix values with confidence in feed formulation. This paper discusses and compares the different methodologies used to determine phytase matrix values.
Phosphorus (P) matrix terminology and methodology
Terminology relating to phytase activity
Various terminology has evolved over time relating to matrix values for phytase activity. Total P (tP) includes all P in a feed as chemically analysed. The available P definition can differ substantially, and there are many different terms used to describe the phosphorus requirement and response in poultry and pigs. Available P (aP or AvP) is the amount in the diet that can be utilised to cover the animals’ requirement under marginal P supply conditions (Rodehutscord, Reference Rodehutscord2009). The definition of AvP differs, however, whereby NRC (1994) considers only non-phytate P equal to AvP as compared to the German system uses AvP at a level 70% of the non-phytate P (Rodehutscord, Reference Rodehutscord2013). Phytate P (PP) is the total in the form of phytic acid (myo-inositol ring bound to six phosphates, IP6 and lower IP esters) and its salts (called phytate). Non-phytate P (nPP) is the difference between tP and PP, and Retainable P (rP) is the proportion of total P intake deposited in the body (P intake – faecal and urinary excretion). Apparent dP can be defined as apparent ileal dP (AID P), which is the proportion of total intake absorbed at the end of the ileum by the bird or pig, or the total tract dP (ATTD P), which is the proportion of intake that is not excreted in the faeces (or excreta for poultry). True P digestibility is determined as the apparent digestibility corrected for total endogenous losses from the gut lining. Standardised total tract dP (STTD P) is determined by correction for the basal endogenous loss, not corrected for the endogenous loss related to feed ingredients. This is done by using a P free diet to determine the basal P losses.
Matrix methodology
Phytase is the most commonly used feed enzyme in poultry and pig feeds globally, with the main objective of breaking down phytate and increasing the availability of phytate P. This allows reduction of inorganic P use in feed formulations and contributes to a decrease in P excretion. The P matrix is developed to assign a contribution (available P based on MCP or other inorganic sources, equivalence or dP based ileal absorbed P) for a given unit of phytase addition.
Direct measurement for digestible P improvement matrix values
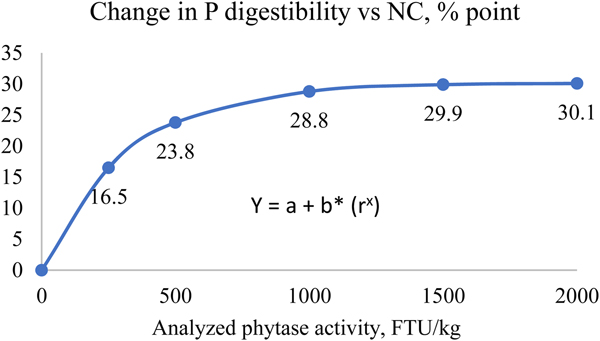
This method provides dP improvement values from in vivo trials using practical diets representative of commercial feeds. For the direct measurement, a negative control (NC) diet is formulated to be deficient in P, and is then supplemented with exogenous phytase in incremental amounts. Ileal or total tract P digestibility is measured using either an indirect marker or by a total collection of faeces. The dP matrix value is calculated as the improvement in dP in phytase treatments above the negative control group directly due to the addition of phytase. This method estimates the disappearance of P using a marker by the terminal ileum, which is the amount P absorbed by the animal but does not include the P released from phytate that may not have been absorbed. As a result, this method may underestimate the dP values if the birds in NC group were fed test diets for a long period of time, as the birds may adapt to the deficiency and increase their P digestibility of the basal diets (Li et al., Reference Li, Angel, Kim, Jimenez-Moreno, Proszkowiec-Weglarz and Plumstead2014). In addition, dietary components such as phytate, Ca and non-phytate P levels can influence dP improvements by phytase (Tamim et al., Reference Tamim, Angel and Christman2004; Amerah et al., Reference Amerah, Plumstead, Barnard and Kumar2014). For example, Tamim et al. (Reference Tamim, Angel and Christman2004) showed that addition of 0.5% Ca from limestone reduced ileal P digestibility by 38.5% point compared to a control diet without added limestone in the absence of phytase. Addition of an A. niger phytase at 500 FTU improved dP by 7.2% point and 21% point vs. the control, in diets without and with added limestone respectively. In addition, there are some inconsistencies between different labs on dP measurements (Rodehutscord, Reference Rodehutscord2013). However, these factors can have an impact on dP levels in both control and phytase treatment groups, and may have a smaller impact on the improvement values. Nevertheless, to derive a reliable dP value, large numbers of studies are required to generate representative data. Such trials should be conducted with feed formulations characteristic of global commercial situations for the given species, with the test phytase added at different doses. These data must then be analysed to determine the P matrix values at different phytase doses using a non-linear/exponential curve. Figure 1 provides an example of a response curve for P digestibility with increasing phytase dose.
Example of using modelling to determine P release based on the improvement of P digestibility vs NC (can be done for other parameters as well). Y: response parameter, a: asymptote value, b: maximum increment (a-b = response at x = 0), r: curve coefficient, x: analysed phytase dose. *data are based on 14 trial studies in pigs with inclusion of a Buttiauxella phytase.

For the curve fitting analysis, the analysed phytase doses must be used, allowing the dP contribution at different phytase doses to be calculated.
Indirect measurements for available P equivalence
This method is used to calculate available P equivalence by phytase relative to a reference source (such as MCP) which is measured using a biological response criterion (usually tibia ash or metacarpal ash, but may include BWG and FCR).
With this method when using an inorganic standard, a negative control diet is formulated to be (highly) deficient in P, which is supplemented either with inorganic P (e.g. MCP) or exogenous phytase. MCP is added in graded levels to provide nPP to the NC diet. Next, AvP or P equivalence is calculated, shown in Figure 2.
Illustration of a method used to determine ‘Available P’ or ‘P equivalence’ relative to an inorganic P standard (MCP) using tibia ash as response parameter (Li et al., Reference Li, Angel, Proszkowiec-Weglarz, Kim, Jiménez-Moreno and Plumstead2013). Broilers at 21 days of age fed corn and SBM based diets.
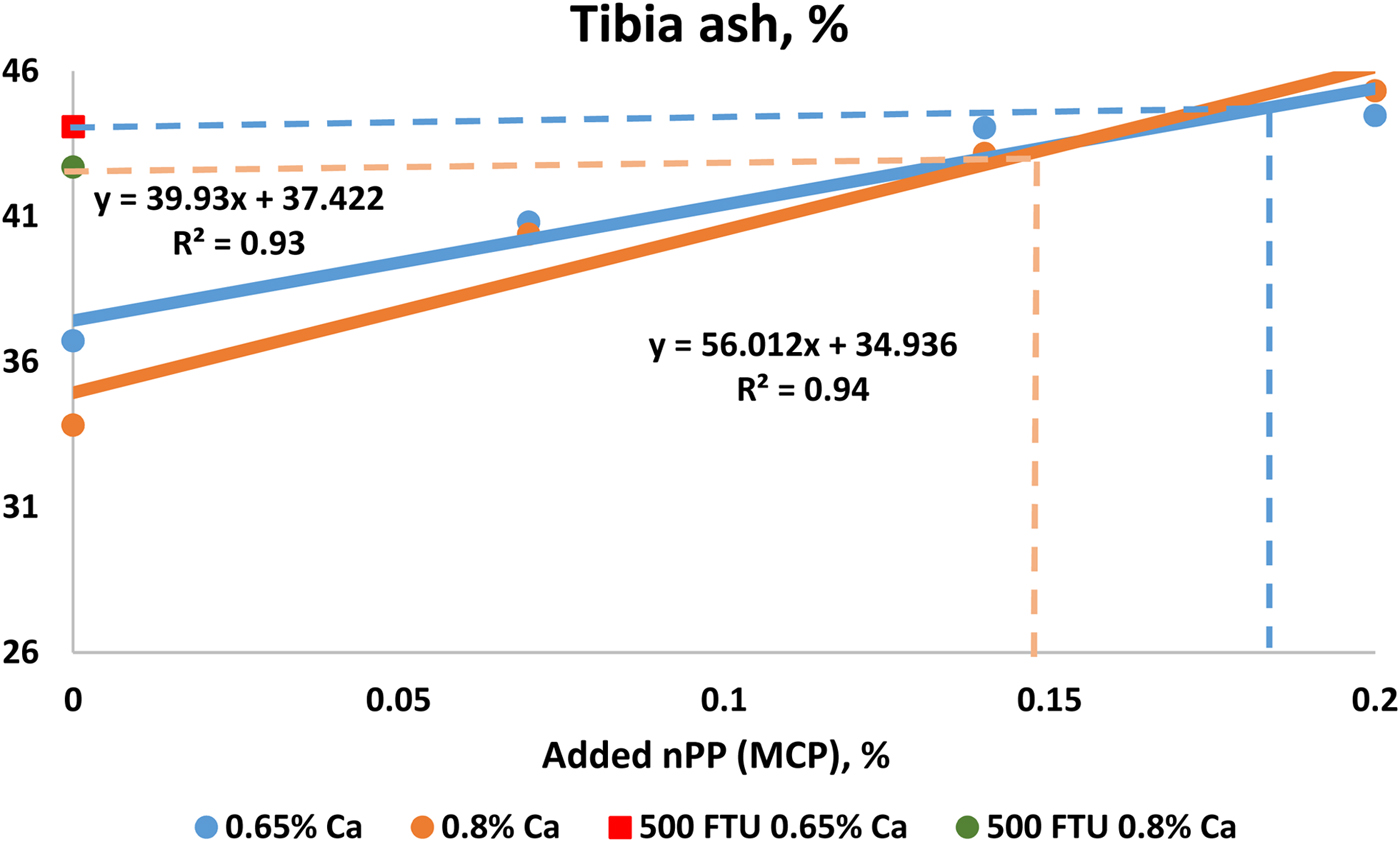
A linear regression (this method is only valid if the response is in the linear phase) can be established using different response parameters such as tibia ash in relation to increasing inorganic P levels (such as from MCP). Additionally, besides tibia ash, a different assessment criterion can be used, such as tibia weight, BWG, FCR and dP (Adedokun et al., Reference Adedokun, Sands and Adeola2004). Using different response criteria will result in different estimated AvP values for a given phytase dose, even within the same study. AvP equivalence is provided by this method – essentially when using nPP from MCP or other inorganic P standard in the trial. Using different inorganic sources may also result in different AvP equivalence values. Li et al. (Reference Li, Angel, Kim, Jimenez-Moreno, Proszkowiec-Weglarz and Plumstead2015) showed that using tibia ash weight or percentage as response criteria resulted in different nPP equivalence values, for example, this was estimated as 0.117% and 0.168% based on tibia ash (%) and tibia ash weight (mg/tibia) respectively with addition of 500 FTU/kg phytase. In addition, dietary composition such as Ca level can have a great impact on the P equivalence. Using Figure 2 as an example, in a diet containing 0.65% Ca, the tibia ash in the 500 FTU/kg Buttiauxella phytase treatment was 44%, hence the P equivalence was determined as being 0.15% AvP (P added from MCP). However, the AvP matrix at 500 FTU/kg would be 0.18% with dietary Ca at 0.8% (Li et al., Reference Li, Angel, Proszkowiec-Weglarz, Kim, Jiménez-Moreno and Plumstead2013). This illustrates that, for the indirect measurement method, it is critical to establish a response curve for each individual study, since it would not be correct to generate one standard response curve and apply the equation to data collected from different studies.
The indirect method provides P equivalency values presented as AvP since there is an assumption that P in the used organic P sources is 100% available, which is not always the case. Phytase increases P availability from phytate, reduces the anti-nutritional effect of phytate and increases the availability/utilisation of other minerals, amino acids (AA - which is related to the activity of phytase in upper GIT and dietary composition) and energy, known as the extra-phosphoric effect (Selle et al., Reference Selle, Ravindran, Caldwell and Bryden2000). However, the indirect measurement cannot separate the phosphoric and extra-phosphoric effects on performance parameters (such as BWG and FCR) and thus, the ‘available P equivalence’, calculated using response criteria other than tibia ash, may be an over-estimation of the actual phytase response value. In addition, final values are highly influenced by the nutritional quality (P availability) of the inorganic source used and Ca levels, as mentioned earlier.
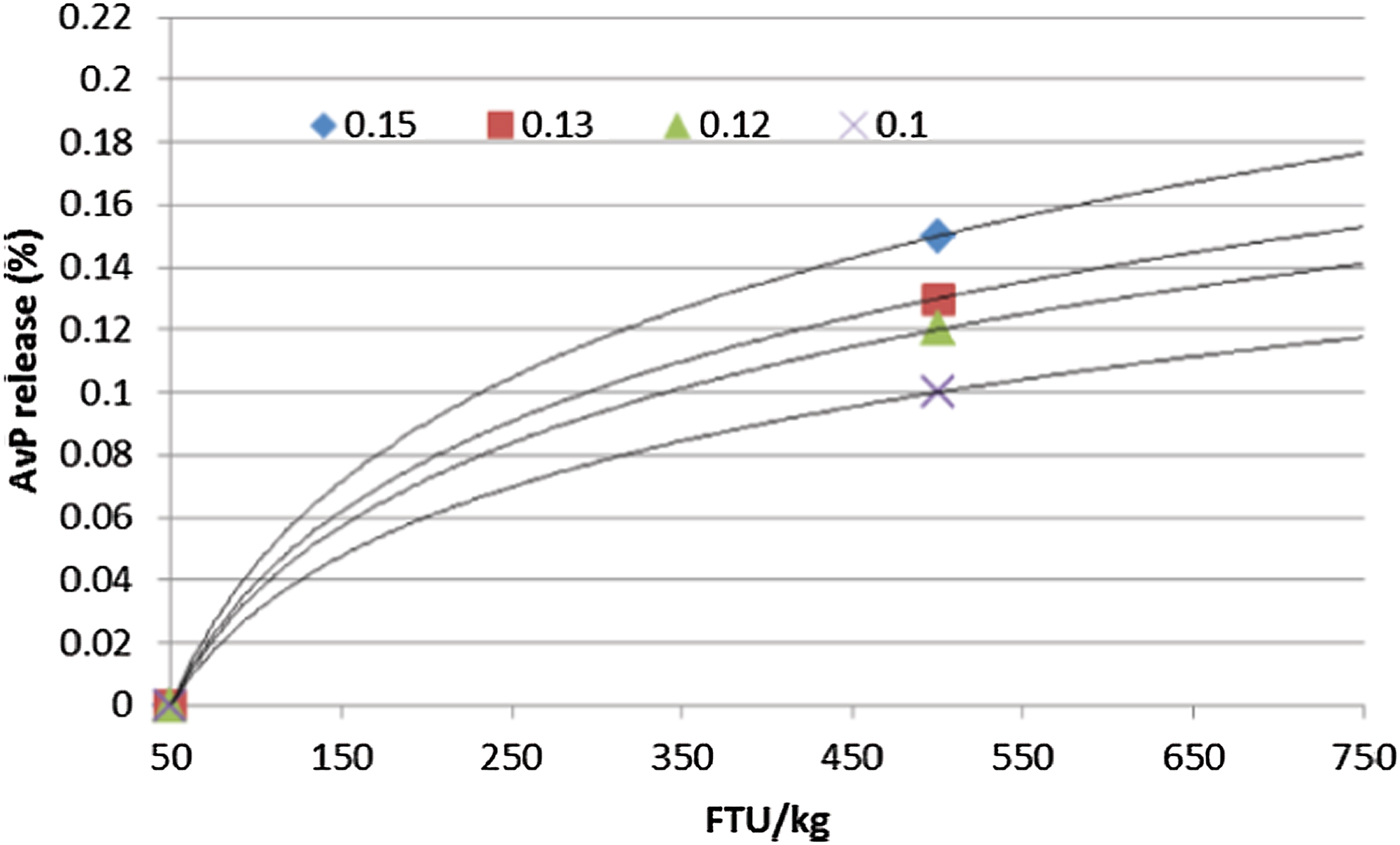
Using a log linear curve to determine matrix at high doses can also be applied. Many research studies have been done to determine P equivalence for first generation phytases whereby dose response was used and equivalence was determined. The relationship between phytase doses and biological response has been established as log-linear, i.e. a logarithmic increase in dose is required to maintain a linear increment in response (Rosen, Reference Rosen2001; Rosen, Reference Rosen, Garnsworthy and Wiseman2002). It has been suggested that all phytases will follow the same log linear curve, but the slope of the curve may be different (Bedford et al., Reference Bedford, Walk and Masey O'Neill2016). Thus, if the matrix value at 500 FTU/kg is determined, the response at a higher dose can be calculated based on the log linear slope (Figure 3) where the AvP matrix is 30% higher at 1000 FTU/kg compared to 500 FTU/kg.
Relationship between dose of phytase and P release for phytases differing in 500 FTU/kg AvP matrix (Bedford et al., Reference Bedford, Walk and Masey O'Neill2016)
However, the Rosen (Reference Rosen2001) models were based only on phosphorus and published using mainly first generation fungal 3-phytase data. Over the last 20 years, there have been significant changes in animal genetics, growth rate, dietary composition (phytate source and levels). In addition, different phytases have different efficacy and phytate degradation rates. Therefore, it may be argued that the same response slope (e.g. same curve shape) may not apply to different generations of phytases or for different response parameters such as digestible AA (dAA) and apparent metabolisable energy (AME).
In summary, both direct measurement of dP improvement and tibia ash methods are valid, however, the matrix values determined by different methodologies can vary. In general, the values determined based on a large number of in vivo studies are more representative than those from a few studies, or from calculated values. The direct measurement of dP improvement is a more conservative method, which tends to under-estimate its matrix values. In this case, no safety margin is needed. However, the indirect measurement, when using tibia ash as a reference, may provide a greater value P equivalence than the direct measurement.
For example, from a study in weaning pigs, Radcliffe and Kornegay (Reference Radcliffe and Kornegay1998) reported that, based on linear or nonlinear response equations for ADG, P digestibility, rib ash weight and shear force, 500 U/kg of microbial phytase (from A. niger) was equivalent to 1.03, 0.78, 0.89, and 0.69 g of inorganic P, respectively. Thus, using bone ash as the response parameter resulted in 14% higher P equivalent values compared to using dig P as the response parameter. However, this estimate is based on linear or non-linear equations using the inorganic P standard curve. The reported dP values were 21.5% and 35.4% respectively in the NC and 500 FTU/kg phytase treatment, leading to a dP improvement of 13.9% point with 500 FTU phytase. The analysed dietary P content was 0.328%, Thus the calculated improvement (using the direct method) above NC would be 0.46 g/kg. The data from this study illustrated that using the indirect method resulted in nearly two times higher P equivalence compared to the direct measurement.
Digestible P to AvP conversion factor
Phytase P contribution can be expressed as either dP improvement or AvP equivalence (AvP values are used in feed formulations, especially for poultry, in some regions). Using the direct method to measure improvements, dP needs to be converted to AvP. Conversely, when using the indirect method to calculate P equivalence, AvP needs to be converted to dP. However, the conversion factor to determine AvP from dP (or vice versa) may differ when a different inorganic P source is used. Different dP to AvP conversion ratios have been used by different phytase producers, and this has led to different matrix values. Therefore, when applying matrix values, it is important to understand the difference between measured and calculated values. For example, when using direct measurements, dP matrix is the measured value and AvP is the calculated value. When using indirect measurement, AvP is the estimated value and dP is the calculated value.
Digestible AA and energy matrices methodology
Similar to the P matrix determination, the dAA and AME matrix determination can be more complex. Ideally, these values can be measured as a direct measurement of dAA and AME improvement in animals receiving phytase at different doses above any respective negative control. However, ileal dAA studies are expensive and time consuming, so indirect methods may be used to estimate or calculate dAA and energy matrices, based on increased efficacy compared to older generation phytase products.
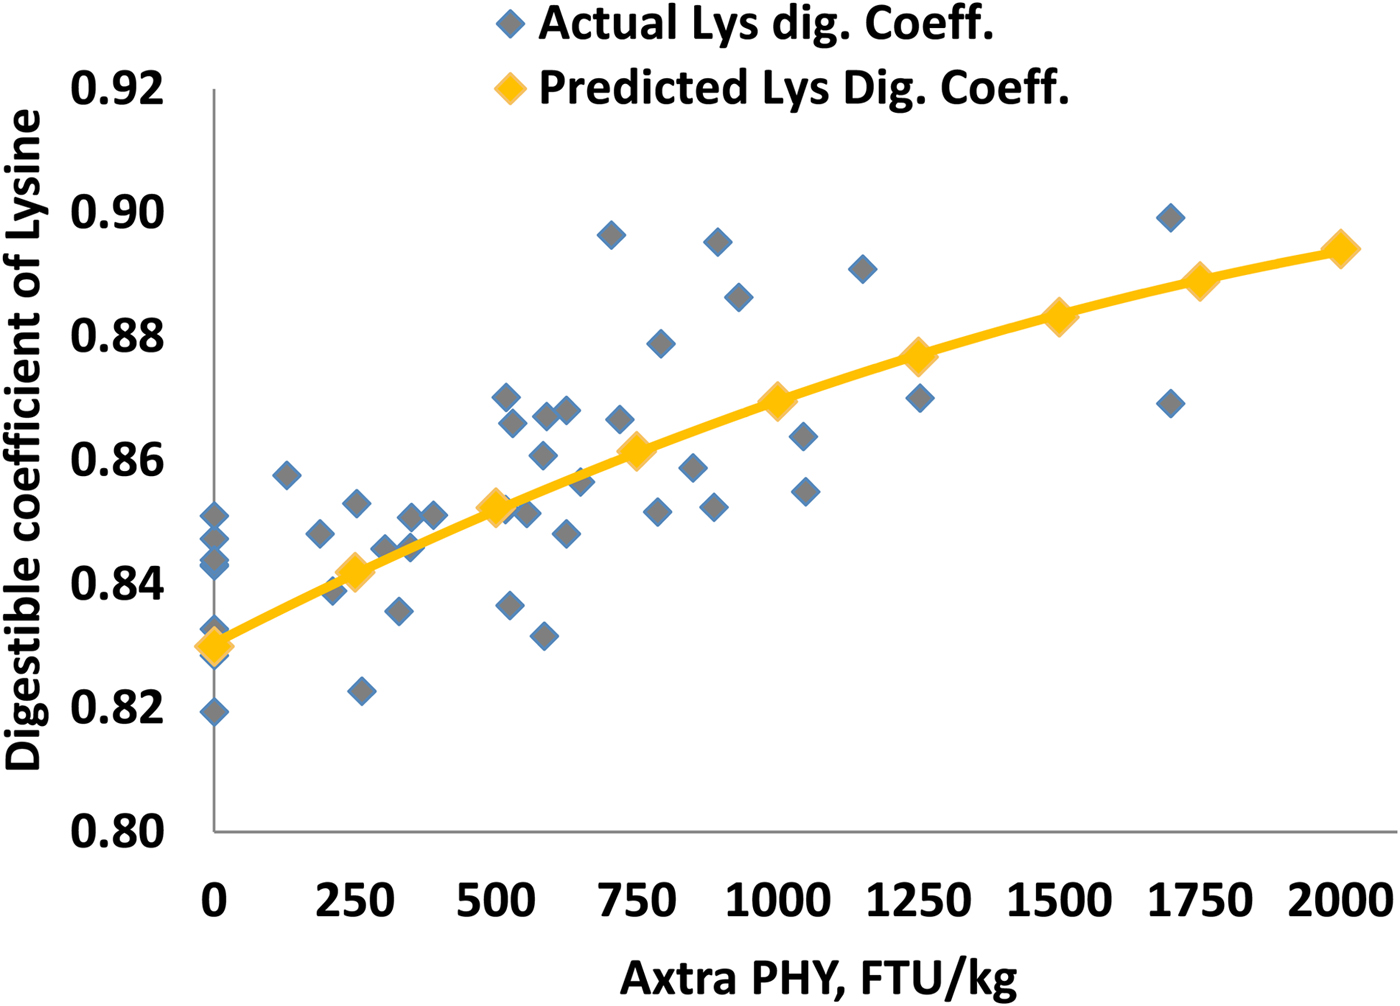
When using the direct method to derive a representative value, the dAA and AME matrix should be based on a large number of in vivo ileal dAA and AME studies. Each measurement should be for all individual AA and AME improvements vs. NC at different analysed phytase doses. The dose response for AME and each AA can be fitted to a linear or a curvilinear model to determine the individual matrices. One example of applying this methodology was reported by Plumstead et al. (Reference Plumstead, Sriperm and Swann2013), where dAA and AME matrix for Buttiauxella phytase were determined by modelling data from seven digestibility trials. Data (241 points) from seven ileal digestibility trials in Ross 308 or Cobb 500 broilers were collected and fitted to a non-linear model. The analysed phytase activity in the diets was in a range of 129–2346 FTU/kg. Diets were based mainly on corn/soybean meal and phytate P content varied from 0.24-0.26%. Ileal dAA was measured at 21 days of age. The matrix value for each individual AA was determined as the increase above NC and evaluated based on phytate levels in the diets. Figure 4 shows the predicted and actual measured lysine digestibility co-efficient from these trials. The same methodology was used for AME matrix determinations (Plumstead et al., Reference Plumstead, Sriperm and Swann2013). This method requires many in vivo studies that employ relevant practical diets used globally and provide more representative dAA and energy matrix values for a given phytase at specific dosages.
Predicted and actual measured Lys digestibility coefficient based on seven ileal digestible AA studies in broilers at 21 days of age (Plumstead et al., Reference Plumstead, Sriperm and Swann2013 presented at IPSF)
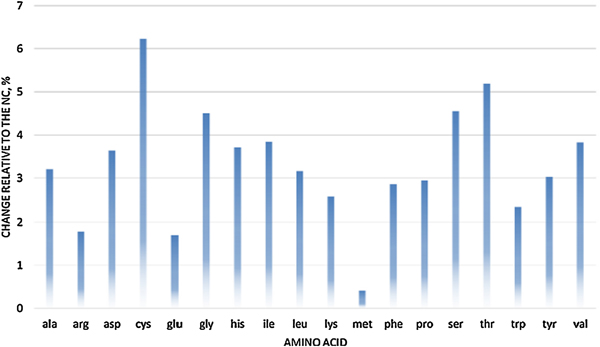
However, there is limited information available on how each phytase producer generates their digestible AA and AME matrix values and how many trials have been used to generate the values. In a recent review, Cowieson et al. (Reference Cowieson, Ruckebusch, Sorbara, Wilson, Guggenbuhl and Roos2017a) evaluated the effect of phytase on dAA based on a meta-analysis of 24 independent peer-reviewed papers in broilers, which included different types of phytases at doses ranging from 500 to 2000 FTU/kg. The effect of phytase on dAA was positively correlated to phytate degradation rate and negatively related to Ca:P ratio. A linear response in dAA improvement was seen for supplementation up to 1000 FTU/kg but the response plateaued afterwards. The authors concluded that, on average, phytase increased AA digestibility by 4.1% but the effect varied for different AAs, being greater for Cys, Thr, Ser, Gly and Val and lower for Arg, Glu and Met (Figure 5). These particular AA, which are strongly responsive to the effects of phytase, tend to be associated with endogenous secretions.
Effect of phytase on apparent ileal AA digestibility in broilers (changes relative to NC diet) based on meta-analysis of 24 independent peer-reviewed papers (Cowieson et al., Reference Cowieson, Ruckebusch, Sorbara, Wilson, Guggenbuhl and Roos2017a).

A similar review was done in pigs (Cowieson et al., Reference Cowieson, Ruckebusch, Sorbara, Wilson, Guggenbuhl, Tanadini and Roos2017b), based on a meta-analysis of 28 peer reviewed papers using different sources of phytase with a dose range from 500 to 20,000 FTU (mainly 500 and 1000 FTU), and it was estimated that the overall effect of microbial phytase on apparent ileal dAAd was 2.8%. More recently, Zouaoui et al. (Reference Zouaoui, Létourneau-Montminy and Guay2018) reviewed the effect of microbial phytase (mainly from A. niger, E. coli and P. lycii) on essential AA in pigs, based on meta-analysis of data from 34 papers and observed a linear or quadratic increase with increasing phytase dose, with the improvement maximised at 800 FTU/kg for most AA. At a dose of 500 FTU/kg, the dAA improvement was estimated to be 1.1% (for Met) to 2.9% (for Thr). The authors suggested that microbial phytase supplementation positively affected the apparent ileal digestibility of AA and this was not modified by other dietary components such as AA, Ca, phytic acid or fibre.
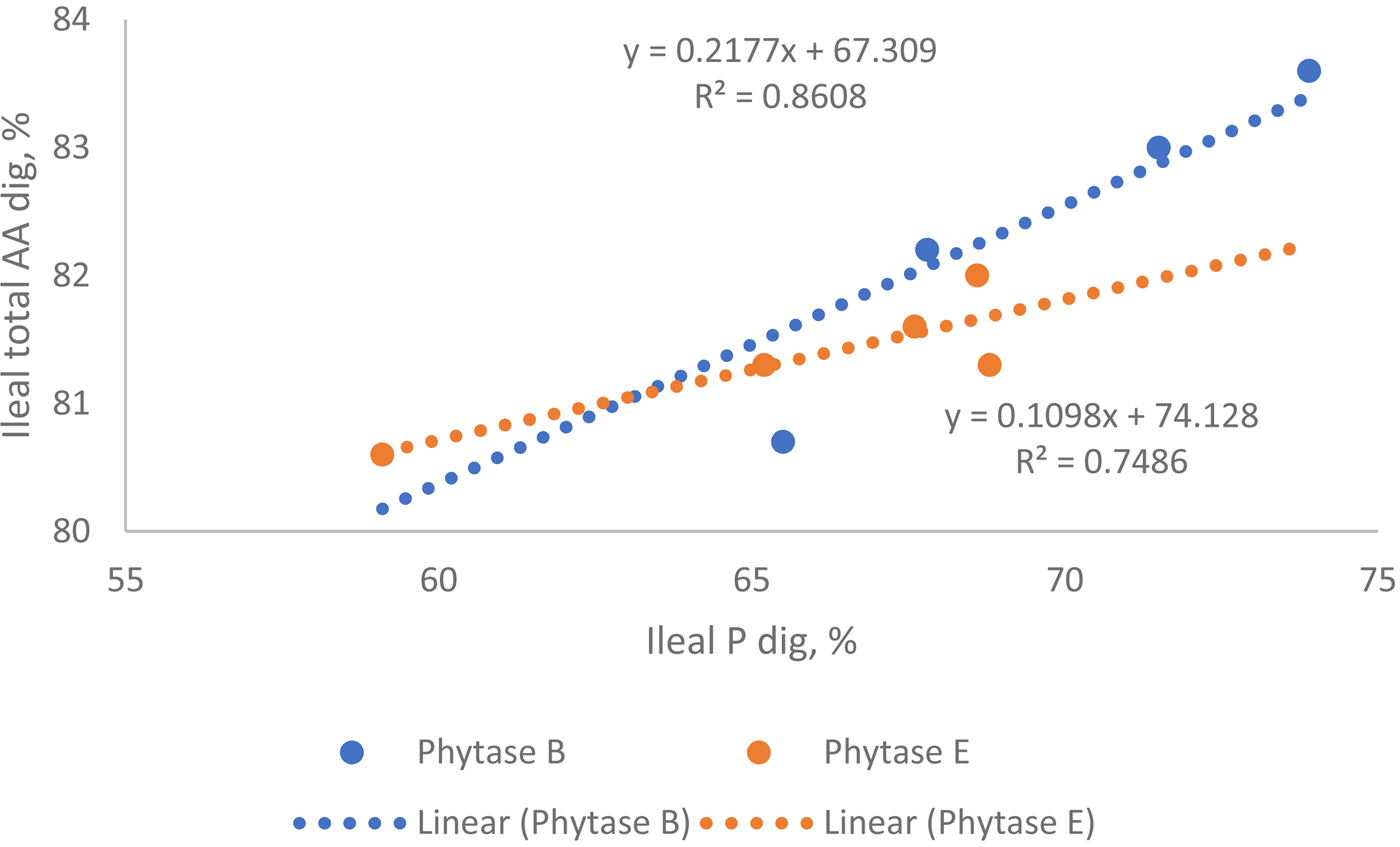
However, the effect of phytase on dAA appears to be inconsistent from published studies, which could be related to phytase sources or dietary composition. For example, in broilers, Amerah et al. (Reference Amerah, Plumstead, Barnard and Kumar2014) reported that a Buttiauxella phytase dosed at 1000 FTU improved total amino acid digestibility across four different Ca:AvP ratios in feed by 12.3% vs. NC in broilers. Li et al. (Reference Li, Angel, Kim, Jimenez-Moreno, Proszkowiec-Weglarz and Plumstead2015) observed that addition of Buttiauxella phytase at 1000 FTU/kg improved ileal dAA in broilers, by, on average, 3.1%, 5.7% and 6.9% in the diets containing 6.5, 8 and 9.5 g/kg Ca respectively. A comparison study in broilers showed that two different phytase sources, i.e. Buttiauxella or an E coli, showed different effectiveness on AA digestibility improvement on an equal FTU basis (Dersjant-Li and Kwakernaak, Reference Dersjant-Li and Kwakernaak2017). Interestingly, in this study, a linear relationship was found between ileal P and ileal total AA digestibility for Buttiauxella phytase (P<0.05) but not for E. coli phytase (P=0.15). In addition, the slope was two-times higher for Buttiauxella than E coli phytases, indicating that, even though different phytases have the same P release (may need different doses to get the same P release), they may not necessarily have the same impact on AA digestibility (Figure 6).
Relationships between ileal P digestibility and ileal total amino acids digestibility (n =17), in broilers at 21 days post-hatch. Phytase B: Buttiauxella phytase expressed in Trichoderma reesei in a dose range of 303 to 1046 FTU/kg; Phytase E: E. coli phytase expressed in Pichia pastoris in a dose range of 442 to 1811 FTU/kg. P linear (Buttiauxella phytase) = 0.028; P linear (E. coli phytase) = 0.15 (data derived from Dersjant-Li and Kwakernaak, Reference Dersjant-Li and Kwakernaak2017)
It is very costly and time consuming to use direct measurements to determine dAA and AME matrix values. One may use an assumption that the dAA and AME will follow the same response curve as phosphorus, thus using the same slope to calculate dAA and AME matrix values. However, phytase has different modes of action on P release and dAA improvements. The impact of phytase on dAA is an indirect effect mainly due to the elimination of anti-nutritional properties of phytate by cleaving IP6 down to IP5 or IP4 early in the digestive tract (i.e. by reducing the binding of IP6 to proteins and its consequent negative effect on digestion). In contrast, the effect of phytase on P is a direct effect of cleaving it from the phytate ring in the digestive tract. As the interaction between phytate and proteins starts in the upper GIT, a phytase product that is highly active at lower pH and has a wider pH range will be more effective in improving dAA than one with a less favourable activity profile. It was reported (Dersjant-Li and Kwakernaak, Reference Dersjant-Li and Kwakernaak2017) that, for broilers fed a corn and soybean meal-based diet with increasing Buttiauxella phytase levels up to 1000 FTU/kg, a curvilinear increase was observed for dP, while a linear increase was seen for dAA and AME, indicating that dAA and dig P do not follow the same response curve with increasing phytase dose.
In addition, the phytate to protein binding capacity and its ability to reduce protein-phytate complexes in feed are related to the dietary composition. For example, from an in vitro study, Kies et al. (Reference Kies, De Jonge, Kemme and Jongbloed2006) observed that the phytate-induced reductions in protein solubility at pH 3 were 47% for soybean meal, 32% for sunflower meal, 9% for rapeseed meal. The effect of phytase on breakdown of the protein-phytate complex was related to the type of feed ingredients, with higher efficacy for soybean meal and low efficacy for rapeseed meal. Therefore, the effect of phytase on dAA improvement could be related to dietary composition.
Consequently, the dAA and AME improvements should be measured using practical diets and be based on a large number of studies for each specific phytase, to establish more reliable dAA and AME matrix values.
Implications
Commercial phytases differ in their efficacy within the GIT of animals. Thus, the phosphorus contribution (i.e. P matrix value) of different phytases should also be different. In addition, since different phytase suppliers derive P equivalence (AvP) and dP improvement matrices by different methodologies, caution should be taken when comparing values supplied by different producers for various products.
The indirect measurements used to establish P equivalence matrix may need a smaller number of trials and therefore is quick and less expensive, but may over-estimate the values and a larger safety margin may need to be applied in the final formulation. The direct measurements require more in vivo trials and may under-estimate the matrix values and so do not need a safety margin applied. The matrix values are not comparable when different methodologies are used and nutritionists should be aware of this issue.
It is worth noting that dAA and energy matrix values may be derived from either in vivo trials data or by calculation, e.g. assuming a percentage improvement vs. an older generation phytase.
For the nutritionist, it is vital to ask phytase suppliers how their matrices were determined, and to check to see if these are realistic (e.g. is there enough phytate substrate to apply the recommended matrix?). That information is particularly pertinent when comparing various phytase products and the likelihood of obtaining a reliable performance response for profitable poultry and swine production.


 Open access