
47.1 Introduction
Differences in speech prosody, including rhythmic aspects, have been recognized as a hallmark of the speech of speakers with autism spectrum disorder (ASD) since the earliest descriptions of the disorder (Asperger, Reference Asperger1944; Kanner, Reference Kanner1943). A preponderance of evidence exists that prosodic deficits in speakers with ASD are common (Baltaxe, Reference Baltaxe1984; DePape, et al., Reference DePape, Chen, Hall and Trainor2012; Diehl et al., Reference Diehl, Bennetto, Watson, Gunlogson and McDonough2008, Reference Diehl, Watson, Bennetto, McDonough and Gunlogson2009, Reference Diehl, Friedberg, Paul and Snedeker2015; Diehl and Paul, Reference Diehl and Paul2013; Filipe et al., Reference Filipe, Frota, Castro and Vicente2014; Green and Tobin, Reference Green and Tobin2009; Grossman et al., Reference Grossman, Bemis, Skwerer and Tager-Flusberg2010; Grossman and Tager-Flusberg, Reference Grossman and Tager-Flusberg2012; McCann and Peppé, Reference McCann and Peppé2003; Nadig and Shaw, Reference Nadig and Shaw2012; Patel et al., Reference Patel, Nayar and Martin2020; Paul et al., Reference Paul, Augustyn, Klin and Volkmar2005a, Reference Paul, Shriberg and Mcsweeny2005b; Peppé et al., Reference Peppé, McCann, Gibbon, O’Hare and Rutherford2006, Reference Peppé, McCann, Gibbon, O’Hare and Rutherford2007; Shriberg et al., Reference Shriberg, Paul and Mcsweeny2001; Wynn et al., Reference Wynn, Borrie and Sellers2018), yet our understanding of the exact nature of these prosodic deficits is still emerging (Fusaroli et al., Reference Fusaroli, Lambrechts, Bang, Bowler and Gaigg2017).
Prior research has focused on both the production and perception of grammatical, pragmatic, and affective aspects of speech prosody at the word and sentence levels in individuals with ASD. However, more recently, the scope of research on prosody in autism has been broadened, and investigations of interactional and conversational aspects of prosody have emerged (Lehnert-LeHouillier et al., Reference Lehnert-LeHouillier, Terrazas and Sandoval2020; Ochi et al., Reference Ochi, Ono and Owada2022; Patel et al., Reference Patel, Cole, Lau, Fragnito and Losh2022; Wynn et al., Reference Wynn, Borrie and Sellers2018). This chapter first provides a brief review of prosodic entrainment with particular emphasis on rhythmic and fundamental frequency (F0) entrainment in individuals with autism. Next, we present our study investigating whether speakers with and without autism differ in entrainment to speaking rate and F0 at the conversational turn and to what extent these prosodic features are correlated. Furthermore, we investigate whether entrainment patterns that emerge at the level of the conversational turn translate to entrainment at the level of the conversation as a whole.
In order to accommodate differing preferences expressed by self-advocates, caregivers, and parents within the autism community (see Brown, Reference Brown2011; Dunn and Andrews, Reference Dunn and Andrews2015; Kenny et al., Reference Kenny, Hattersley and Molins2016), this chapter uses both identity-first language (i.e., autistic speakers) and person-first language (i.e., speakers with autism).
47.2 Entrainment
Interactional or conversational prosody relates to changes in prosodic-acoustic characteristics that are used to modulate social interactions by managing conversational turns, signaling attitudes towards conversation topics as well as the conversation partner, among others (see Ward, Reference Ward2019). One well-described conversational prosodic phenomenon is conversational entrainmentFootnote 1 – sometimes also referred to as alignment or mimicry. Conversational entrainment, in general, refers to conversation partners’ alignment in linguistic features during a conversation. Generally speaking, more entrainment in linguistic features is associated with positive interactions whereas a lack of entrainment as well as dis-entrainment – the divergence of conversation partners in linguistic features – are typically associated with negative conversational and relational attributes (see Pickering and Garrod, Reference Pickering and Garrod2004, and Soliz and Giles, Reference Soliz and Giles2014, for a summary and theoretical implication of entrainment behaviors).
In speakers without known communication disorders, conversational entrainment has been shown to occur at the lexical level (i.e., Brennan and Clark, Reference Brennan and Clark1996; Nenkova et al., Reference Nenkova, Gravano and Hirschberg2008), the syntactic level (i.e., Branigan et al., Reference Branigan, Pickering, McLean and Cleland2007; Cleland and Pickering, Reference Cleland and Pickering2003), as well as at the acoustic-phonetic level (i.e., Pardo, Reference Pardo2006; Pardo et al., Reference Pardo, Urmanche, Wilman and Wiener2017).
Prosodic entrainment, as manifested in the alignment of acoustic-prosodic features, such as speaking rate (i.e., Giles et al., Reference Giles, Coupland, Coupland, Giles, Coupland and Coupland1991; Levitan et al., Reference Levitan, Gravano and Willson2012; Local, Reference Local2007), vocal intensity or loudness (i.e., Natale, Reference Natale1975), timing of pauses (i.e., Edlund et al., Reference Edlund, Heldner and Hirschberg2009), and F0 (i.e., Babel and Bulatov, Reference Babel and Bulatov2012; Gregory et al., Reference Gregory, Dagan and Webster1997; Gregory and Webster, Reference Gregory and Webster1996; Levitan and Hirschberg, Reference Levitan and Hirschberg2011; Weise et al., Reference Weise, Levitan, Hirschberg and Levitan2019), has also been well attested in typical speakers (see Beňuš, Reference Beňuš2014, for more discussion). Conversational prosodic entrainment has been shown to be correlated with the perceived overall quality of a conversation (Michalsky et al., Reference Michalsky, Schoormann and Niebuhr2018), the quality of the relationship of conversation partners (Ireland et al., Reference Ireland, Slatcher and Eastwick2011; Lubold and Pon-Barry, Reference Lubold and Pon-Barry2014), the perceived likability and attractiveness of interlocuters (Michalsky and Schoormann, Reference Michalsky and Schoormann2017), and the overall ability to succeed as part of a team (Niebuhr and Michalsky, Reference Niebuhr and Michalsky2019).
Wynn et al. (Reference Wynn, Borrie and Sellers2018) first investigated prosodic entrainment in individuals with ASD by investigating speaking-rate entrainment in children and adults with ASD in response to the speaking rate of an interlocutor. They found that although neurotypical adult speakers entrained to the speaking rate of a prerecorded interlocutor, adults with ASD did not. Children – regardless of whether or not they were diagnosed with ASD – also did not entrain in speaking rate. Lehnert-LeHouillier et al. (Reference Lehnert-LeHouillier, Terrazas and Sandoval2020) studied F0 entrainment and found that children and adolescents with ASD showed less mean F0 entrainment compared to neurotypical peers, but performed similarly to the neurotypical comparison group in F0 range entrainment. Hence, both studies provide evidence that individuals with ASD differ in prosodic entrainment from neurotypical comparison groups. Similarly, Patel et al. (Reference Patel, Cole, Lau, Fragnito and Losh2022) report the most comprehensive study on entrainment behaviors in adolescents and young adults with autism to date, including measures of lexical, semantic, syntactic, and prosodic entrainment. Prosodic entrainment measures in the study of Patel et al. include both F0 measures and rhythmic measures at the dialog act, which is defined as a phrase or sentence that expresses the communicative intent in the interaction. Overall, Patel et al. (Reference Patel, Cole, Lau, Fragnito and Losh2022) find that “autistic speakers” dis-entrained significantly more often compared to the neurotypical controls both in terms of F0 and rhythmic acoustic-prosodic features. In addition to differences in prosodic entrainment, Patel et al. (Reference Patel, Cole, Lau, Fragnito and Losh2022) report differences in lexical entrainment between the two groups but not in syntactic and semantic entrainment. Similar to Patel et al. (Reference Patel, Cole, Lau, Fragnito and Losh2022), Ochi et al. (Reference Ochi, Ono and Owada2022) use a variety of acoustic-prosodic measures obtained in the vicinity of conversational turns to calculate prosodic entrainment, with the goal to assess whether these features correlate with ASD severity. The data used by Ochi et al. (Reference Ochi, Ono and Owada2022) were recordings obtained during the administration of the semi-structured Autism Diagnostic Observation Schedule – Second Edition (Lord et al., Reference Lord, Rutter and Dilavore2012), which is used to diagnose ASD. The results suggest that the amount of prosodic entrainment is highly correlated with autism severity. However, since the focus of the study of Ochi et al. was on assessing severity, this study does not provide information on differences in entrainment between speakers with and without autism.
In summary, there is mounting support showing that differences in prosodic entrainment exist between speakers with and without autism. However, previous studies differ greatly in terms of the ages of participants, the experimental tasks used, the specific acoustic-prosodic features that were studied, and the method used to assess entrainment. For example, while Wynn et al. (Reference Wynn, Borrie and Sellers2018) used spoken responses to a prerecorded interlocuter, Lehnert-LeHouillier et al. (Reference Lehnert-LeHouillier, Terrazas and Sandoval2020) and Patel et al. (Reference Patel, Cole, Lau, Fragnito and Losh2022) used goal-oriented conversational tasks, and Ochi et al. (Reference Ochi, Ono and Owada2022) used a semi-structured diagnostic interview. Lehnert-LeHouillier et al. (Reference Lehnert-LeHouillier, Terrazas and Sandoval2020) assessed entrainment by comparing the initial portion of conversations to the final portions of the same conversations, while Patel et al. (Reference Patel, Cole, Lau, Fragnito and Losh2022) assessed entrainment at the level of the dialog act by deriving the entrainment measure for each dialog act segment via calculating a mean using a sampling method with random replacement of 1,000 samples, and then comparing each dialog act to this mean. Ochi et al. (Reference Ochi, Ono and Owada2022), similar to Patel et al. (Reference Patel, Cole, Lau, Fragnito and Losh2022), use computational methods to assess entrainment via concurrent extraction of multiple prosodic-acoustic markers. Last but not least, while Lehnert-LeHouillier et al. (Reference Lehnert-LeHouillier, Terrazas and Sandoval2020) matched participants in their ASD and neurotypical groups by age, gender, and nonverbal IQ, the participants of Wynn et al. (Reference Wynn, Borrie and Sellers2018) and Patel et al. (Reference Patel, Cole, Lau, Fragnito and Losh2022) were not matched on these parameters. Therefore, the possibility that the differences between speakers with and without autism that were reported in Wynn et al. (Reference Wynn, Borrie and Sellers2018) and Patel et al. (Reference Patel, Cole, Lau, Fragnito and Losh2022) are, in fact, due to differences in age, gender, or nonverbal/performance IQ cannot be excluded.
A next step in prosodic entrainment research would be to identify differences in entrainment profiles between speakers with and without ASD. Different profiles may emerge when investigating whether and how entrainment in different prosodic-acoustic features is correlated and whether local (i.e., entrainment at the level of what is referred to as dialog act, conversational turn, or interpausal unit) implies global entrainment at the level of the conversation as a whole. In order to investigate the existence of such differences, we obtained conversational data from 28 children and teens – 14 with an ASD diagnosis and 14 neurotypical peers matched on age, gender, and nonverbal IQ.
Prosodic entrainment behavior was analyzed in both groups of speakers to see whether entrainment in F0 at the level of the conversational turn correlates with rhythmic entrainment at the conversational turn. Furthermore, we investigated whether global F0 entrainment as observed between the initial and final portion of a conversation is correlated with entrainment behavior at the level of conversational turns.
47.3 Methodology
47.3.1 Participants
Twenty-eight children and adolescents participated in the current study, 14 with an ASD diagnosis and 14 typically developing peers between the ages of nine and 15 years. The participants with ASD and the neurotypical (NT) peers were matched on age (ASD: M = 12.47, SD = 1.9; NT: M = 12.53, SD = 1.9), gender (three girls and 11 boys in both groups), and nonverbal IQ (ASD: M = 107, SD = 10.8; NT: M = 110, SD = 8.85), but differed significantly in composite IQ scores (F(1,22) = 5.11, p = .03) and language functioning (F(1,22) = 18.08, p < .001). All ASD participants had received a medical diagnosis of ASD (Autism = 7, High Functioning Autism = 5, Asperger’s Syndrome = 1, PDD-NOS = 1) prior to participating in this study, according to parent report, and received educational services due to their ASD diagnosis at the time of the study. The mean age of ASD diagnosis was 4.2 years with a range from two to eight years. All participants in the ASD group were administered the Autism Diagnostic Observation Schedule, Second Edition (ADOS-2) (Lord et al., Reference Lord, Rutter and Dilavore2012), a semi-structured standardized assessment widely used to assess and diagnose ASD as part of this study. Only participants with ASD who met the ADOS-2 cutoff score for autism or autism spectrum were included in this study. Since all participants with ASD were fluent speakers of English, Module 3 of the ADOS-2 (Fluent Speech – Child/Adolescent) was administered to all ASD participants.
This study was approved by the New Mexico State University Institutional Review Board and conforms with the guidelines of the Office of Research Integrity and Ethics. The legal guardians of the participants provided written informed consent, and the participants themselves provided written assent to participate in this study. All participants were recruited from the Southern New Mexico area – a linguistically and culturally diverse region of the United States. Of the 14 participants with ASD, seven were of Hispanic heritage, six were Caucasian, and one was African American. Ten of the neurotypical peers were Hispanic and three were Caucasian. However, all participants met the inclusion criteria of coming from households where English was spoken as the first and primary language. All participants passed hearing screenings at pure-tone frequencies of 500 Hz, 1,000 Hz, 2,000 Hz, and 4,000 Hz, and reported normal vision. All participants were administered the Core Language portion of the Clinical Evaluation of Language Fundamentals, Fifth Edition (CELF-5; Wiig et al., Reference Wiig, Semel and Secord2013) to assess general language functioning. Furthermore, the Kaufman Brief Intelligence Test (KBIT-2; Kaufman and Kaufman, Reference Kaufman and Kaufman2004) was administered to determine verbal, nonverbal, and composite IQ scores. This assessment consists of three sub-tests, two measuring verbal IQ and one measuring nonverbal IQ performance. A summary of participant characteristics is shown in Table 47.1.
Summary of group characteristics for the ASD and NT participants. KBIT-2 and CELF-5 scores are provided as standard scores. The ADOS-2 score is provided as ADOS-2 Comparison Score. *** signifies alpha level < 0.001, ** signifies alpha level < 0.01, and * signifies alpha <0.05.
| ASD group (n=14) | Neurotypical group (n=13) | ||||
|---|---|---|---|---|---|
| Mean (SD) | Range | Mean (SD) | Range | p-value | |
| Age | 12.47 (1.9) | 9.01–15.00 | 12.53 (1.9) | 9.01–15.00 | .91 |
| Gender male:female | 11:3 | 11:3 | N/A | N/A | N/A |
| Nonverbal IQ (KBIT-2) | 107 (10.8) | 89–128 | 110 (8.85) | 88–120 | .47 |
| Verbal IQ (KBIT-2) | 89 (22.9) | 64–139 | 109 (13.1) | 90–130 | .004** |
| Composite IQ (KBIT-2) | 98 (17.8) | 73–138 | 112 (12.18) | 87–131 | .03* |
| Language (CELF-5) | 88 (13.14) | 73–113 | 109 (11.19) | 89–126 | <.001*** |
| ADOS-2 | 5.93 (2.09) | 4–10 | N/A | N/A | N/A |
In order to meet inclusion criteria, participants were required to have nonverbal IQ standard scores of 85 or higher, a composite IQ standard score of 70 or higher, as well as a CELF Core Language standard score of 70 or higher in order to assure that participants were able to successfully engage in all study tasks.
As Table 47.1 shows, the two groups differ in terms of their verbal skills, as shown in the differences in verbal IQ and CELF-5 scores, which is to be expected given that challenges with verbal communication is one of the characteristics of autism. The difference in composite or total IQ, in turn, is entirely carried by the differences in verbal IQ between the two groups.
47.3.2 Conversational Task
The conversational task used in this study was the Diapix task (Baker and Hazan, Reference Baker and Hazan2011) – a goal-oriented conversational task that has been shown to elicit conversational prosodic entrainment and that has previously been used successfully with individuals impacted by communication disorders (Borrie et al., Reference Borrie, Lubold and Pon-Barry2015). Study participants were paired with an adult research assistant for the conversation. The research assistants were undergraduate students in the Communication Disorders program at New Mexico State University. A total of nine research assistants between the ages of 20 and 24 years were involved in the study. Research assistants were aware that the purpose of the study was the investigation of speech characteristics in youth with and without ASD, but they did not know that the aim was to investigate prosodic entrainment. All research assistants participated as conversation partners in conversations with participants from both groups but were not blinded to the ASD diagnosis of the study participants.
Each conversation partner was given a picture that was similar but not identical to the conversation partner’s picture. The conversational dyad was then asked to find 10 differences between their respective pictures through collaborative conversation without being allowed to see each other’s pictures. Research assistants and study participants alike were told that the goal of the conversational task was to find as many differences as possible. The conversation was ended after the dyad had identified the 10 differences between the pictures, or concurred that they were unable to find any further differences. All conversations were conducted in a sound-treated room and recorded in audio wave file format at a 44.1 kHz sampling rate with 16-bit resolution using a Marantz PMD 670 digital recorder and a Shure SM58 cardioid dynamic microphone that was placed between the conversation partners, approximately 30 inches from each speaker. All sound files were then transferred for post-processing and labelling. Audio files were annotated using Praat (Boersma and Weenink, Reference Boersma and Weenink2019) TextGrid files. All conversational utterances spoken during the conversation were labelled to indicate which of the two speakers had produced them. Only linguistically meaningful utterances were included. Nonlinguistic vocalizations such as laughter, humming, as well as speaker overlap were excluded from the subsequent acoustic analysis during which measures of speaking rate as words per minute (WPM) and mean F0 were extracted from all utterances. No significant difference in the mean duration of the conversations between the ASD (M = 8.1 minutes, SD = 1.74) and the NT (M = 7.6 minutes, SD = 1.94) group was present.
47.3.3 Calculation of Prosodic Entrainment
47.3.3.1 Speaking Rate
Several pre-processing steps were taken to prepare the data for analysis of speaking rate. More specifically, all acoustic recordings were down-sampled to 16 kHz and saved as a mono-channel PCM audio format. These steps ensured that our files would work with the various software tools throughout the experiment. Each audio file was then transcribed at the word level first using Azure speech-to-text and then hand-corrected. The results were stored in a separate text file along with the time, location, duration of each word. Using the Julia computing tool (Bezanson et al., Reference Bezanson, Karpinski, Shah and Edelman2017), each transcription was inserted into the appropriate TextGrid file as interval tier, so that each word had a start and an end time as determined by the offset and duration reported by the Microsoft Azure speech-to-text tool. Next, the following procedure was used to calculate entrainment in speaking rate:
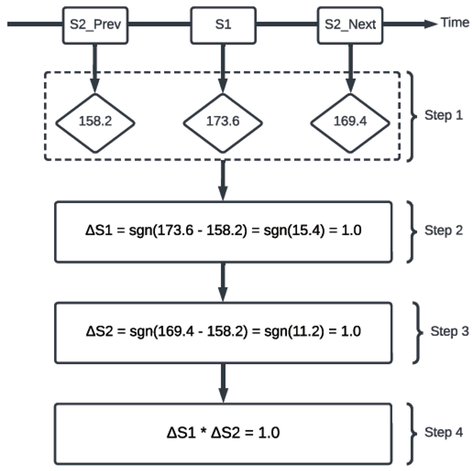
1. The WPM estimates were extracted for any segment produced by speaker 1 (S1). This segment, in turn, was surrounded by segments produced by speaker 2 (S2).
2. The sign of the difference in speaking rate for the S1 utterance compared to the previous S2 utterance was calculated as: ∆S1 = sgn(S1 − S2Prev).
3. The sign of the difference in speaking rate for the S2 utterance compared to the previous S2 utterance was calculated as: ∆S2 = sgn(S2Next − S2Prev).
4. For each S1 segment, we multiplied ∆S1 by ∆S2.
The purpose of each of the aforementioned steps is as follows. Step 1 is responsible for extracting the three consecutive WPM readings for each segment required to perform our algorithm (first S2, S1, and second S2). The first S2 value is used as a reference value to calculate whether S2’s speaking rate has increased, decreased, or stayed the same after the S1 segment. Step 2 computes S1’s speaking rate and compares it to the first S2 segment. A value of 1.0 indicates that S1 increased speaking rate, a value of −1.0 indicates S1 decreased speaking rate, and a value of 0 indicates that the speaking rate stayed the same compared to first S2 segment. Step 3 computes S2’s speaking-rate entrainment using the same approach as described in step 2. Step 4 multiplies ∆S1 by ∆S2, which returns 1.0 if both values carry the same sign, that is, S2 is entraining to S1, and returns −1.0 if the two values carry different signs, that is, S2 is dis-entraining from S1, and if there was a change of less than 5 WPM, we considered this to signify neither entrainment nor dis-entrainment. This threshold of five WPM was chosen based on the analysis of samples from the corpus during which speakers produced two consecutive thematically unrelated turns with a pause between both turns but without turn exchange with an interlocutor. Therefore, we conclude that a five-WPM difference between turns is within the amount of variation that occurs naturally. An example of this four-step procedure where speaker 2 entrains to speaker 1 is provided in Figure 47.1.
Example of a turn exchange.
Speaker 2 entrains to Speaker 1. Step 1 shows the extracted WPM values of three consecutive WPM segments; Step 2 shows a value of 1.0 for ΔS1; Step 3 shows a value of 1.0 for ΔS2; Step 4 multiplies ΔS1 by ΔS2, resulting in a value of 1.0 indicating that S2 entrained to S1 during this turn exchange.
47.3.3.2 F0
47.3.3.2.1 F0 Entrainment Calculation at the Level of Conversational Turns
At the level of conversational turns, the average F0 value was extracted from each speaker segment using a Praat script that uses an autocorrelation-based method developed by Boersma (Reference Boersma1993) to estimate the pitch value every 10 ms automatically. Next, we used the Julia environment to average the F0 values for each segment produced by each speaker. The maximum allowable pitch range (pitch floor and pitch ceiling) used for the analysis was adjusted based on the speaker’s gender. Specifically, we used a pitch range of 70–250 Hz, 150–350 Hz, and 170–450 Hz for adult males, adult females, and children, respectively. The adult male range was used for the male adolescents in our dataset. In order to correctly classify each speaker as adult male, female, or child, a Julia function was developed to utilize the autocorrelation method developed by Boersma (Reference Boersma1993) to automatically estimate the mean F0 for each speaker. We next used the mean F0 estimate to select the appropriate F0 range for speakers based on their estimated F0 average.
Next, we used the same steps described in Section 47.3.3.1 to calculate F0 entrainment at the conversational turn level, using the extracted average F0 instead of WPM as the input to the algorithm. Any change in F0 that was greater than 5 Hz in the same direction as the interlocuter was considered an instance of entrainment, a change in F0 greater than 5 Hz in the opposite direction than that of the interlocuter was considered dis-entrainment, and changes of less than 5 Hz were considered neither entrainment nor dis-entrainment. This threshold of 5 Hz was chosen based on the analysis of the mean F0 difference in a set of samples from the corpus during which speakers produced two consecutive thematically unrelated turns with a pause between both turns but without turn exchange with an interlocutor. Hence, we assume that a +/− 5 Hz difference is not induced by the F0 of the interlocutor but by naturally occurring variance in F0.
47.3.3.2.2 F0 Entrainment Calculation at the Conversational Level
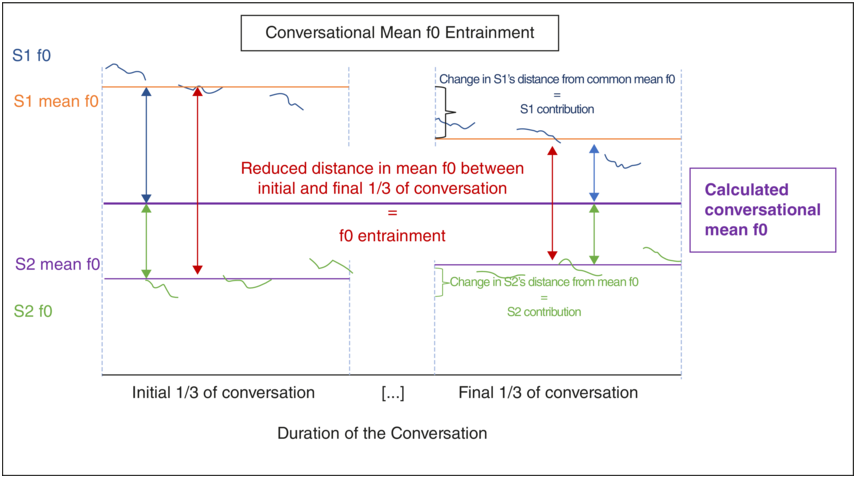
In order to assess whether entrainment behavior at the level of the conversational turn is predictive of global conversational entrainment as derived when comparing the beginning and end of a conversation, we also correlated F0 entrainment at the turn level with global conversational entrainment. Global F0 entrainment was assessed using the procedure developed in Lehnert-LeHouillier et al. (Reference Lehnert-LeHouillier, Terrazas and Sandoval2020). The following is a summary of the procedure. Mean F0 was extracted from the utterances produced by each speaker during the first and the last third of the conversation, using Praat (Boersma and Weenink, Reference Boersma and Weenink2019). The same autocorrelation-based pitch estimation method described above was used to extract pitch estimates at intervals of 10 ms during the labelled sections of the sound file – in this case, the initial and final third of the conversation. Based on the extracted F0 values, the mean F0 for each of the speakers was calculated for the first and the last third of the conversation. The distance between the mean F0 values for both speakers was calculated for both the first and the last third of the conversation by subtracting the mean F0 of one speaker from that of the other speaker in the dyad. A decrease in distance between the initial and the final third suggests mean F0 entrainment, whereas an increase of this distance suggests dis-entrainment. An illustration of this procedure is provided in Figure 47.2.
Conversational mean F0 entrainment.
Illustration of the approach used to determine mean F0 entrainment exhibited during a conversation. Based on the F0 contours produced by S1 and S2 during conversational turns in the first and the last third of the conversation, mean F0 for each speaker was calculated for the respective thirds. The difference/distance between both speakers’ mean F0 was then calculated. If this difference/distance decreased from initial to final third, as shown in this figure, speakers showed entrainment. A common mean F0 was calculated for each conversational dyad. The difference/distance of each speaker from this common mean during the first and last third was then calculated to determine the contribution of each speaker to the overall entrainment in mean F0.

As can be seen in Figure 47.2, S1 in this hypothetical example contributes more to the conversational entrainment in mean F0 than S2. It is also possible that two speakers entrain much less than the hypothetical speakers in Figure 47.2, such that the speaker who contributes more to the mean F0 entrainment in such a conversation with less overall entrainment would contribute an absolute F0 change to the F0 entrainment that is smaller than that of S2 in our Figure 47.2. In order to account for such a situation and to capture both aspects – the amount of overall conversational mean F0 entrainment as well as the individual contribution of our study participants – the conversational mean F0 entrainment measure was normalized using the entrainment contribution measure. The normalized mean F0 entrainment measure was then used as the input to the statistical analysis.
47.3.4 Statistical Analysis
All statistical analyses were conducted using the R statistical computing environment (R Core Team, 2016) and the packages “tidyverse” (Wickham et al., Reference Wickham, Averick and Bryan2019), “lme4” (Bates et al., Reference Bates, Mächler, Bolker and Walker2015), and “cocor” (Diedenhofen and Musch, Reference Diedenhofen and Musch2015). Mixed-effects modelling was used to assess (1) the group differences in speaking-rate entrainment and F0 entrainment at the level of the conversational turn, and correlation statistics were used to assess (2) the relationship between entrainment at the level of the conversational turn and global conversational entrainment. The first question was investigated by fitting a mixed-effects model with turn-level entrainment as the outcome variable and with group (ASD versus NT) and entrainment type (Entrainment, Dis-entrainment, and No Change) as predictor variables. Participants and conversation partners were modelled as random effects. The second question was answered via correlation testing using Pearson’s correlation coefficient r.
47.4 Results
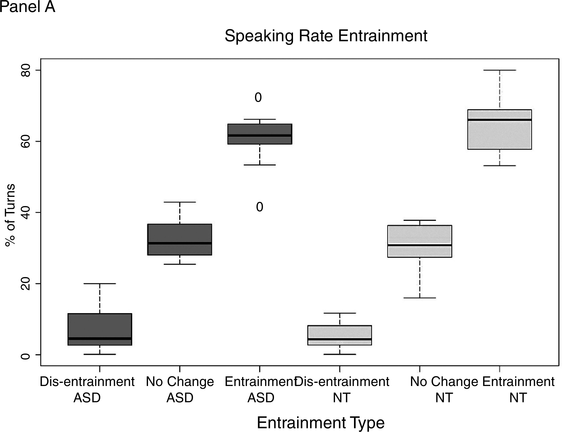
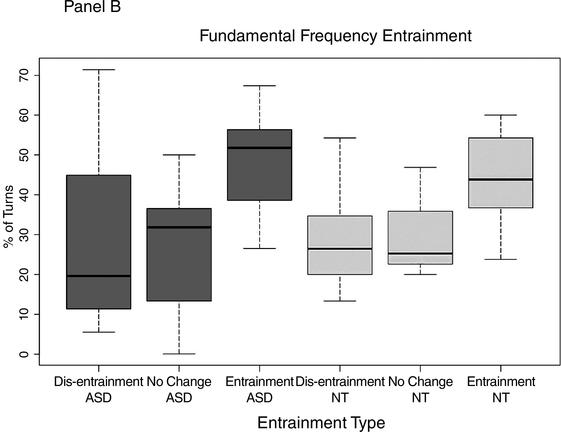
The mixed-effects model yielded no significant difference between groups when it came to turn-level entrainment in either speaking rate or F0. Figure 47.3 shows the percentage of turn exchanges during which dis-entrainment, no entrainment, and entrainment occurred. Panel A shows speaking-rate entrainment by type of entrainment for each group, and Panel B shows F0 entrainment.
Turn-level entrainment in speaking rate and F0.
Panel A shows the percentage of turns with dis-entrainment, no change in speaking rate, and entrainment in speaking rate for the ASD group and the neurotypical comparison group.

Figure 47.3A Long description
The horizontal axis lists various types of entrainments in both the graphs, which are as follows. Dis entrainment A S D, No change A S D, Entrainment A S D, Dis entrainment N T, No Change N T, and Entrainment N T. The vertical axis represents percentage of turns which ranges from 0 through 80 percent in panel A. The median values of turns in percentages are as follows. Entrainment N T, 65. Entrainment A S D, 60. No change N T, 30. No change A S D, 30. Dis entrainment A S D, 10. Dis entrainment N T, 8.
Panel B shows the percentage of turns with dis-entrainment, no change in speaking rate, and entrainment in F0 for both groups.

Figure 47.3B Long description
The horizontal axis lists various types of entrainments in the graph, which are as follows. Dis entrainment A S D, No change A S D, Entrainment A S D, Dis entrainment N T, No Change N T, and Entrainment N T. The vertical axis represents percentage of turns which ranges from 0 through 70 percent in graph B. The median values of turns in percentages are as follows. Entrainment A S D, 50. Entrainment N T, 45. No Change A S D, 32. Dis Entrainment N T, 30. No Change, 20. Dis Entrainment A S D, 20.
As can be seen in Figure 47.3, both groups exhibited all three entrainment types – dis-entrainment, no change, and entrainment – at the level of the conversational turn. Furthermore, both groups show entrainment more frequently than either dis-entrainment or no change in the two assessed features “speaking rate” and “F0.”
The only group difference in entrainment behavior that was observed was in global conversational entrainment (b = −0.72, SE = 0.25, t = 2.85, p = .009). Similar to the results reported in Lehnert-LeHouillier et al. (Reference Lehnert-LeHouillier, Terrazas and Sandoval2020), the children and adolescents with autism contributed significantly less to the global conversational F0 entrainment compared to the neurotypical control group.
The results from the correlation analysis revealed that speaking-rate entrainment was highly correlated with F0 entrainment at the local conversational turn level (r = 0.522, p < 0.0001). This holds true for both autistic speakers (r = 0.524, p < 0.001) and the neurotypical peer group (r = 0.55, p < 0.001), suggesting that speakers in both groups coordinated both prosodic features when signalling turn-level prosodic entrainment. However, when looking at the relationship between F0 entrainment at the turn level and global F0 entrainment from the beginning to the end of the conversation, no correlation was found for either the autistic speakers (r = 0.04) or the neurotypical speakers (r = 0.03). This suggests that entrainment at the level of the conversational turn may serve a different conversational function than global conversational entrainment, at least as far as entrainment in mean F0 is concerned.
47.5 Discussion and Conclusion
The emerging research on conversational prosodic-rhythmic entrainment in speakers with autism suggests that these speakers differ in entrainment behaviors from neurotypical speakers. Given the social function of conversational prosodic entrainment, which has been shown to be associated with the perceived quality of conversations (Michalsky et al., Reference Michalsky, Schoormann and Niebuhr2018), as well as the quality of the relationship of conversation partners (Ireland et al., Reference Ireland, Slatcher and Eastwick2011; Lubold and Pon-Barry, Reference Lubold and Pon-Barry2014), differences in prosodic entrainment in speakers with autism are not surprising as they can be seen as a reflection of the social-communicative impairments that are a hallmark of autism.
This chapter reviewed in particular differences in prosodic entrainment in terms of speaking rate and F0, and contributed to the study of rhythmic-prosodic entrainment in speakers with autism by presenting the results from a study investigating speaking-rate and F0 entrainment in children and adolescents with autism in comparison to age, gender, and nonverbal IQ-matched neurotypical peers. The results concur with some of the prior studies, in particular with the study reported by Wynn et al. (Reference Wynn, Borrie and Sellers2018), who did not find differences in speaking-rate entrainment in their child participants with and without autism. They only report differences in speaking rate in adults with autism. The results of the study reported here, similar to the report of Wynn et al. on their child participants, did not find differences in speaking-rate entrainment between speakers with and without autism. This is in contrast to the results reported by Patel et al. (Reference Patel, Cole, Lau, Fragnito and Losh2022) who found that their participants with autism as well as the first-degree relatives of those speakers showed significantly less speaking-rate entrainment at the dialog act level. The study reported here differs in important ways from the two studies that included investigations of speaking rate. Both Wynn et al. (Reference Wynn, Borrie and Sellers2018) and Patel et al. (Reference Patel, Cole, Lau, Fragnito and Losh2022) used syllables per second as measure of speaking rate, while we used WPM. Furthermore, the age ranges of the participants in the three studies differed when it came to the young participants with autism. The mean age of the study of Wynn et al. (Reference Wynn, Borrie and Sellers2018) was 10 years and seven months. The ASD group of Patel et al. (Reference Patel, Cole, Lau, Fragnito and Losh2022) consisted of older adolescents and young adults with a mean age of 19 years and four months. Our study participants with a mean age of 12 years and five months were slightly older than those of Wynn et al. and somewhat younger than those of Patel et al. The difference in the findings in these three studies suggest that age may be one variable that impacts rhythmic entrainment – both in speakers with and without autism.
While Wynn et al. (Reference Wynn, Borrie and Sellers2018) did not investigate F0 entrainment, Patel et al. (Reference Patel, Cole, Lau, Fragnito and Losh2022) and the study reported above both investigated F0 entrainment at a smaller scale during conversations – at the level of the dialog act and the level of the conversational turn, respectively. Patel et al. (Reference Patel, Cole, Lau, Fragnito and Losh2022) report significant differences in mean F0 entrainment at the dialog act level between their ASD participants and the neurotypical comparison group. However, we did not find such group differences in our study reported here. While there are differences in how F0 entrainment was calculated and assessed in both studies, there are also important differences in the demographic characteristics of the participant groups. While our study included participants in each group that were carefully matched in terms of age, gender, and nonverbal IQ so as to not confound the results by including variables that have been linked to prosodic entrainment differences, such as gender (i.e., Reichel et al., Reference Reichel, Beňuš and Mády2018) and age (i.e., Wynn et al., Reference Wynn, Borrie and Sellers2018), the speakers with autism of Patel et al. differed from the neurotypical comparison group in terms of all three parameters – age, gender composition of the groups, and nonverbal IQ. Therefore, further investigation with more carefully matched participant groups would be highly desirable.
The study reported in this chapter was to our knowledge the first to investigate correlations between different acoustic-prosodic features in conversational prosodic entrainment in speakers with autism as well as correlations between local and global entrainment. The results suggest that at the local level of the conversational turn, both speakers with and without autism seem to correlate speaking rate and F0 to mark prosodic entrainment. However, entrainment behavior at the local turn level did not correlate with F0 entrainment at the level of global conversational entrainment for either group. This suggests distinct functions of local and global entrainment in F0, which should be investigated in future research.
The study reported here also has several limitations that we would like to point out. The most obvious limitation is the small sample size of only 14 participants in each group. However, this relatively small sample size made careful matching of participants possible. It should also be noted that the age range of the participants spans puberty – a time associated with significant changes in vocal characteristics of the speakers. This rendered the analysis more difficult as F0 ranges differed as a function of these changes in our male adolescent speakers.
In summary, more research is needed to clarify the factors that influence rhythmic-prosodic entrainment in speakers with autism and to delineate those factors that are not due to speaker characteristics associated with autism.
47.6 Acknowledgements
We would like to thank the children and teens who participated in this research study as well as their families. This research was supported by an Institutional Development Award (IDeA) from the National Institute of General Medical Sciences of the National Institutes of Health under grant number P20GM103451.
Summary
Rhythmic entrainment in speaking rate is highly correlated with F0 entrainment at the local level of conversational turns in the speech of speakers with and without autism. Speakers with autism show differences in global conversational entrainment; however, no correlation between local and global entrainment in F0 was observed for either group.
Implications
The lack of correlation between local and global prosodic entrainment suggests that local prosodic entrainment may serve a different conversational function than global prosodic entrainment. Further research is needed to determine what these distinct functions may be.
Gains
The study presented here suggests that speakers with autism do not show differences in speaking-rate entrainment when compared to neurotypical speakers who are matched in age, gender, and nonverbal IQ. This finding is in contrast to earlier findings and highlights the importance of delineating factors that may impact entrainment behaviors but that are not due to speaker characteristics associated with autism.


 Open access