


1. Introduction
Microwave signal is the most important foundation in the current information society. Since the existence of electromagnetic wave was discovered, the long-term research on electromagnetic wave has been carried out. High power microwave (HPM) signal is only a special form of microwave signals. Due to its high peak power characteristic, the HPM has a wide range of applications in the civilian field. Therefore, many countries invest heavily in in-depth researchon it [Reference Zhou, San and Hua1–Reference Valizade, Rezaei and Orouji4].
There are many methods to generate the microwave signal. As stated in references [Reference Fang, Huang and Huang5–Reference Guo, Li and Huang7], the solid state semiconductor device was used to generate the microwave signal with low power. The electronic vacuum devices are mainly adopted to generate the HPM signal with the narrow pulse of nanosecond level and peak power of GW level [Reference Torgashov, Torgashov, Titov, Rozhnev and Ryskin8–Reference Wang, Chen and Wang13]. In above microwave signal generation techniques, the repetition frequency of the obtained pulse is hard to get the kHz level. Therefore, a simple and cheap method for generating the HPM pulse with the repetition frequency of MHz level and the peak power of 100 kW-MW level will be a new breakthrough in the field of microwave signal generation [Reference Fang, Wu and Huang14].
In the study “Path Encoding Pulse Compression for Obtaining Novel HPM with Ultrahigh Repetition Frequency,” the research team proposed an effective microwave pulse generation method. Here, a new type HPM with ultrahigh power (Hundreds of kW), ultrahigh repetition frequency (Hundreds of kHz), and ultrahigh bandwidth (Hundreds of MHz) is obtained. Excepting the above characteristics, the key feature of the new type HPM is that the generated HPM has a center carrier frequency. It means that the new type HPM will have good radiation ability by using the antenna, which is an enormously advantage for the HPM produced system. Moreover, the center carrier frequency of this new type HPM can be arbitrarily selected in the range from 100 MHz to tens of GHz without changing the system structure. This type HPM is a new type HPM signal and never be effectively generated and applied by human beings. The research team has verified the feasibility for obtaining this new type HPM through the experiment method. The HPM pulse with peak power of 50 kW, repetition frequency of 1 MHz, and pulse width of 1 ns were obtained for the first time [Reference Fang, Wu and Huang14]. Furthermore, the ultranarrow pulse with width of 450 ps can be obtained by using the same principle and device [Reference Fang, Zhai, Wu, Zhang, Huang and Li15].
The principle of the path encoding pulse compression method has been introduced in detail [Reference Fang, Wu and Huang14]. The essence of this method is to adjust the frequency or phase of the electromagnetic wave in the different period time. In the compression process, the cumulative effect of multipath superposition is formed in a large metal cavity. Then, the input pulse with time length of μs level will be compressed to nanosecond-level pulse. A higher peak power is obtained. Compared with the traditional pulse compression method such as SES [Reference Hong, Lathrop, Mendez and Kim16–Reference Rhee, Cho, Kim and Ko23], the biggest feature of this path encoding pulse compression method is that the high power microwave switch is not required. Therefore, very high repetition frequency and higher power capacity can be achieved by using this method in theory. However, limited to the research level and cognition at that time, the principle and realization of this method is only briefly introduced in reference [Reference Fang, Wu and Huang14]. There are many deeper issues needed to be further studied. This study focuses on gain regularity of pulse compression gain. The same device used in reference [Reference Fang, Zhai, Wu, Zhang, Huang and Li15] is also adopted in this study. This article studies systematically the power compression gain regularity based on the previous research results in references [Reference Fang, Wu and Huang14, Reference Fang, Zhai, Wu, Zhang, Huang and Li15]. Some valuable conclusions have been obtained. Therefore, the regularity of power gain has been summarized in time. We hope this research can further provide the reference for the relevant researchers of path encoding pulse compression technique.
2. Numerical Simulation
2.1. The Power Gain Varies with the Time Length of Input Pulse
In this section, a rectangular cavity is adopted as the reference simulation model to study the power compression gain law. The established model is shown in Figure 1, and the finite-difference time-domain (FDTD) method is used [Reference Chen and Wang24]. The sizes of the rectangular cavity are selected as 1 m × 1 m × 2 m. Two BJ-32 rectangular waveguides are used as the input port and output port, respectively. For the simulation model, the length is the x-direction, the height is the y-direction, and the width is the z-direction.
The simulation model of rectangular metal cavity (1 × 1 × 2 m).
The material of the established meal cavity is set as an ideal metal without loss. In order to correspond with the later experimental measurement system, the center carrier frequency is firstly selected as f = 2.856 GHz for simulation. Then, the obtained curve of simulated compression gain (CG) along with the increase of input pulse length is shown in Figure 2.
The curve of simulated compression gain increases with input pulse length.
As shown in Figure 2, it can be seen that the CG increases linearly with the time length of input pulse. It means that the two subpulses intercepted arbitrarily form the input pulse with equal time length will have the equal gain contributions according to the simulation results.
Figure 3 gives the output waveforms of compression pulse when the two subpulses are arbitrarily intercepted from the input pulse. Comparing with the two output compression pulse waveforms, it can be found that the peak powers of the two output compression pulses are almost three times. This is due to that the time length of input subpulses are almost three times. No matter where the subpulse is intercepted, there is an interesting phenomenon that the final compression pulse output moment is only related to the total length of the input pulse. This phenomenon is determined by the principle of path encoding pulse compression for realizing pulse compression and higher power gain.
The intercepted two input subpulse signals and the corresponding output compression pulse waveforms.
The influence of material conductivity on CG is studied in the next step. The simulation model shown in Figure 1 is still selected here. The materials of the cavity are successively selected as the copper (δ = 5.7 × 10⁷ S/m), silver (δ = 6.3 × 10⁷ S/m), and aluminum (δ = 3.5 × 10⁷ S/m) for studying the variation of CG along with the increased conductivity of cavity material. The simulated results are shown in Figure 4. It can be found that the CG increases proportionally with the increased conductivity of cavity material. However, the CG is almost no change after the CG reaching to a certain value. This phenomenon can be easily explained. This is due to that the state of equilibrium between path loss power, and the injection power is reached.
The curve of the compression gain variation for the simulation model with increased conductivity of cavity material (the length of input pulse is fixed in the simulation process).

For the lossy cavity, if two subpulses with equal time length are intercepted from the input pulse at different positions for pulse compression, the obtained compression pulses are similar to that of the cavity without loss. However, the gain contribution of intercepted subpulse with front time is less than that of the intercepted subpulse with the later time. This phenomenon suggests that the material loss of cavity must be minimized for obtaining higher compression gain. Therefore, the research of superconducting metal cavity will be an important research direction in the future work [Reference Raut, Miller, Pate, Chiao and Sharping19–Reference Marsic, Ackermann and De Gersem21].
2.2. The Regularity of Power Gain Varies with the Working Frequency
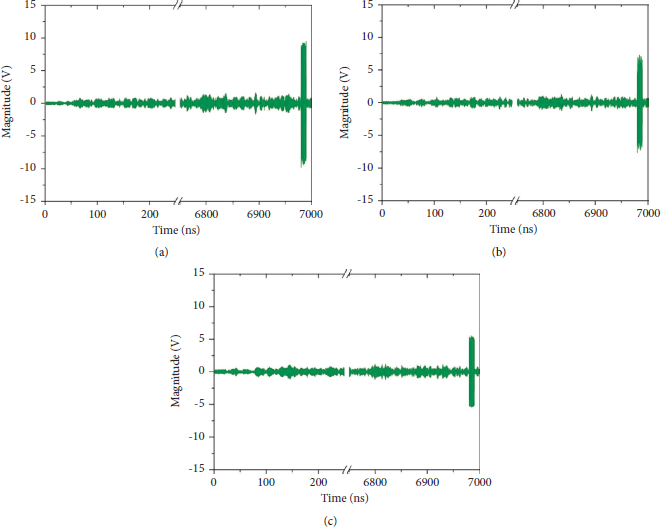
In this section, the simulation model shown in Figure 1 is still established. The sizes of the metal cavity are still selected as 1 m × 1 m × 2 m. The material of the cavity is set as an ideal metal without loss. The BJ-32 waveguides, BJ-58 waveguides, and BJ-100 waveguides are selected as the input and output ports for the S-band, C-band, and X-band simulations, respectively. In the simulation process, the center carrier frequencies of S-band, C-band, and X-band are set to 2.856 GHz, 5.8 GHz, and 9.37 GHz, respectively. The time lengths of the input pulses for three bands are both selected as 7 μs. The obtained compression waveforms for the three bands are shown in Figure 5.
The obtained output compression pulse waveforms for the different frequency bands. (a) The S-band compression pulse waveform. (b) The C-band compression pulse waveform. (c) The X-band compression pulse waveform.

As shown in Figure 5, it can be clearly seen that the equal CG is difficult to be achieved only by changing the working frequency for the lossless cavity with same size. The amplitude of C-band compression pulse is higher than that of S-band compression pulse. This is mainly because that the BJ-58 waveguide is good matched with the metal cavity in the C frequency band. Then, the energy utilization efficiency is increased, and a higher CG will be achieved. However, for the X-band, the equivalent path of electromagnetic wave is increased. The path loss will be increased. Then, the encoding efficiency of pulse compression is reduced, resulting in the increase of reflected power. Thus, the energy utilization efficiency is reduced. Therefore, compared with the results shown in Figure 5(b), the amplitude of X-band compression pulse is decreased, and the CG is reduced.
In order to obtain the equal CG, the sizes of the cavity are decreased according to the linear relationship of the frequency ratio in the C-band and X-band. Then, the sizes of the cavity for C-band are set as 0.492 m × 0.492 m × 0.984 m. The sizes of the cavity for X-band are set as 0.305 m × 0.305 m × 0.61 m. The input and output waveguides are still selected as the BJ-58 for C-band and BJ-100 for X-band. Then, the input pulses with equal time length of 7 μs pulse are also adopted to feed the revised cavity in C-band and X-band. The obtained compressed pulse waveforms are shown in Figure 6.
The output compression pulse waveforms of the revised cavity models working in the different frequency bands. (a) The compression pulse waveform of C-band revised cavity model. (b) The compression pulse waveform of X-band revised cavity model.

Compared with the results shown in Figure 5, it can be found from Figure 6 that the compression gains are roughly same when the cavity is linear proportionally revised in the C-band and X-band. This phenomenon brings us an important lesson that the bigger cavity is not always better. There is an optimization design process for obtaining a good CG at the different bands. How to optimize the cavity is also the key issue in the future works.
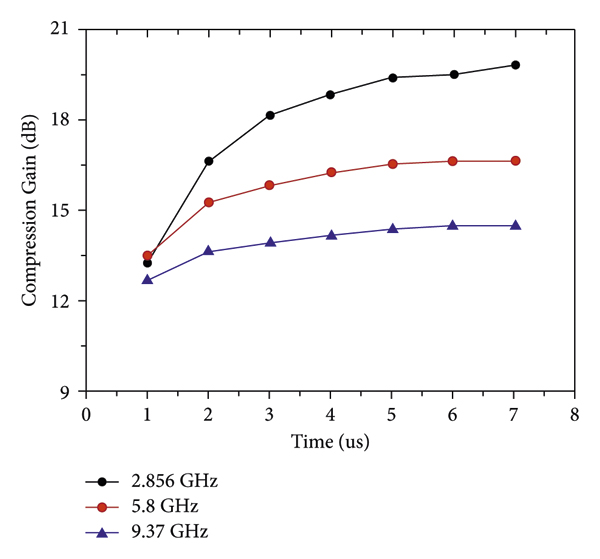
Under the condition without loss, the obtained compression pulse waveforms are almost equal for the three cavities with the linear proportional sizes of wavelength. In the next step, the CG of the cavities with lossy material is studied. The material of the cavity is set as the copper (δ = 5.7 × 10⁷ S/m) for simulation. The lengths of the input pulses are also selected as 7 μs for pulse compression. The simulated results are shown in Figure 7. According to the simulated results, the obtained CG decreases with the increase of working frequency after adding loss to cavity material. The variations of the CG with the time length of input pulses are shown in Figure 8 in three frequency bands. It can be found that the time of the CG reaching to a constant value is shorter when the higher working frequency is selected. This is mainly because the transmission path of the higher working frequency has a higher loss under the condition with same cavity material. Therefore, it is particularly important to reduce the inner loss of cavity by selecting the cavity material with higher electrical conductivity for obtaining higher CG.
The output compression pulse waveforms of the revised cavities with copper material (δ = 5.7 × 10⁷) working at the different frequency bands. (a) The S-band compression waveform of the cavity with copper material. (b) The C-band compression waveform of the cavity with copper material. (c) The X-band compression waveform of the cavity with copper material.

The simulated variation of the output CG with the time length of input pulses for the three frequency bands.

The requirement of the electrical performance for inner wall of the cavity is higher when the cavity is working at higher frequency band. Under the existing natural conditions, the application requirement can be basically satisfied by adopting the metal material such as silver or copper at the frequencies below the C-band. Therefore, the superconducting cavity may be the only solution way to obtain higher power gain at the higher frequency band, especially at Ku frequency band. Thus, the research of superconducting metal cavity is also the focus of the future work. Meanwhile, this pulse compression method is unlikely to be applied in the terahertz band as the loss of cavity in the terahertz band is much high [Reference Wang, Wang, Wang, Li and Zeng25–Reference Xi, Wang and He27].
3. Experiment Research
In this section, an experimental system similar as reference [Reference Fang, Zhai, Wu, Zhang, Huang and Li15] was established to verify the compression gain law obtained numerically. Figure 9 shows the established experimental system, which consists of an arbitrary waveform generator (the sampling rate is set to 50 GS/s), a power amplifier with 200 W output power, a copper cavity, a high-power circulator, and a high-speed sampling oscilloscope (the sampling rate is set to 50 GS/s).
Schematic diagram of the experimental system (similar as in reference [Reference Fang, Zhai, Wu, Zhang, Huang and Li15]).
The overall experimental process is given as follows. First, the pulse response signal corresponding to the excitation narrow pulse (10 ns) is obtained by measuring the output signal of the metal scattering cavity. Second, the time-reversed normalization operation is performed to the pulse response signal, and then, a time-inverse normalized signal is obtained. Finally, the obtained time-inverse normalized signal is fed into the metal scattering cavity. The compression pulse signal will be obtained at the output of cavity. Due to the natural filtering and band-limiting characteristics of the metal scattering cavity, the compression efficiency of the experimental system can be effectively guaranteed.
Fixing the sizes of cavity, the variation law of pulse compression gain with the time length of input pulse can be obtained under the conditions of S-band, C-band, and X-band. The measured results are shown in Figure 10, where it can be seen that the time for the CG reaching to a constant value is shorter with the increasing of the working frequency. This is due to that the loss of cavity at lower frequency band is lower than that of the cavity at higher frequency band.
The measured variation law of pulse compression gain with the time length of input pulse at different frequency bands.
According to measured results, the CG is increased slowly when the time length of input pulse is higher 4 μs. The energy utilization efficiency drops rapidly when the CG reaches to the constant value. This is due to that the measurement error of pulse response signal is increased with the increase of time length. The energy utilization efficiency is gradually reduced. Then, the subsequent increased power has little contribution to the CG when the CG reaches to a constant value. The variation law of CG with the time length of input pulse was studied under the lossy condition. There is an optimization design process for obtaining the good CG for the different frequency bands.
In order to verify the obtained gain law by using the numerical simulation method under the condition without loss, the approximation method was adopted. The loss of cavity at lower frequency band is lower than that of the cavity at higher frequency band. Thus, the last segment of the input pulse at S band was selected for verifying the simulated gain law that the equal pulses with equal length have equal compression gain contribution under the condition without loss.
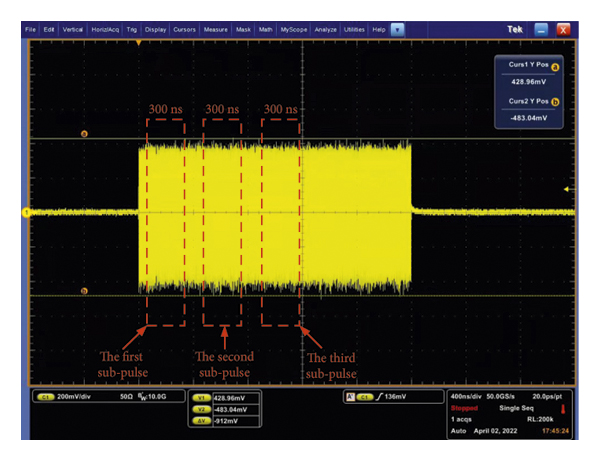
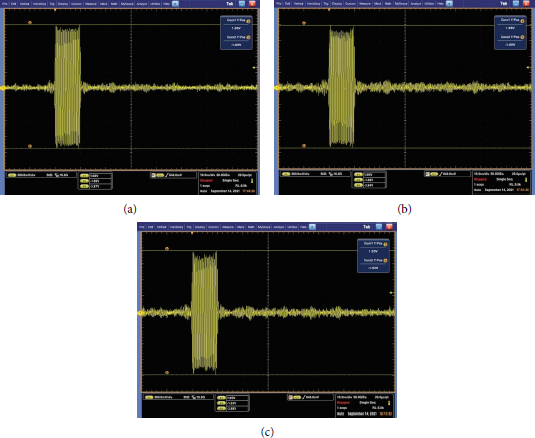
Within the last 2 us of input pulse, as shown in Figure 11, three 300 ns subpulses are selected and compressed for obtaining the compression waveforms, respectively. The measured compression pulse waveforms are given in Figure 12. It can be seen that both the three measured compression waveforms have good edge agility characteristics for the three subpulses. The obtained amplitudes of the three compression pulses are 3.87 V, 3.84 V, and 3.88 V, respectively. According to the amplitudes of the three subpulses (about 912 mv as shown in Figure 11), the obtained pulse compression gain are approximately 18.0, 17.7, and 18.1, respectively. Through multiple measurements, the compression gain is basically same. It means that the compression gains of the three subpulses are basically equal.
Three subpulses intercepted from the input long pulse with equal time length of 300 ns.

The compressed waveforms for the three input subpulses intercepted from the input long pulse with equal time length. (a) The compressed waveform of the first subpulse with 300 ns in S-band. (b) The compressed waveform of the second subpulse with 300 ns in S-band. (c) The compressed waveform of the third subpulse with 300 ns in S-band.

The three input subpulses with equal pulse length have approximately equal gain contribution under the condition without loss. The pulse width of the obtained compression pulse is 10 ns, thus the maximum compression gain is about 30 times in theory (max gain = 300 ns/10 ns = 30). The energy utilization efficiency is higher than 59%.
According to the above measured results, two laws of the CG have been verified. Under the lossless condition, the input pulses with equal pulse length have the equal gain contribution to the CG. Moreover, no matter the segment subpulse is intercepted at any point of input pulse for pulse compression, and the output moment of the compressed pulse is always at the position corresponding to the beginning of the whole input pulse.
4. Conclusions
In the previous research, the research team has obtained this new type HPM pulse by using the path encoding pulse compression method. This study is the further research of the reference [Reference Fang, Wu and Huang14]. The regularity of pulse compression gain is studied by adopting the numerical simulation and experiment measurement methods. For the lossless cavity, the power gain has the characteristic of equal pulse length with equal compression gain contribution according to the numerical simulation results. In order to verify the obtained gain law by using the numerical simulation method, the approximation method was adopted. Within the last 2 us of input pulse, three 300 ns subpulses were selected and compressed for pulse compression. According to the measured compression waveforms, the compression gains of the subpulses are basically equal. The measured results verified the conclusion of equal pulse length with equal compression gain contribution by using three 300 ns subpulses selected in the last 2 us of input pulse. Thus, the loss of the cavity must be reduced as much as possible for obtaining a higher pulse compression gain in the practical application.
Data Availability
All data included in this study are available upon request by contact with the corresponding author.
Conflicts of Interest
The authors declare that they have no conflicts of interest.


 Open access