


1. Introduction
Those who seek to disembarrass a country of its entanglements should be very slow and wary. It should not be a matter of tearing up roots but of slowly training a plant to grow in a different direction.
(John Maynard Keynes Reference Keynes1933)
Following the end of the Soviet Union in the 1990s, there was increased interest among policy makers and academics in applying political-economic analysis to understand the factors that drive secession and unification of countries (Bolton et al., Reference Bolton, Roland and Spolaore1996). The most fundamental of these approaches weighed the costs and benefits of secession/unification (Bolton and Roland, Reference Bolton and Roland1997). Alternative lines of inquiry considered country size, comparing the benefits of (increased) size against the costs of heterogeneous population preferences over public good provision and government services (Alesina and Spolaore, Reference Alesina and Spolaore2003). The main benefits of unification (increasing country size) are economies of scale in the public good provision, more efficient forms of taxation, increased defence capability (military), larger internal markets, regional insurance, and redistribution. However, larger size comes with the cost of a more heterogeneous population, in terms of culture, religion, and language, with varying and alternative preferences. The benefits of secession therefore relate to preference optimisation for local groups regarding public goods provision, although this incurs costs associated with establishing new, or duplication of existing, infrastructure for the provision of public goods (Alesina and Spolaore Reference Alesina and Spolaore2003). If the preferences of political majorities, relating to fiscal and redistribution policies, differ across regions, secession may occur as it could theoretically benefit local majorities (Bolton and Roland Reference Bolton and Roland1997). One of the more eye-catching findings is that democracy can encourage secession and lead to an “inefficiently” large number of countries (Alesina and Spolaore Reference Alesina and Spolaore1997; Bolton and Roland Reference Bolton and Roland1997). However, this inefficiency is conditional on the prevailing international environment; protectionism increases the costs of secession (reduces the size of global markets) while economic integration could mitigate them (Alesina et al. Reference Alesina, Spolaore and Wacziarg2000).
Political borders are human-made institutions (Alesina and Spolaore Reference Alesina and Spolaore2003). The twentieth century saw a radical redrawing of political borders across the globe. Today there are 143 independent countries, but there was only half this number in 1900. As a result of the Treaty of Versailles, signed in 1919, the borders of Europe were redesigned and several new countries emerged from the ashes of the Austro-Hungarian empire. Although not officially part of this wave of secession, southern Irish leaders considered themselves part of this movement and sent a letter requesting recognition of Irish independence to the Paris conference.Footnote 1 Nationalist Irish MPs refused to take their seats at Westminster and formed an underground Irish government (Dáil) and a bitter guerrilla war between its revolutionary army and British forces in Ireland dominated the period 1919–1921. Following a truce in June 1921 and negotiations with the British government, the Anglo-Irish Treaty was ratified in the Dáil and 7 January 1922, although Saorstát Éireann (the Irish Free State [IFS]) came into existence that December. Six counties of the northeast were to remain within the United Kingdom as a result of the Government of Ireland Act of 1920.Footnote 2
The secession of southern Ireland from the Union of Great Britain and Ireland in 1922 is an interesting case study of the political economy of secession. This paper focuses on the political economy of the new state in the first two decades of its existence. Hynes (Reference Hynes2014) applies the political-economic analytical framework of Alesina and Spolaore (Reference Alesina and Spolaore2003) to understand the drivers of secession. Here, we build on Hynes (Reference Hynes2014) by focusing on the political economy of the practical implementation of the new state.
Independence gave the IFS greater potential control over all aspects of economic policy. Notably, the IFS was distinctly different from what had been envisaged in attempts at devolutionFootnote 3 in that it enabled the IFS to have control over excise and customs, that is protection; whereas Northern Ireland (NI) became an example of devolved (Home Rule) economic structure. Notably, however, the nascent revolutionary clique involved different personnel to the pre-war Home Rulers and the first Dáil’s democratic programme also raised the spectre of alternative Bolshevik/socialist options prevalent in post-WWI Europe. Despite these revolutionary changes, economic policy in the IFS adhered to contemporary orthodoxy. Furthermore, despite the dramatic shift in trade policy that occurred in the IFS with the arrival of the Fianna Fáil administration in 1932, even here the actions were as much a response to a changing international environment as the IFS acting independently.
Ireland is a small island and at independence its population stood at less than 3 million, yet a century after independence, it is one of the fastest growing countries in Europe (see Ó Gráda and O’Rourke Reference Ó Gráda and O’Rourke2021 for a reviewFootnote 4). However, taking a medium-run perspective Ireland did not prosper after gaining independence, as Figure 1 conveys. While it performed marginally better than NI, Scotland, and the UK in terms of growth rates over the period 1926–1960, this was from a much lower initial income level and there was little convergence in income per capita.Footnote 5 This led contemporary commentators to compare it unfavourably with regions elsewhere in the British Isles (e.g., FitzGerald Reference Fitzgerald1956).Footnote 6 As noted above it is argued that trade openness can offset the impediments of country size (Alesina et al. Reference Alesina, Spolaore and Wacziarg2000). However, Ireland seceded during a period of increased protectionism. Ireland only benefitted from increasing openness and the economic integration available to it from joining the European Union in 1973, and this is seen as a cornerstone of its later success (O’Rourke Reference O’Rourke2017).
(Colour online) Comparative growth performance
Note: Ireland based on GNP because GDP < GNP 1920–1970s, in large part due to emigrant remittances. From 1970s to present GDP > GNP [distortion much greater than for most other countries included, due to prevalence of international profits of multinational firms]. Sources: Maddison Project Database, version 2020; UK regions from Rosés-Wolff database, Reference Rosés and Wolf2020; Gerlach and Stuart (Reference Gerlach and Stuart2015) for GNP.

2. Regional Context
Alesina and Spolaore (Reference Alesina and Spolaore2003) argue that heterogeneity costs can arise from differences in noneconomic (cultural, religious, and linguistic) and/or economic factors (regional differences in income). In terms of noneconomic factors, southern Ireland was predominantly Roman Catholic versus the more protestant orientated north-east of the island and Britain. Linguistically there was a notable similarity as the majority of the island were native English speakers though a small share of the population spoke Irish (Gaeilge) as their mother tongue.Footnote 7 In the late 19th century, there was a concerted effort to revive the Irish language as part of a broader cultural nationalism movement;Footnote 8 however, this had only a limited impact pre-secession.
One of the most significant differences between these two groups was economic. Incomes were much lower in southern Ireland than in the rest of the UK – see Figure 2. Not only was southern Ireland relatively poor – especially in comparison with the metropole – it was also a laggard in the first decade of the century and subsequently.
(Colour online) Initial income and subsequent growth rates in Great Britain and Ireland
Labels: 1 London Counties; 2 Rest of South East; 3 South West; 4 West Midlands.
5 East Midlands; 6 North; 7 York & Humberside; 8 Wales; 9 Scotland; 10 Northern Ireland; 11 Ireland.
Source: Rosés-Wolff database, Reference Rosés and Wolf2020.

This lower income motivated demands for some element of devolution which had been a feature of nationalist Irish politics since the last quarter of the nineteenth century, with particular emphasis on control over tariffs to protect native industry. The view was encapsulated in the following quotation from a policy document written in 1929:
Free Trade between Great Britain and Ireland increased the combined wealth of both countries but we know from experience that the benefits were confined to Britain and that its effects in Ireland were wholly bad. It destroyed our Industries and struck down our population by more than half, within less than a century. If we were concerned only for the welfare of the old political unit known as the United Kingdom we should not deplore the decay of industry and loss of population here because they were more than counter-balanced by the growth of population and industry in the other island (Sean Lemass, quoted in Durkin Reference Durkan2010).
Nationalist politicians and propagandists in the late nineteenth and early twentieth centuries appear to have had clear views of what the economic benefits of an independent Ireland would yield. To them, independence either in the form of Home-Rule or legislative independence would see the development of ‘Irish’ industry via protection from international competition (Devlin and Barry Reference Devlin and Barry2019).Footnote 9 However, notably absent from this southern nationalist paradigm of economic development was the industrialised north of the island (Kennedy Reference Kennedy1991; Johnson and Kennedy Reference Johnson, Kennedy and Hill1996). For the wealthier north-east of the island, the benefits of integration were clear as the Union offered access to markets in UK and free trade elsewhere. Unsurprisingly, Unionists (in both the north and the south) held opposing views of political economy that perceived free trade as the foundation of their success.Footnote 10 The polarised views of the Irish economy, north and south, were crystallised before the outbreak of the First World War and the subsequent dislocation of the global economy (e.g., see Brownlow Reference Brownlow2006). Both polities that emerged from the partition of Ireland faced a changed and evolving economic environment and as small open economies, they were exposed to similar international economic trends.
As noted above, democracy is seen as a driver of secession in the Alesina and Spolaore (Reference Alesina and Spolaore2003) framework. The United Kingdom of Great Britain and Ireland operated as a parliamentary democracy which granted an incremental increase in enfranchisement over the nineteenth century. The UK was democratic and operated on a majority-voting rule, however urban industrial and rural agricultural interests diverged. Ireland was predominantly rural and, prima facie, it appears as a model case for the application of theories of secession, as the majority voted for a secessionist party (Sinn Fein) in 1918 after the franchise was significantly expanded. However, the validity of this democratic explanation of secession is diluted by de Bromhead et al. (Reference de Bromhead, Fernihough and Hargaden2020) who show that the franchise extension had little, if not a negative, impact on the 1918 election outcome. What mattered more were shifts in public opinion following the suppression of a violent republican uprising in 1916 and government efforts to introduce conscription in 1918. Socioeconomic status was also a significant determinant of voter behaviour as evidenced by stronger support for the Sinn Fein party among unskilled labour. Moreover, up until that point, there had been a separate tradition of political nationalism that had advocated devolved government rather than outright independence. In sum, in the aftermath of the Easter 1916 rising and World War 1, the popularity of the traditional nationalist party had been replaced by a growing desire for a sovereign republic.
However, the calls for both home rule and secession had masked urban–rural cleavages within Ireland itself. As Erskine Childers (1911, p. 170) astutely observed, ‘apart from the abstract but paramount question of Home Rule, there are no formed political principles or parties. Such parties as there are have no relation to the economic life of the country, and all interests suffer daily as a consequence. In a normal country you would find urban and agricultural interests distinctly represented, but not in Ireland’. These hidden tensions would surface at secession and play out in the early years of the new state as competing interests fought to implement their vision of independence. The minority unionist community, protestant in outlook, were still the major capitalists in the IFS and the owners of the majority of large businesses (Barry Reference Barry2021). The political economy of independence therefore required a delicate balance of urban and rural interests.
3. The Structure of the IFS Economy at independence
Both the IFS and NI inherited economic structures shaped by interactions with the increasingly integrated global economy of the late nineteenth century. The Irish (north and south) economy had operated in integrated commodity, capital, and labour markets. Commodity market integration was evident in the free trade practices of the UK and both agriculture and industry operated in competitive international environments where prices were a reflection of international conditions. Detailed trade statistics are unavailable for the nineteenth century; however, when the (Irish) Department of Agriculture and Technical Instruction began publishing trade statistics, it confirmed the reality that Ireland’s largest trading partner in terms of both imports and exports was Britain. Both capital markets remained integrated, the London money market was utilised by the Irish commercial banks and large Irish firms, such as Guinness, enjoyed direct access to London capital markets. As the IFS remained on the British pound, which returned to pre-war parity on the gold standard in May 1925, capital market integration prevailed. Similarly, labour markets were highly integrated and Irish emigration rates soared during the nineteenth century as migrants entered labour markets in both the New World and in Britain.Footnote 11 Between 1870 and 1914, an expanding global economy created the incentives and markets for both industry and agriculture in Ireland as a whole. However, these developments were dramatically interrupted by the outbreak of War in August 1914 and the Gold Standard was quietly suspended soon after (Broadberry and Howlett Reference Broadberry, Howlett, Broadberry and Harrison2005; Davis Reference Davis1994), ending a prolonged period of relative economic and monetary stability.Footnote 12
The First World War was something of a boom time for the Irish economy (north and south). Agriculture and industry profited from reductions in international competition and increased demands resulting from the War effort (Gribbon Reference Gribbon and Vaughan1996). Boom conditions are evident from trade data, which show how net exports peaked, in real terms, in 1918. The boom lasted until 1920 but was followed by a prolonged depression in prices both north and south of the border.Footnote 13 The war dislocated traditional migration patterns as transatlantic avenues were effectively closed off for the duration of the War. However, the War recruitment drive was an outlet for many would-be migrants. The revolutionary period (1919–21) led to some economic dislocation; however, as is evident from the trade data in Table 1, the economy did not come to a standstill.Footnote 14
External trade of all Ireland (£ million), 1904–1921

Meenan (Reference Meenan1970, table 3.1), deflated using the Saurbeck-Statist Price index
The service sector of the Irish economy was reasonably well developed in areas such as banking and finance, postal services, transport and retail. This is particularly true in the case of the financial system which was very advanced by international standards in terms of both monetization and depth (Kenny and Lennard, Reference Kenny and Lennard2018). The suspension of the payment of notes on demand during the war led to an increase in the note issue of Irish banks and contributed to the general inflationary environment (more discussion on banking below). Ireland had an extensive rail network, though the rail system had a significantly lower profit-to-mileage ratio than the British equivalent due to the nature of the lower-value goods it transported. During the War, railways throughout the UK were placed under state control and this policy remained in place in Ireland until 1921 (Meenan Reference Meenan1970, p. 159). State control resulted in wage increases to placate labour demands and contributed to heavy railway company losses in 1920 and 1921. The new polities therefore inherited an unhealthy transport infrastructure. Railways continued to struggle post-independence, net receipts per mile of Irish railways averaged only 15% of the British net receipts to mileage over the period 1922 to 1938. Increasingly, railways faced stronger competition from the more flexible alternative of motor vehicles.
The economy of the IFS differed markedly from NI in 1922. As a subsequent study explained, “the only part of the island which could be said to have experienced an industrial revolution, the North east, remained part of the United Kingdom” (Kennedy et al., Reference Kennedy, Giblon and McHugh1988, p. 130). As Table 2 shows, the NI economy contained the bulk of all-island industry, with the production of food and drink products dominating southern industrial output. Surplus labour remained a persistent problem post-independence and more than 5% of the IFS’s [1926] population emigrated in the period 1924–30 (Irish Trade Journal, various years). Surplus labour was particularly acute in areas where agriculture was predominant. While in Leinster (east), only 34% of the labour force was employed in agriculture, the share was as high as 78% in Connaught (west) and 73% in independent Ulster (north), while 54% of Munster’s (south) labour force was agricultural.Footnote 15
Sectoral Employment of Labour Force

Source: Census of Population 1926; Northern Ireland from Bradley (2006)
Two immediate problems that faced the Irish agricultural sector (north and south) at independence were falling output prices coupled with indebtedness accrued from expanding output during the war. Attempts to alleviate these problems were hampered by the fact that agricultural prices were determined on international markets. In particular, the resumption of exports from competitive countries played a role, primarily Denmark and New Zealand, who had restricted access to the British market during the War. Furthermore, the reputation of Irish agricultural produce was severely undermined by the unscrupulous and short-term exploitation of market power of Irish produce in British markets during the War. Attempts to improve the quality of produce were central to Cumann na nGaedheal’s agricultural policy in the 1920s.Footnote 16 These improvements helped restore the reputation of Irish produce that had suffered during the War (Kennedy et al. Reference Kennedy, Giblon and McHugh1988, p. 38).
In terms of industry, both the IFS and NI economies began the 1920s in difficult conditions, as prices for industrial output experienced a sustained downturn. The IFS in the 1920s has been criticised for failing to develop industry (e.g., McGarry Reference McGarry2014), but this is a charge liable to be laid against the wider UK (NI) economy of the time. The inter-war period saw the expansion and development of late nineteenth-century general purpose technologies (chemicals, electricity and internal combustion engines) to other areas of the economy (Gordon Reference Gordon2012). Industrial regions emerged in the south of England, which specialised in the production of new consumer goods (Johnson Reference Johnson1985). The traditional industrial regions of the UK suffered in the post-war downturn and struggled to return to pre-war output levels due to the changing nature of the international economy and distorted price structures. Staple industries of NI such as linen and shipbuilding, experienced falling prices, which in the case of the latter continued into World War 2, reflecting the excess capacity resulting from World War 1. The Harland and Wolff shipyard had some success diversifying out of shipbuilding, but their competitors Workman and Clark ultimately succumbed to liquidation (Johnson Reference Johnson1985). However, the linen industry went into terminal decline as demand contracted and it faced increased competition from artificial fibres. As both staple industries declined, unemployment in NI increased.
As noted above, the economic geography of industrial activity on the whole island of Ireland was concentrated in the north-east. Geographic concentration of industry was also a common feature across Europe. As a result, the newly created political boundary between the IFS and NI created a political necessity to develop industrial capacity within the IFS. One of the most famous industrial developments south of the border was the establishment of a Ford factory in Cork, although this pre-dated the establishment of the IFS. Ford’s personal (familial) connections may have motivated the choice of location more than purely business considerations (Jacobson Reference Jacobson1977; Grimes Reference Grimes2008). It had been established when Home Rule was anticipated (Barry Reference Barry2021). Britain was one of the main export markets but the introduction of McKenna tariffs on imported motor vehicles, introduced during WWI and maintained after the war to protect British industry (Foreman Peck Reference Foreman-Peck1979), affected its trade with Britain.
Another aspect of the IFS’s economic policy was the development of semi-state bodies. A prominent example of this is the construction between 1925 and 1929 of the Ardnacrusha hydroelectric dam by the German electrical firm Siemens-Schuckert.Footnote 17 The Electricity Supply Board (ESB) was established in 1927 to administer the distribution of electricity (Meenan Reference Meenan1970, p.172). The symbolism of the ESB and the construction of a modern hydroelectric dam were perhaps more important than its immediate economic function.
4. Fiscal foundations
The immediate threat facing the nascent IFS in 1922 was the civil war that arose out of differences between those who supported the Anglo Irish Treaty of 1921, and those forces that did not. The anti-treaty side primarily objected to swearing an Oath of Allegiance to the King in the new Dublin parliament and/or to recognising any border on the island of Ireland, as the Treaty had recognized. A bloody and expensive war waged until May 1923 when the last of the anti-treaty forces eventually surrendered. Both the Anglo-Irish War and subsequent Civil War led to enormous destruction of wealth both in terms of lives lost (human capital) and infrastructural damage (physical capital). A crude estimate of the cost of the Civil War alone made by Patrick Hogan in 1923 was of a minimum of £50 m;Footnote 18 a figure that equates to c. 32% of estimated national output of the IFS.
After the establishment of the IFS in 1922, the newly created government faced challenges putting its finances in order and had to rely on short-term borrowing from Irish banks for the first few months of its existence (Fanning Reference Fanning1978). There were also difficulties raising and collecting taxes in the early years due to evasion and avoidance (Meenan Reference Meenan1970, p. 245). Initial inquiries made by the Department of Finance to the Irish banks and the Dublin stock exchange about long-term borrowing suggested that a UK guarantee would be essential for a loan flotation to be successful. However, these views proved to be incorrect, the First National Loan was oversubscribed and succeeded without the assistance of the Irish banks (Fanning Reference Fanning1978).
In terms of trade policy, there was no stampede towards protectionism in the IFS (Devlin and Barry Reference Devlin and Barry2019). In fact, free trade was the norm in the 1920s as the UK (including NI) and the IFS attempted to return to pre-war orthodoxy. Although a Tariff Commission was established in the IFS, it did not result in a blanket introduction of tariffs (Devlin and Barry Reference Devlin and Barry2019). No formal trade agreements existed or were required between Ireland and the UK during this period as both partners adhered to pre-war orthodoxy.
Financial arrangements between Great Britain and Ireland had historically been at the heart of pre-independence debates over devolution (Jalland Reference Jalland1983). Ireland had been a net contributor in the UK exchequer in the nineteenth century but this pattern was reversed by the early twentieth century when it received more in transfer spending, in the form of pensions and land purchase, than it contributed in revenue (Jalland Reference Jalland1983). There was a view in Ireland that greater fiscal autonomy would allow the reduction of indirect taxes that affected the poorest. Instead, post-independence circumstances forced the government to reduce direct taxes. Income tax was cut to levels below those inherited from the Union. There were orthodox economic underpinnings to this policy as it would prevent capital flight and also to encourage return migration (Rumpf and Hepburn Reference Rumpf and Hepburn1977, p.74); however, a more important consideration was to keep Irish rates in line or below UK rates (see Figure 3) so as not to lose the few existing direct taxpayers resident in the IFS (Meenan Reference Meenan1970, p. 370). At the time there were proposals to completely abolish income tax altogether and rely on indirect taxation, but a compromise solution was to reduce income tax rates and reduce the duty sugar and abolish duty on tea (Meredith Reference Meredith1925). Moreover, owing to Edwardian social transfers, both the IFS and NI inherited a burgeoning welfare state, which included pensions and social insurance, which were unsustainable. The IFS policy of balanced budgets required cuts to be made in this area,Footnote 19 whereas NI was able to maintain welfare spending at British levels thanks primarily to a Westminster subsidy (Lawrence Reference Lawrence1965; Jordan Reference Jordan2020).
(Colour online) Income tax rate UK and Ireland
Source: Mitchell (Reference Mitchell1988, p. 645) and Meenan (Reference Meenan1970, Table 8.2).
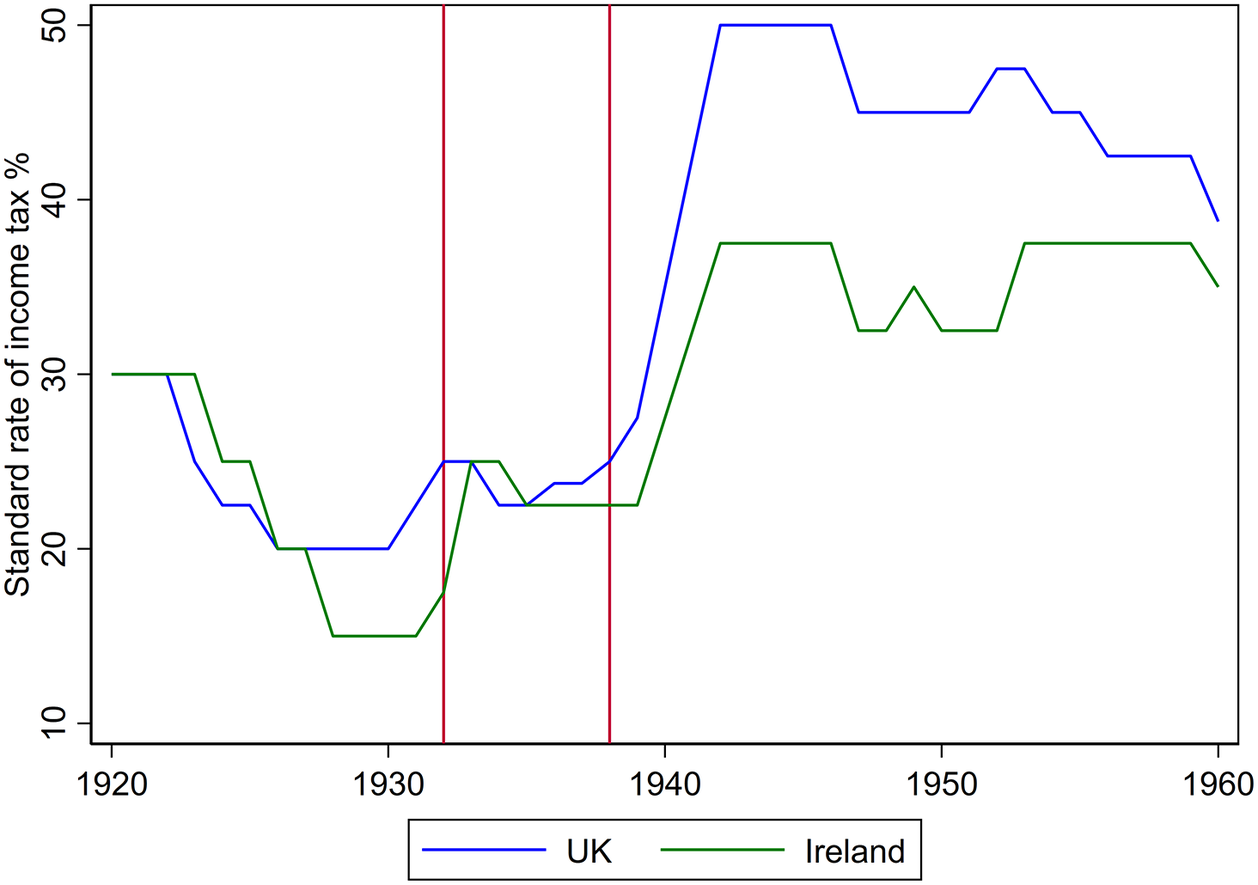
While income tax rates were purposefully kept below the British level to win approval of the middle classes in the newly independent state, a middle class that was protestant and unionist in outlook that paid the majority of income tax (Barry Reference Barry2021), increasing regressive taxation (such as customs and duties), which tended to increase inequality, was the only viable policy (see Figure 4 & 5). Due to the configuration of the economy, it has been claimed that this choice was largely “forced upon the Free State government,” which regrettably tended to favour the mass of people who had not been strong supporters of independence at the expense of the mass of people who had. While these taxation choices reflect the “triumph of pragmatism over dogma,” they should similarly reflect the vulnerable political position of the new administration.Footnote 20
(Colour online) The Sources of Irish Exchequer Revenue, 1922–26
Source: Government Finance Accounts, 1922/3–1925/26. Note: ‘Customs and Excise’ category above includes Motor Vehicle Duties, Estate Duties and Stamps; ‘Miscellaneous’ includes Post Office Revenue, Fees and Stamps. Financial Year end is 31st March.

(Colour online) Customs and Income tax share of total Revenue, 1923–1960
Source: Mitchell (Reference Mitchell1988).
Note: Vertical lines at 1932 and 1938 to highlight period coinciding with the trade war between UK and Ireland.

In the early years of the IFS, government revenue relied heavily on custom duty receipts compared to the UK experience. This was a continuation of the historical fiscal tradition where customs comprised a larger share of revenue in Ireland (Hynes Reference Hynes2014) and mirrors the experience of other developing countries of relying on customs before incomes are sufficient to generate adequate income taxes (Musgrave and Musgrave Reference Musgrave and Musgrave1989). Contemporary data convey a similar pattern where poorer countries tend to rely more heavily on trade taxes and higher income countries rely more on income taxes (Easterly and Rebelo Reference Easterly and Rebelo1993). Given the weak tax base, the government share of the economy grew slowly from 23% of national product in 1926/27 to 30% of national product by 1938/39 (O’Hagan Reference O’Hagan1980, table 3). Figure 6 reports that IFS government revenue was considerably lower (as a share of national product) than the equivalent for the UK.
Comparative Debt Dynamics, 1926

Source: The UK is from Crafts (2016). For Ireland, b and i are from the Government Finance Accounts, d and π are from FitzGerald and Kenny (Reference Fitzgerald and Kenny2019) and g is from Kenny (forthcoming), GNP is from Kennedy (Reference Kennedy1971).
Note: i is calculated as a share of the stock of debt. Π is the CPI from CSO composite.
(Colour online) Government Revenue as a share of GDP
Note: Vertical lines at 1932 and 1938 to highlight period coinciding with the trade war between UK and Ireland

While national accounting data is not yet available on an annual basis for Ireland before 1947, some benchmarks make comparison feasible in terms of debt sustainability. We can apply the well-established debt stabilizing ratio, b*, to consider Ireland’s fiscal position relative to the UK’s:
 $$ {b}^{\ast}\hskip0.1em =d\left(i-\pi -g\right), $$
where d is the debt ratio, b is the actual primary budget balance as it transpired, the nominal rate of interest is 𝑖 and the prevailing rate of inflation is π. The debt-stabilizing primary balance, b*, is the primary deficit required to keep the current debt ratio at its current level, given the other determinants. Table 3 presents fiscal data for 1926 which compares the case of the IFS and the UK.
The UK’s debt stabilizing primary balance (surplus) in 1926 was clearly untenable at almost 19% of GDP, though the year represents an outlier, as the average debt stabilizing ratio was lower at a surplus of 5.7% for the period 1925–9 (Crafts 2016). However, even this lower figure far exceeds the Irish equivalent. Ireland’s public debt ratio was less than a tenth of the UK equivalent in 1926 post-Anglo Irish Financial agreement (see Section 5). Indeed, if the price fall is overstated by the CPI (an inferior measure to a GNP deflator), this would imply that Ireland’s fiscal position was in fact, even more favourable than Table 3 suggests. Ireland’s b* did not prescribe the austerity required of 1920s Britain and offered policy makers of the newly independent state comparative breathing room in policy choices, though the binding commitment to sterling remained and other demographic and political constraints limited the scope for a more active fiscal policy.
The demographic composition of the new state was not promising for productivity or fiscal capacity. The population of the area of the IFS had declined from 6.5 million in 1841 to 2.9 million by 1926 (MacNeill Reference MacNeill1932). This persistent trend, aside from producing the “inevitable effects in the mind of those who directed operations of business and the flow of capital,” led additionally to pressures on the fiscal capacity of the state (MacNeill Reference MacNeill1932). This was reflected in the disproportionate numbers of very young and very old residing in the state (38% of population) who could not contribute significant tax revenue (Kennedy Reference Kennedy1971, p. 8). Furthermore, as an unusually large component of the population were classified for tax purposes as self-employed, raising revenue via income tax was historically difficult where incomes were generally low. Ireland had historically paid half the amount of income tax per capita as the rest of Great Britain (Hynes Reference Hynes2014). As noted above, Ireland purposefully maintained its income tax rate below the UK level; the fiscal competition between the old and new state meant the new state incurred a loss on tax receipts in order to avoid the risk of capital flight (Bolton and Roland Reference Bolton and Roland1997).
Demographic difficulties compounded an already delicate situation for the new state, as it was politically impossible to provide lower pension and other social welfare benefits than those which were offered within the UK. Especially problematic for the new administration was that in Ireland’s case, “pensions were in a class of their own” dwarfing other categories of social welfare payments, and represented a “boon” to the aged poor (Ó Gráda Reference Ó Gráda2000, Reference Ó Gráda2002). When the pensions were introduced contemporaries estimated that they would “absorb at one stroke nearly one-third of the total revenue of the country” (Jalland Reference Jalland1983; Barry Reference Barry2021). While UK pension payments consumed 5% of government expenditure and over 1% of GDP by 1930, the Irish equivalents still stood at 13 and 2%, respectively, even after substantial cuts (Ó Gráda Reference Ó Gráda2000). Although cuts occurred during a period of deflation, they had political ramifications for the incumbent government (Hynes Reference Hynes2014).
Using a rearrangement of the social transfer budget, we may shed some light on the fiscal and policy space available to policy makers. The following equation assumes no deficit or surplus in the purest form of a PAYGO system (Lindert, Reference Lindert2004, p. 195):
 $$ {{N}_{old}}\!\left/ {{N}_{young}}\right.=\frac{t\ast {Y}_{young}-u\ast r}{B}, $$
where $ {N}_{old} $
is the number of old people residing in the state,
$ {N}_{old} $
is the number of old people residing in the state, $ {N}_{young} $
is the working age population, t is the tax rate on the income Y of the workers, u represents the non-pension social benefits per recipient of working age and r is the share of working age population receiving non-pension benefits. A number of caveats should be mentioned with respect to both the data and the unique case of the IFS in the 1920s. As social welfare benefits were meagre, u and r are most likely overstated. Indeed, income is also likely to be overstated as it refers to GNP per head at market prices. The typical situation facing many OECD economies today is that the left-hand side (LHS) of this equation exceeds the right-hand side (RHS), leaving governments with difficult policy choices ranging from cutting B and/or u or raising t. The demographic solution is to increase the denominator (LHS) via incentivising larger families or increasing immigration. As Table 4 demonstrates, if one assumes that the working-age population were all paying income tax at the prevailing rate of 15%, one concludes that fiscal pressure on the new state was not significant. However, when one considers that only 60,000 people paid income tax (Kennedy et al. Reference Kennedy, Giblon and McHugh1988, p. 36), the “adjusted” arithmetic conveys an urgent need to act, with the number of the taxable young and their income pool shrinking considerably. Nonetheless, as outlined above, it is likely that indirect taxation featured much more heavily in policy considerations in funding pensions than income tax did, as imagined in this limited conjectural exercise.
$ {N}_{young} $
is the working age population, t is the tax rate on the income Y of the workers, u represents the non-pension social benefits per recipient of working age and r is the share of working age population receiving non-pension benefits. A number of caveats should be mentioned with respect to both the data and the unique case of the IFS in the 1920s. As social welfare benefits were meagre, u and r are most likely overstated. Indeed, income is also likely to be overstated as it refers to GNP per head at market prices. The typical situation facing many OECD economies today is that the left-hand side (LHS) of this equation exceeds the right-hand side (RHS), leaving governments with difficult policy choices ranging from cutting B and/or u or raising t. The demographic solution is to increase the denominator (LHS) via incentivising larger families or increasing immigration. As Table 4 demonstrates, if one assumes that the working-age population were all paying income tax at the prevailing rate of 15%, one concludes that fiscal pressure on the new state was not significant. However, when one considers that only 60,000 people paid income tax (Kennedy et al. Reference Kennedy, Giblon and McHugh1988, p. 36), the “adjusted” arithmetic conveys an urgent need to act, with the number of the taxable young and their income pool shrinking considerably. Nonetheless, as outlined above, it is likely that indirect taxation featured much more heavily in policy considerations in funding pensions than income tax did, as imagined in this limited conjectural exercise.
The Social Transfer Budget in a pure PAYGO System

Source: Equation adapted from Lindert (Reference Lindert2004). NOld and NYoung from Census of Population 1926/1930; Pensions and Income Tax Rates from Ó Gráda Reference Ó Gráda2000; GNP per capita from Kennedy (Reference Kennedy1971); Income tax payers from Kennedy et al. (Reference Kennedy, Giblon and McHugh1988, p. 36). U is calculated by summing relief schemes, health insurance and unemployment insurance in the 1925 government Finance Accounts, divided by working age population minus number “gainfully employed” in 1926 Census; r is calculated by working age population non gainfully employed as a total share of potential workforce from the Census.
Pension cuts were subsequently made in the 1920s but the decision to do so was a politically costly one and the damage done to the ruling party was “probably out of all proportion to the savings involved” as they remained above the British shares of spending and national income (Ó Gráda Reference Ó Gráda2000, Reference Ó Gráda2002). The pension became a defining issue between the anti-treaty Fianna Fáil and the governing pro-treaty Cumann na nGaedheal which lost the subsequent general election in 1932.
The other outstanding piece of Edwardian social spending in Ireland was related to land purchase in Ireland, the unresolved nature of the ‘Land Question’ (Foley-Fisher and McLaughlin Reference Foley-Fisher and McLaughlin2016b). Under pre-independence land acts the British government had borrowed extensively to finance the sale of land from landlords to tenants (see Foley-Fisher and McLaughlin Reference Foley-Fisher and McLaughlin2016b for a detailed description). The pre-independence land acts saw £99.87 million spent on land transfers, these were funded by state borrowing. No other polity in the UK was subject to this policy, much to the chagrin of politicians in Scotland and Wales.Footnote 21 During the Revolutionary period there was renewed agitation, primarily by those who had not been beneficiaries of land purchases. One of the first pieces of legislation in the new state was the 1923 Land Act and it was an attempt to complete the work of the pre-independence land acts and was reciprocated by the 1925 Land Act in NI. The IFS government could not have undertaken the 1923 Land Act without the assistance of the UK government. Dooley notes that ‘the sheer scale of the financial burden that the completion of land purchase alone would place on the state was enormous; the government’s willingness to carry that burden is merely more evidence of the perceived importance of the land question to contemporaries’. The scale of the 1923 Land Act, £30 million, was three times the extent of borrowing under the First National Loan (£10 million, see below). British authorities were supportive of the land act and given the renewed land agitation and did not want to see a failed state develop on their doorstep. However, while a guarantee was forthcoming, it came with a stipulation of British oversight such that the contents of the act had to be agreed with the British government (Dooley Reference Dooley2004, p. 58). Therefore, the only aspect of pre-independence social spending that was continued was with the support of the British state and could not have been financed by the new government by itself.
5. Sovereign debt
Article V of the Treaty proscribed that the IFS would accept its share of the UK war debt to be calculated at a later date. As outlined in greater detail by FitzGerald and Kenny (Reference FitzGerald and Kenny2020), the Treaty had stipulated that the shape of the border between north and south was to reflect the “wishes of the inhabitants”. Due to large Catholic majorities in certain northern areas, expectations of large transfers from north to south were prevalent in the IFS. However, when details of the confidential report were subsequently leaked, it became apparent that no substantial territorial change would be considered. Consequently, the fragile IFS government was thrown into a crisis, prompting urgent talks in London.
While the IFS government realised that neither the British nor NI administrations would entertain their complaints about the existing border, they lobbied persistently for an improvement of the civil rights of Northern Catholics. When this appeal, in turn, was rejected by the NI administration, the British government made a subsequent offer that the Boundary Report would be supressed and the status quo border maintained in return for waiving the IFS share of the UK war debt under Article V of the Treaty.Footnote 22
The debt relief that transpired, of between 80 and 100% of IFS GDP, represents the largest of the twentieth century as shown in Table 5. However, the economic benefits came at a huge political cost that materialised again in the 1960s with the eruption of the civil rights movement in NI and the subsequent “Troubles” that plagued the region during the following three decades.
Comparing IFS Debt Relief with Later Restructurings

Source: FitzGerald and Kenny (Reference FitzGerald and Kenny2020)
The IFS administration had survived this test and used the large debt relief agreement to save face against the bitter claims of betrayal by the anti-treaty forces. Having emerged from the civil war and the boundary crisis in 1925, for the remainder of the 1920s, “the prime preoccupation of the government…was with establishing the legitimacy of the new state” (Kennedy et al., Reference Kennedy, Giblon and McHugh1988, p. 255).Footnote 23
Contemporary international opinion of the new administration was generally positive. The Economist noted how the IFS government had ‘restored order within its boundaries and having completed its organisation as the Government of an independent unit, politically and economically, [it] is in a position to close the list of applications for its first national loan’.Footnote 24 With reference to the oversubscription of the First National Loan, it continued: ‘it is a notable event, which cannot be without important reactions upon the prestige and stability of the new system and as it is an internal loan, it constitutes a declaration of faith which will operate and continue to operate with cumulative effect. Abroad, the event will do much to wipe out the unhappy impression created by Irregulars’ [anti-treaty] hysteria, which has been so completely suppressed by Government firmness’.Footnote 25 Outstanding debts increased over the period 1923–1938 and National loans mainly traded at a premium (see Figure 7) with current yields ranging between 3 ½ and 5 ½% (Foley-Fisher and McLaughlin Reference Foley-Fisher and McLaughlin2016). Nonetheless, these were very low yields, comparable to UK consols, and low relative to other countries in Europe (e.g. see Eichengreen and Portes Reference Eichengreen and Portes1986, Eichengreen Reference Eichengreen and Sachs1989), due in no small part to the fiscal competition forcing balanced budgets and the adoption of a sterling peg (that is, no exchange rate risk).
(Colour online) Yield on Free State Debt
Sources: Dublin Stock Exchange; McLaughlin (Reference McLaughlin2015); Foley-Fisher and McLaughlin (Reference Foley-Fisher and McLaughlin2016).
Note: Vertical lines in July 1932 to highlight period coinciding with the trade war between UK and Ireland and in April 1938 to signify the end of the dispute with the Anglo-Irish Trade Agreement.

Thus, in view of both fiscal and redistributive policies, the Irish experience appears to run contrary to what secession theory predicts. The minority who had not supported secession benefitted, in the form of reduced direct taxation, while those who supported it bore the costs in terms of increased indirect taxes and reduced social spending. Continuous support from the UK for wider social redistribution policies, namely land reform, is what placated the majority. Without this cordial arrangement further civil unrest would have persisted. While this experience is in line with the increased cost of public service provision arising from secession, it also demonstrates how the secessionist group of the pre-independence era split into heterogeneous interest groups after 1922, each vying for its own preferences for fiscal and redistributive policy.
6. Currency and Credit
With a stable currency and banking system,Footnote 26 Ireland’s monetary history is considered dull and uneventful until the 1970s (Ó Gráda Reference Ó Gráda1994, Reference Ó Gráda1997). For example, the IFS (as well as the UK) did not experience any of the US-centric banking crises, as outlined by Friedman and Schwartz (Reference Friedman and Schwartz1971), between 1929 and 1933. Set against the backdrop of the instability of the interwar years among many newly independent countries in Eastern Europe, Drea and Barry (Reference Barry2021) argue that Ireland’s mundane monetary history should be celebrated. The Economist praised the IFS for not creating a separate currency.Footnote 27
There was hesitancy on the part of the new government to usher in any changes to the prevailing monetary system, which was effectively operated by private banks. This was mainly to do with the uncertainty that this would mean for the economy. The experience of hyper-inflation in post-War Europe was an obvious deterrent to any monetary experimentation. This is evident in Dáil Debates surrounding the 1926 coinage act when Major Bryan Cooper, a pro-business representative from Dublin who was formerly a Unionist MP, warned that ‘once you begin to tamper with currency you being to operate an inflation that leads to national disaster…the first step that France is now treading – the road to national humiliation, because she is absolutely unable to meet the demands of her creditors’.Footnote 28 Ernest Blythe, the IFS Minister for Finance, was also clear on this point: ‘I recognise very fully that any change in the currency position at the present time would have serious reactions’.Footnote 29 There were also warnings as to what a radical change could do to business confidence and that any tinkering with coinage ‘runs the grave risk of influencing the minds of others.’Footnote 30 Capital flight was also a persistent worry for policy makers, as evidenced by the lower income tax rates outlined above.Footnote 31 After independence, the maintenance of the monetary status quo suited capital owners, the Irish banking system, large firms requiring capital imports from Britain, and larger land owners. As with post-independence fiscal policy, it tended to suit the elite minority who had actually opposed secession.
Ireland had experience of fiscal administration through the offices of Dublin Castle during the Union (Hynes Reference Hynes2014).Footnote 32 While the IFS Department of Finance was structured along the lines of the UK Treasury (Fanning Reference Fanning1978), there existed no obvious template for how to operationalise monetary independence (Drea Reference Drea2014, Reference Drea2015). The League of Nations financial conferences in Brussels in 1920 and Genoa in 1922 had recommended that newly independent countries should establish Central Banks of issue (League of Nations 1920, p. 235; Federal Reserve 1922, p. 678). Many newly independent countries did so, Ireland did not.
IFS officials were aware of these recommendations but were hesitant to institute any sweeping changes to the prevailing monetary system. Ireland had been part of a monetary union with Great Britain since 1826 with the Bank of England acting as the central bank for the United Kingdom of Great Britain and Ireland. The Bank of Ireland, founded in 1783, was also one of Europe’s oldest “national” banks; the banks that subsequently evolved into Central Banks (e.g. compare with table 1.1. in Capie et al. Reference Capie, Goodhart, Schnadt, Capie, Fischer, Goodhart and Schnadt1994). Ostensibly, it may have served as the Central Bank for the new state, as historically, it performed several functions of a national bank,Footnote 33 having been formed by charter, enjoying political and financial privileges, and it had acted as a banker to the new state. However, there were also prominent commercial rivals and critics that disputed its privileges. As it had traditionally functioned as a protestant and unionist institution (Barry Reference Barry2021), a politically palatable alternative was sought instead.
The IFS government created a commission of inquiry into banking and currency in 1926.Footnote 34 The banking inquiry, chaired by the Columbia University Professor in banking Henry Parker-Willis, was only formally established in March 1926 but delivered its first report within 6 weeks owing to the urgency and importance of its brief (Moynihan Reference Moynihan1975, p. 42). Parker-Willis was purposefully chosen both for his expertise in commercial and central banking, but also as a non-British expert (Drea Reference Drea2014, Reference Drea2015). The Irish Currency Commission was established following the recommendations of the Parker-Willis’ commission, which was effectively a currency board. The resulting institutional structure, modelled on the US Federal Reserve system, aimed to serve and evolve with, rather than alter, the existing monetary system (Pratschke Reference Pratschke1969, Drea Reference Drea2015). Commercial bank control and adherence to gold standard remained as core tenets of the system. Ireland gradually converted its currency board into a central banking organisation, in line with other post-colonial countries (Capie et al. Reference Capie, Goodhart, Schnadt, Capie, Fischer, Goodhart and Schnadt1994). When a Central Bank was formally established in 1943, it did not expand its activities much beyond that of the Currency Commission (Moynihan Reference Moynihan1975, p. 70). Whether the Irish Central Bank operated as a central bank before 1978 is debatable (Honohan Reference Honohan1997).
The central recommendation of the Parker-Willis committee was a ‘definite acceptance and continuance of British sterling as a standard of value in Saorstát Eireann’, that is maintain the sterling peg (Parker-Willis et al. 1926). The rationale behind this decision was primarily due to historic trading links with Britain and a weaker currency was seen as a disadvantage. However, it was noted that a change in this relationship could be revisited when the ‘business going to other parts of the world will undoubtedly increase’ (Parker-Willis et al. 1926).
With a de-facto common currency during the 1920s, the IFS and NI shared a similar monetary experience (Daniel Reference Daniel1976). The Irish pound was pegged to Sterling and experienced similar trials and tribulations associated with the restoration of Sterling to its pre-war parity experienced in Britain. Deflationary pressures acted on the economy as the IFS adhered to balanced budgets and ‘sound finance’ (Daniel Reference Daniel1976, pp 58–59).
When Britain abandoned the gold standard on 26 September 1931, the IFS followed shortly after. The IFS pound was essentially a sterling‑backed currency (Bielenberg and Ryan Reference Bielenberg and Ryan2012). The close relationship between British and Irish monetary regimes is reflected in price levels illustrated in Figure 9.Footnote 35 Writing just a few years before the historic sterling link was broken, a former director of the Central Bank of Ireland reflected on the peg, noting that despite various changes and devaluations, the sterling link ‘has been accepted by successive governments, by Dáil Eireann and by the public at large as being, on the whole, in the best interests of the community’ (Moynihan Reference Moynihan1975, p. 66). Honohan (Reference Honohan1997) suggests that the instability of the floating exchange rate (1979–1998) compared with memory of the stability of the sterling peg led to support for adoption of the Euro as Ireland’s currency from 1999.Footnote 36
(Colour online) Irish “Punt” and UK Pound exchange rate against the dollar
Sources: Corbet and O’Connor (Reference Corbet and O’Connor2020); Bank of England, Millennium of Macroeconomic data; and Central Bank of Ireland Exchange rates
Note: Vertical lines between 1932 and 1938 to highlight period coinciding with the trade war between UK and Ireland. Vertical line in March 1979 indicates break of sterling peg.

(Colour online) Price stability: UK and Ireland inflation rates
Source: Bank of England millennium of macroeconomic data and Central Statistics Office of Ireland Note: Vertical line in 1979 to highlight the break of sterling peg.

The peg to the British pound was also advantageous during the Great Depression because, as Eichengreen argues, countries that left the Gold Standard earlier experienced a more rapid recovery.Footnote 37 In other words, by following British monetary policy,Footnote 38 the IFS may have been spared a potentially worse fate through the 1930s. Although it must be acknowledged that several countries, such as Australia and New Zealand, had left gold prior to Britain (Eichengreen and Sachs Reference Eichengreen and Sachs1985), so it may have been possible to depreciate prior to 1931 if a more independent monetary policy was adopted. The economies of the Nordic countries experienced a stronger recovery than the United Kingdom after leaving gold, as they benefited from lower real wages (Eichengreen and Sachs, Reference Eichengreen and Sachs1985; Crafts, Reference Crafts2014).
After the flotation of Sterling, the wisdom of policy of adhering to the sterling peg was questioned, to which the Minster for Finance responded: “If British currency were going to collapse like the [Reichs]mark eight or nine years ago, then we might have to make up our minds that, cost what it might, be the inconvenience what it might, we would have to break from it. But, if we do not anticipate that, then the advantages of being level with British currency are so great that no matter what sort of institution we had in the way of a central bank, what happened is exactly the thing that would have happened, that is, we would have followed British currency”.Footnote 39 However, the opinion of the government appears to have been that leaving gold was a positive development.Footnote 40
As Capie et al. (Reference Capie, Goodhart, Schnadt, Capie, Fischer, Goodhart and Schnadt1994) outline, even if a country operates a currency peg, considerations of national pride invariably lead to the formation of a separate national currency and central bank-Ireland was no exception. While Ireland had its own note issue, these were sterling-backed notes. The population of prominent Irish commercial banks in 1921 are listed in Table 6. In practical terms, what the 1927 currency act did was swap (convert) the old fiduciary note issue from the 1845 Bankers (Ireland) act with a new fiduciary issue (backed by sterling securities). It widened the privilege of note issuance to all banks, to the chagrin of the incumbent monopoly rights holders (primarily the Bank of Ireland which saw its share of note issuance diluted), and gave a small seigniorage income to the state, estimated to be £275,000 - £300,000. As the banks had operated on an all-island basis pre-1920, reform in the IFS meant that, in theory, banks could issue their entire fiduciary allowance in NI. This created uncertainty for both the IFS and NI economies and was immediately followed by a reform of banking laws in NI in 1928 (Pratschke Reference Pratschke1969). The main criticism of the new note issue came from Andrew Jameson,Footnote 41 director of the Bank of Ireland, whose main gripe was with the note issue; however, this appears to primarily be because the Bank of Ireland was losing its traditional privileges.

Banking practices, namely the structure of bank assets and liabilities as well as branch banking, however, were unchanged from the pre-partition period. The creation of a political border did not result in the establishment of an ‘Irish’ (north or south) money market and Irish banks continued to use the facilities of the London money market.Footnote 42 From a technical standpoint, secession meant that the IFS-based banks were exporting capital and put the IFS in a strong financial position (Ó Gráda Reference Ó Gráda1995).
Figure 10 presents the official and private external reserves held by the IFS. The private external reserves were held by banks as deposits in London, in no small part a legacy from the agricultural boom at the end of the First World War. This also meant that the discount rate operated by Irish banks (later the Central Bank) followed Bank of England rates with a premium to discourage capital flight (see figure 11). Currency Board external reserves averaged 5.7% of GDP, this more than doubled under the Central bank averaging 13.2% of GDP between 1943 and 1972. In both instances there was an inverse relationship between commercial bank external reserves and official external reserves, under the Currency Board regime commercial bank external reserves averaged 42.9% of GDP and under the Central Bank 27.9% of GDP. Only taking into account official reserves, the Irish experience is similar to that of a floating currency today, such as New Zealand (6.2% of GDP), but including both public and private external reserves, makes it similar to countries such as Singapore (63.4%) who operate a mixed basked peg (Tetlow and Soter Reference Tetlow and Soter2021, Table 1).
(Colour online) External reserves held by the Currency Board/Central Bank of Ireland, 1928–1972
Source: Moynihan (Reference Moynihan1975).

(Colour online) UK and Ireland bank rates
Source: Mitchell (Reference Mitchell1988); Moynihan (Reference Moynihan1975).
Note: Vertical lines at 1932 and 1938 to highlight period coinciding with the trade war between UK and Ireland.

7. Trade
While no banking crisis occurred in the 1930s, the Great Depression nonetheless led to rising unemployment. The strain on US and UK labour markets meant that the surplus labour that had traditionally emigrated now remained within the IFS, prompting a demand for changes in domestic economic policy.Footnote 43 Import tariffs were introduced in November 1931 to prevent dumping; these were comparable to measures in the UK (which applied to NI).
The election of Fianna Fáil in February 1932 is seen as a radical change in economic policy in the IFS. Yet the 1930s were characterised by three separate factors: the Great Depression, the Economic War, and Fianna Fáil protectionist policy. All three are interrelated and difficult to disentangle, thus it is difficult to make definitive statements over which factor had the greatest impact (Kennedy et al. Reference Kennedy, Giblon and McHugh1988, p.44). NI also experienced the Great Depression but increasingly operated under protection, as the UK implemented protectionist measures. The NI agricultural sector also received protection and subsidies from Westminster. However, the NI government was unable to attract and develop new industries as it was essentially insolvent. As a result NI had some of the highest regional unemployment rates in the UK.
The creeping protectionism of the IFS must be seen both in the context of the global depression and in the light of an Anglo-Irish trade war following a default by the IFS on inter-governmental obligations. The tariffs introduced in 1932 were primarily the result of a political dispute that erupted when the IFS defaulted on land bonds and other obligations agreed under the Treaty and subsequent financial settlements. The bonds were guaranteed by the UK government and the repayments of loan instalments under the pre-independence land acts, were withheld by the newly elected IFS government. In total, these payments amounted to £5 million per annum. Foley-Fisher and McLaughlin (Reference Foley-Fisher and McLaughlin2016) illustrate how the default impacted on Irish land bonds, securities issued to finance Irish land reform. Prior to the default in 1932 there was a premium on land bond yields reflecting the uncertainty that bondholders had regarding the repayment of these bonds. When the Irish government defaulted on the bonds, the British Treasury met its guarantee and the premium on land bonds disappeared. At the same time, the premium on land bonds issued by the IFS increased.
The political context of the annuities dispute helps to understand the underlying motives of the Fianna Fáil administration. The annuities were part of a deliberate strategy to remove the remaining vestiges of the Treaty that were unpalatable to De Valera and his Fianna Fáil colleagues (e.g. the Oath of Allegiance to the British Monarchy and the Governor General) (McMahon Reference McMahon1984). The British response to the default was to levy tariffs on IFS imports,Footnote 44 most notably cattle, in an attempt to recoup the expense of servicing these debts. This too was politically motivated as it was believed that by hurting Irish farmers it would undermine the support for Fianna Fáil. However, the IFS immediately retaliated against the British tariffs with its own counter-tariffs. The dispute led to further tariffs levied on the IFS by virtue of it being unable to reach an accord at the Ottawa meeting of the Commonwealth. Also, the dispute did not harm the electoral prospects of Fianna Fáil and when the opposition Cumann na nGael declared that it too supported Fianna Fáil policy, attempts were made to reach a settlement. The economic war was gradually ended with bilateral trade agreements between the UK and the IFS in 1934 and then again in 1938. The 1938 Anglo-Irish agreement led to the payment of a lump sum of £10 million as a settlement for the underlying default, and further agreements were also reached on trade and on the treaty ports.
The argument for economic nationalism along the lines of import substitution/infant industry protectionism took its roots in Griffith’s (1918) ‘Sinn Fein policy’ and the first Dáil programme. Inspired by the writings of German economist, Friedrich List, Griffith became convinced of the ‘clear lesson that a system of tariff protection and of economic nationalism was seen to have worked well in Germany and thus provided a model for Ireland’ (McCartney, Reference McCartney1973). The implementation of these ideas through the protection of Irish industry can also be viewed as a nationalist solution to the problems of unemployment and emigration from the IFS which continued throughout the 1920s and 30s, although slowed somewhat by the depressed economic conditions abroad. The 1930s is seen as a radical change given the protectionist policies adopted by Fianna Fáil but in the context of the time there was not much else the government could do given the self-imposed monetary constraints of the IFS. Nonetheless, in an international context, the extent of the Irish move towards protection can be considered comparatively mild (O’Rourke, Reference O’Rourke2017). Apparent gains in employment are evident from existing statistical material although serious doubts have been raised about the Irish censuses of production as the increases in employment have been attributed to the wider scope of the returns. Daly presents data on the employment in manufacturing (shown in table 7 below) and the distribution of employment and output throughout Ireland. Protected industries – despite local lobbying – were primarily located around key ports as they were dependent on imported raw materials and the majority of employment was located in and around Dublin. Further efforts were made to increase employment in agriculture by encouraging tillage, however here too there were limited gains.

Trade flows did not change much in the decades following secession and the IFS remained heavily dependent on the UK. As the Parker-Willis Committee observed ‘Saorstat is now, and will undoubtedly long continue to be, an integral part of the economic system at the head of which stands Great Britain’ (Parker-Willis et al. 1926, section 6). The bulk of IFS exports were still absorbed by the UK (see Figure 12); however, after independence, internal trade between north and south of the island was classified as international trade. The IFS exports were predominantly agricultural commodities reflecting the limited industrial base of the economy (see Figure 13). Imports from the UK decreased somewhat (see Figure 14), but here trends are clouded by changes in country of origin classification. Furthermore, from the 1930s onwards Irish farmers faced an increasingly protected UK agricultural market, thus highlighting that not all impediments to trade were from the Irish side.


The Irish current account typically experienced a trade deficit as imports exceeded exports (Figure 15); however, this was financed by the capital account in terms of net income from overseas investments, emigrant remittances, and income from visitors (Geary Reference Geary1951). As Meenan (Reference Meenan1970) noted, there was ‘no normal year’ where the trade balance was favourable and this was exacerbated in exceptional years, such as 1947 and 1951, when imports were 30% and 40% higher than exports. Ultimately, as a small open economy, foreign trade was always an important feature of the Irish economy and by the mid-1960s it had one of the highest export and import shares of national income in the OECD (Meenan Reference Meenan1970). This placed a heavy burden on capital account to prevent balance of payment crises. The increased use of import substitution as official policy from the 1930s led to a decrease in sterling reserves (Brennan et al. 1938, paragraph 153), exacerbated by the War, and culminated in a series of balance of payment crises in late 1940s and early 1950s (see Figure 16). The latter led to an increase in emigration, particularly to Britain where there continued to be an open labour market for Irish migrants. Irish economic policy was therefore buffered by two pre-independence legacies: integrated financial markets that led to sizeable external reserves and integrated labour markets that absorbed excess unemployment in Ireland. Without these safety valves perhaps Irish economic policy may have evolved differently.
(Colour online) Current account Ireland and UK
Source: Mitchell (Reference Mitchell1988).

(Colour online) Balance of Payments Ireland and UK
Source: Mitchell (Reference Mitchell1988).

8. Lessons for today?
From a purely efficiency perspective, the break-up of a country is never desirable; however, all the benefits of unification may not, or may not be perceived to be, evenly distributed (Bolton and Roland Reference Bolton and Roland1997). Ireland’s secession was partly inspired by a rhetoric that emphasised over taxation and a trade policy that did not suit a society that was a figment of nationalist imagination. The reality did not suggest over taxation, but rather generous social spending. An unprotected Irish society under the Union was a fictional entity. Indeed, a substantial share of the Irish economy had benefitted from free trade with the neighbouring island. The binary division between nationalist and unionist hid the multitude of visions for an independent Ireland within the nationalist community and the resulting political economy highlights some of these contradictions; the benefits of secession were not evenly distributed.
One of the most challenging issues for a dissolving nation state is how fiscal liabilities will be apportioned. Although the United Nations 1983 Vienna Convention provides guidelines for transferring debt to seceding regions, it does not impose any legal obligation nor even suggest criteria for determining the allocation of debts (Williams and Harris Reference Williams and Harris2001). Without guidelines, a seceding region typically must negotiate what fraction of the existing fiscal burden it will receive as a liability. In addition to sharing onus for outstanding sovereign bonds, negotiations may include such liabilities as state pensions, state-owned enterprises and unemployment benefits. Moreover, these deals may extend to non-pecuniary considerations, such as the boundary of regional independence, monetary policy and reparations for costs incurred during the path to independence (Foley-Fisher and McLaughlin Reference Foley-Fisher and McLaughlin2014).
Unsurprisingly then, the business of ascribing fiscal responsibility within a disintegrating state is complex and erratic. In the event of Scottish independence, the UK Treasury issued a communique stating that it would honour existing debt but that an ‘independent Scotland would become responsible for a fair and proportionate share of the UK’s current liabilities’ (UK 2014).Footnote 45 The Irish case offers lessons but they highlight the complexities of the political economy involved in such a contingency. The IFS was granted debt relief for accepting a permanent border on the island of Ireland. Scotland does not have a similar bargaining chip to achieve such a debt write-off. Arguably, however, a comparably contentious and divisive issue would be for the SNP to leverage debt write-off in exchange for abandoning its non-nuclear stance and allow the continued use of Faslane as a port for housing nuclear submarines. Without Faslane, the UK would be unable to maintain its current nuclear deterrent capability in its existing capacity. It relies not only on the submarine base on the Gareloch at Faslane, but also depends upon the facilities at Coulport on Loch Long, in addition to availing of the use of Scottish internal and territorial waters (Gower Reference Gower2021).Footnote 46 Even if it did, the sacrifice of national assets for a reduction in national debt may be a step too far for domestic stakeholders. In the Irish case, the national compromise led to five decades of a sectarian NI administration which eventually gave way to 30 years of violence after the Civil Rights movement emerged in the late 1960s.
The Union of Great Britain and Ireland was a political, fiscal and monetary union. The secession of the IFS from the Union in 1922 ended the political and fiscal union but the monetary union, through accident and design, remained intact until 1979. Currency remains central to the Scottish independence debates, however ‘sharing’ a currency may not be an ideal policy option (Roy Reference Roy2022). The currency question was serious but there was no immediate attempt to address it as ‘legislation on so vital a matter as currency would probably have created public alarm’ (Brennan Reference Brennan1931). The IFS solution was to establish a currency board and maintain a peg to sterling. This lasted for over 50 years. This decision effectively sacrificed monetary policy. However, as a small country highly integrated with its nearest neighbour, it would not have had much control if policy was not aligned with that of Great Britain. Rate cuts could not be enacted if not harmonised with Britain as it would lead to capital outflows, as witnessed in 1955 (Honohan and Ó Gráda Reference Honohan and Ó Gráda1998). Furthermore, while fiscal policy was “independent”, the emphasis on convertibility ensured that it could never in fact operate in isolation to monetary considerations.
The Sustainable Growth Commission (SGC) recommends the continued use of sterling for Scotland and the introduction of a new currency backed by sterling (Wilson et al. Reference Wilson2018, C1.23). There is also an acknowledgment of Scotland’s existing fiscal deficit. However, it notes that ‘a 6–7% fiscal deficit is not sustainable and action will be required to reduce it to more sustainable levels’ and that ‘a sustainable fiscal position is a strategic priority for small advanced economies’ (Wilson et al. Reference Wilson2018). It seems to recognise that operating a pegged currency requires significant fiscal discipline, something which is best captured by assessing the medium-term fiscal stance, rather than reliance upon assessing annual budget data alone (Kenny and McLaughlin, Reference Kenny and McLaughlin2022; Lane, Reference Lane1998). Ireland learned this painful lesson after the Euro crisis revealed it to contemporaries. Similarly, operating a currency peg would require the maintenance of substantial external reserves. As documented above, Irish official reserves were supported by private reserves, particularly in the early years of independence, but when these private reserves depleted, greater balance of payments tensions arose.
Speaking in the aftermath of the British unilateral decision to leave the gold standard, Ernest Blythe realised this constraint, ‘with our trade relations with Great Britain, whether we had a central bank or whether we had not a central bank, we would have followed and would be bound to follow the British currency’.Footnote 47 Later, when Ireland exercised monetary independence (see figure 8 above), it came at a fortuitous time as sterling had experienced an unparalleled appreciation, rising by 55% between 1977 and 1981 (Chick Reference Chick2020,p. 319).Footnote 48 There were several reasons for this, but it was primarily due to the discovery of oil in the North Sea, and the appreciation had adverse effects on the UK tradable sector (Bean Reference Bean and Marston1988). Therefore, similar to Alesina et al.’s (Reference Alesina, Spolaore and Wacziarg2000) argument regarding trade openness, freedom to leave the peg offset the impediments of country size. The benefit of flexibility in a currency board arrangement is something that Ghosh et al. (Reference Ghosh, Gulde and Wolf2000) stress in their review of monetary arrangements in the aftermath of the dissolution of the Soviet Union. Nonetheless, when Ireland abandoned the sterling system in 1979, fiscal policy lacked a disciplinary anchor and a number of misguided public borrowing and expenditure increases, combined with rising global interest rates, placed her public finances and economy in considerable jeopardy until the end of the 1980s.
Although the IFS attained political and fiscal independence, it remained economically tied to the UK. Not until Ireland joined the EEC/EU in 1973, was there a significant change in the structure of Irish trade relations and a growing diversification in trade patterns. Dependence on the UK was reduced slowly over time but major problems in the IFS economy remained unresolved (e.g., small under-capitalised farms in agriculture and the low productivity of IFS manufacturing). Barry (Reference Barry2014) argues that political independence was associated with attempts to reduce economic dependence on the former dominant partner.
As Ireland was a small and open economy, trends in the international economy were important factors. However domestic policies, such as fiscal incentives for foreign investment and investment in education, played an important role in later development. Similarly, issues of tax competition are relevant for Scotland. For example, at present Scotland operates a marginally higher rate (1 percentage point higher) on higher income bands, the most mobile contributors to the tax base. While a newly independent government may wish to extract more revenue from this group at independence, the political economy of secession, and more explicit tax competition, may temper these urges. These lead onto a final issue of contention: current and future pension contributions. While the SGC claims that ‘taxes raised in Scotland are sufficient at present to fund all devolved services plus welfare and pensions’, there is a lack of acknowledgement of the fact that Scotland has an older population.Footnote 49 Quite clearly, pension sustainability will be an issue that needs to be addressed as part of the fiscal deficit. In the case of the IFS, we have seen that measures to tackle the pension issue can have a disproportionately negative political response.
Similarly, any Scottish temptation towards protectionism should remember Fianna Fáil’s protectionist policy in the 1930s in the IFS. It led to short-term gains in terms of employment but also meant slower economic growth in the future as Ireland remained with a weak industrial sector with low productivity. While a Scottish entry to the EU (and the EU customs union) is the more likely alternative policy choice, such a step will automatically imply protection against a remaining rump UK market. The difficulties of achieving “alignment” or smooth passage of goods across borders have been demonstrated in recent years and a “hard border” may become part of the political dialogue.
In sum, as Rumpf and Hepburn (Reference Rumpf and Hepburn1977, p. 219) concluded, ‘nationalism in Ireland, as elsewhere, has been more directly concerned with securing the power of the nation to direct its own destiny than with achieving prosperity or social progress as such’. Ultimately, as O’Rourke (Reference O’Rourke2017) argues, independence was essential for Ireland to exploit its later membership of the European Union, as it gave the nation policy flexibility that other regions of the UK did not possess.
Funding statement
This paper is funded by SFI-IRC Pathway Programme Project ID: 21/PATH-A/9390.


 Open access