


INTRODUCTION
Legionnaires' disease (LD) is a form of pneumonia caused by bacteria from the genus Legionella. The incubation period is typically 5–6 days but ranges from 2 to 14 days following exposure to aerosolized water containing the bacteria [Reference Cunha, Burillo and Bouza1]. The first outbreak of LD was identified in July 1976, when an unknown acute respiratory disease occurred in attendees at the 58th Annual Convention of the American Legion in Philadelphia [Reference Sanford2]. Sporadic cases of LD are typically related to exposures to aerosolized water from water-containing appliances such as air conditioners, hot tubs and humidifiers. Numerous large outbreaks of LD have been reported associated with cooling towers, which distribute aerosolized plumes to relatively large areas [Reference Dondero3–Reference Ulleryd5]. There is a general seasonality to the disease, with cases occurring more commonly during the humid and warm months from June to October in the Northern Hemisphere [Reference Ng6].
There have been multiple LD outbreaks reported in Canada, and they have all occurred during summer and autumn [Reference Lévesque7–Reference Ng9]. One of the most recent outbreaks occurred during July–September 2012 in Quebec City where 13 people died and 170 cases were reported. The source of this outbreak was found to be a water-cooling tower [Reference Lévesque7]. Another notable outbreak occurred during September–October 2005 in an Ontario long-term care facility that resulted in the deaths of 23 people and illness in another 112. The outbreak was traced to an air-conditioning cooling tower [Reference Gilmour8] and established the ST222 sequence type as a newly emergent clone whose geographical distribution has since been observed as stretching from Ontario to upper New England and the mid-Atlantic states [Reference Tijet10, Reference Kozak-Muiznieks11].
An epidemiological analysis of Legionella testing from Ontario (1978–2006) found 1401 cases, mainly elderly and male, and demonstrated seasonality with cases occurring in late summer to early autumn [Reference Ng9]. L. pneumophila replicates environmentally within freshwater protists [Reference Fields12] and has an optimal growth temperature of 35 °C [Reference Wadowsky13]. When adjusted for seasonality, the incidence of sporadic human legionellosis correlates with increases in humidity [Reference Ng9, Reference Fisman14], consistent with the observation that L. pneumophila survival in aerosols is diminished under conditions of low relative humidity [Reference Berendt15, Reference Hambleton16]. Based on these observations, the prevailing weather conditions of Calgary – a generally semi-arid climate with warm and dry summer months and subzero conditions during the winter months – do not appear conducive to Legionella [Reference Ng6, Reference Lévesque7, Reference Ng9, Reference Hicks17]. Remarkably, we report an outbreak of LD that occurred in November and December 2012 within a specific inner-city district in Calgary, Canada during a period of subzero outdoor temperatures and low precipitation. The primary objectives of this outbreak investigation were to describe and analyse the following: epidemiology of the cases, additional case-finding measures, environmental sampling, prevailing meteorological conditions, case geomapping, microbiological testing and whole-genome sequencing of available isolates and to provide a reasonable hypothesis as to how this unusual outbreak occurred. Outbreaks with the potential to challenge our preconceived notions of LD exposure are important for modifying practices to reduce the risk of disease.
MATERIALS AND METHODS
Case definition, case-finding and investigative analyses
LD cases were defined as having: (1) a positive urine antigen for L. pneumophila serogroup 1 (LP1) within the clinical context of respiratory infection/illness; (2) symptom onset on or after 1 November 2012; (3) a history of residing/visiting/working within a 2 km radius of a Calgary inner-city district 2 weeks prior to symptom onset. No out-of-province LD cases met the case definition. A Centers for Disease Control and Prevention standardized legionellosis questionnaire [18] with minor modifications was administered to collect demographic information, illness information, and potential environmental sources. In addition, we extended case-finding efforts to identify cases that may have been exposed locally but manifested themselves outside of the province or elsewhere in the country. This standardized questionnaire provided the basis for further hypothesis generation and environmental testing. Confirmed cases admitted to intensive care were considered to have severe illness. Details of the cases including demographics, risk factors, absence of travel history and results of microbiological and serological testing were analysed using basic descriptive epidemiological techniques and presented in tabular and/or text format. To identify other potential cases, a communication was sent on 3 December 2012 to Calgary area physicians requesting them to be alert for patients with clinical signs and symptoms of Legionella infection and risk factors, with recommendation for laboratory testing of suspect cases.
For additional case-finding investigation, all lower respiratory tract specimens from patients from 1 October to 19 December 2012 in Calgary that were negative for influenza A/B and the Luminex respiratory virus panel were identified using the Data Integration for Alberta Laboratories (DIAL) tool. These specimens were tested for L. pneumophila using real-time PCR as described previously [Reference Fathima19]. All reported LD cases in Calgary for the previous 14 years (1998–2011) were also reviewed: of 35 laboratory-confirmed cases, 33 were sporadic (unlinked) of which 22 had no history of travel outside Alberta (Alberta Communicable Disease Reporting System).
Environmental sampling and testing
Sites for environmental sampling were chosen on the basis of the responses to the relevant sections of the standardized questionnaire pertaining to hypothesis generation and applying principles known about Legionella sources and knowledge of our local setting. We conducted an extensive review of potential water sources in the area of concern but because of sub-freezing point temperatures, office building cooling towers were not operational, which limited the number of sites. Water samples were acquired from household kitchen, bathroom and shower taps of confirmed cases; additional samples were taken from humidifiers where applicable. Further hypothesis-based sampling of potential community exposure sources occurred; these sites included grocery stores and water taps in office buildings frequented by confirmed cases. Samples taken from the grocery store included water specimens both distal and proximal to endpoint vegetable misters, given prior descriptions of an outbreak associated with such a source [Reference Mahoney20]. Piping from the water distribution system of the grocery store was also taken for microbial analysis. Air-conditioner systems in apartment and office buildings were not sampled since they were not functioning at that time of year. We also examined all operational cooling tower sites located within and upwind of the 2 km radius area of interest. Environmental samples were tested by cultures grown on buffered charcoal yeast extract (BCYE) and BCYE-PCV (polymyxin B, cycloheximide and vancomycin) agar which are recommended for use in the cultivation and primary isolation of Legionella spp. in water [Reference Rice21].
Meteorological conditions
Data from historical weather records at the Calgary International Airport (Calgary, Alberta) was collected and reviewed (https://weatherspark.com/history/28433/2012/Calgary-Alberta-Canada). This is an official weather recording site in the city with records dating back to July 1955. Our primary focus was on daily recordings of temperature, precipitation, humidity, and wind speed with reporting of daily low and high readings plus means with percentile bands from the 10th–90th and 25th–75th percentiles, respectively, displayed in graphical format.
Case geomapping
A map of the downtown Calgary area was reproduced from Google Maps (www.google.ca/maps). Searches of known construction websites in the affected sector of Calgary were conducted to identify procedures that may have produced aerosols. OpenStreetMap (www.openstreetmap.org) and Leaflet javascript libraries (www.leafletjs.com) were used to create a georeferenced map of Calgary's downtown area to which data points were added. These included the locations each individual visited (residence, business, work, social) as well as active construction sites and fire incidents during the described time period.
Microbiological testing
Urine antigen testing and culture of respiratory specimens and blood were performed at Calgary Laboratory Services (CLS) using standard protocols [Reference Edelstein and Versalovic22]. Preliminary identification of isolates suggestive of L. pneumophila was performed using MonoFluo™ L. pneumophila indirect immunofluorescent antibody test kit (Bio-Rad Laboratories, Canada). All primary specimens and potentially positive culture isolates were sent to the Alberta Provincial Laboratory for Public Health for molecular testing of primary respiratory specimens and culture-positive isolates. Sequence-based typing of all PCR-positive primary specimens and culture isolates was also performed using the ESGLI protocol using a direct PCR method [Reference Mentasti23]. Culture-positive specimens were confirmed by indirect fluorescent antibody from individual colonies at the Provincial Laboratory and the isolates were sent to the National Microbiology Laboratory for serotyping [Reference Helbig24] and whole-genome sequencing.
Serological testing
Serum specimens collected from cases and household contacts and sent to Public Health Ontario Laboratories (Toronto) for L. pneumophila immunofluorescence antibody serological analysis looking for a single titre of ⩾1 : 256 or a fourfold seroconversion to ⩾1 : 128 in sequential serum samples [Reference Gilmour8].
DNA isolation and genome sequencing
Genomic DNA was extracted from 48-h cultures [Reference Gilmour8] using the Epicentre Metagenomic DNA Isolation kit for water (Epicentre Technologies Corp., USA) and libraries were prepared using Nextera XT Sample Preparation Kit (Illumina Inc., USA). MiSeq (2 × 250 bp) sequencing was performed using 500-cycle MiSeq Reagent kits (v. 2) according to manufacturer protocols (Illumina Inc.).
SNV analysis
Phylogenies based on single nucleotide variants (SNVs) were generated using the SNVPhyl pipeline [Reference Petkau25]. Briefly, paired-end reads were mapped to the Toronto-2005 outbreak reference genome (Genbank accession no. CP012019) [Reference Rao26] using SMALT v. 0.7.6. High-quality SNVs were identified using two variant callers: FreeBayes v. 0.9.8 and SAMtools v. 1.1 mpileup (mapping and quality scores ⩾30; SNV fraction ⩾0·75; coverage ⩾15). Repetitive elements (MUMmer v. 3.23), phages (PHAST), and genomic islands (IslandViewer v. 2) [Reference Zhou27–Reference Dhillon29] identified in the Toronto-2005 reference genome were excluded from the phylogenomics analysis. SNV loci present in all isolates were extracted and aligned. Maximum-likelihood phylogenetic trees were constructed using PhyML v. 3.1 [Reference Guindon30] (GTR + G model, best NNIs/SPRs, initial BioNJ tree) using an approximate likelihood ratio test [Reference Anisimova and Gascuel31] and images were rendered in FigTree v. 1.4.1 [32].
Genome analysis
Paired-end reads were assembled de novo using FLASH v. 1.2.9 [Reference Magoc and Salzberg33] (overlap >20, <300) and SPAdes v. 3.50 [Reference Bankevich34] (default parameters for paired-end data; kmers: 21, 33, 55, 77, 99, 127). Each genome comprised 44–71 contigs and average genome coverage values between 42- and 152-fold (Supplementary Table S2). Auto-annotation using Prokka v. 1.10 [Reference Seemann35] predicted 3239–3250 CDSs for each isolate (Supplementary Table S2). Comparative analyses were performed using MAUVE v. 2.4.0 [Reference Darling, Mau and Perna36] and GView Server [Reference Petkau37].
Accession numbers
The data for this study has been deposited at NCBI (http://www.ncbi.nlm.nih.gov/) under BioProject PRJNA291490 (BioSamples: SAMN03944915-SAMN03944919; SRA: SRR3063530-SRR3063534).
RESULTS
Descriptive epidemiology
The first five cases occurred within 48 h and with a background of an average of 2 cases/year being reported in the previous decade within Calgary, it was evident an outbreak was occurring (Fig. 1). In total, eight confirmed cases of LD were identified within a 1 km diameter area of a downtown urban sector of the city, over the time period spanning 23 November to 14 December 2012 (Fig. 1). An additional 24 potential patients admitted during this same time period were investigated but did not meet the case definition; all were Legionella urine antigen negative. The first case was identified on 23 November, with peak incidence occurring 26–27 November (three cases) (Fig. 1, Table 1). The average age of this case cluster was 65 years, with 50% of the patients having severe illness requiring intensive care admission. No mortalities were associated with this cluster (Table 1). Additional PCR screening of all lower respiratory tract specimens from Calgary patients from 1 October to 19 December (n = 189) did not identify further cases. A historical review of legionellosis cases in Calgary (1998–2011), revealed an average of 1·6 LD cases were reported annually with no history travel outside Alberta.
Epidemic curve. Confirmed cases of Legionnaires' disease by date of onset in Calgary, Alberta, Canada (23 November–14 December 2012) (n = 8).

Demographic and laboratory test results from urine antigen-positive patients from Calgary 2012 Legionnaires' disease outbreak
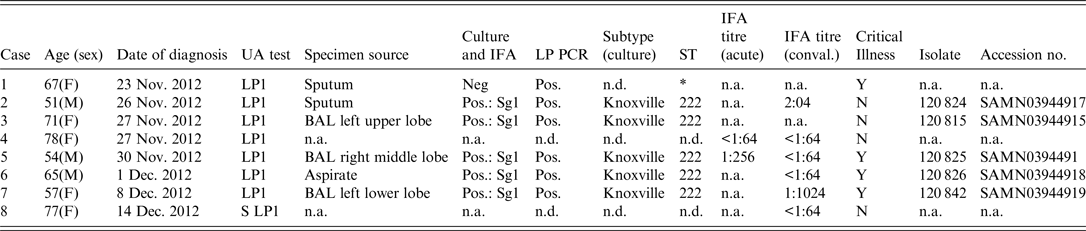
UA, urine antigen; IFA, indirect immunofluorescent assay; ST, Sequence-based typing; n.a., not available; n.d., not done; BAL, bronchoalveolar lavage;
* 6/7 alleles matched ST222 from primary specimen, unable to complete sequencing for one allelle (NeuA);
Environmental sampling
In total, 42 environmental samples were collected and tested from eight residences, two office buildings and one grocery store. One positive result for L. jordanis was obtained from a humidifier located in the household of a case. Pipes and components of the water distribution system within the grocery store were negative for growth of Legionella species. Operational cooling towers located within the affected area and upwind (prevailing westerly winds) within the 2 km radius of the affected area were negative for Legionella growth.
Meteorological conditions
The meterological conditions within the city of Calgary are depicted in Figure 2. The daily temperatures were typical and fluctuated between 7 °C and −20 °C in November and 6 °C and −26 °C in December (Fig. 2a ). The most humid month of 2012 was November with an average daily low humidity of 59%, above the historical average of 45%. The average daily humidity for December was also above average (Fig. 2b ). There was no rain recorded in this period (data not shown), but snow was reported with the largest number of recorded snow days of 2012 in December (Fig. 2c ). The most windy month of 2012 was October with an average wind speed of 5 m/s whereas the least windy month was February, with an average wind speed of 3 m/s. Wind speeds in November and December were consistent with average recorded values (Supplementary Table S1). Typical wind direction was westerly.
Temperature, humidity and snowfall reports for Calgary, Alberta, Canada. (a) The daily low (blue) and high (red) temperature during 2012 with the area between shaded grey and superimposed over the corresponding averages (thick lines) and with percentile bands (inner band, from 25th to 75th percentile; outer band from 10th to 90th percentile). The bar at the top of the graph indicates when both the daily high and low are above (red) or below (blue) average temperatures values. (b) The daily low (brown) and high (blue) relative humidity during 2012 with the area between shaded grey and superimposed over the corresponding averages (thick lines) and with percentile bands (inner band, from 25th to 75th percentile; outer band from 10th to 90th percentile). (c) The daily number of observed hourly snow reports during 2012 with normals indicated (faint shaded areas). The bar at the top of the graph is blue if there was snowfall observed that day and white otherwise.

Case geomapping
Cases were mapped with respect to their residences within the community and their usual walking patterns based on interview data. Of the eight cases, three lived in the northwest quadrant of the city across the river and travelled or worked within the affected western ‘Beltline’ or eastern edge of the ‘Sunalta’ communities (Fig. 3); one additional case lived at the outskirts of the Beltline community. Four individuals lived within the affected community and walked within the area of interest. One individual lived across the river and travelled only by car to appointments within the affected area. All eight cases' residences or walking/travel patterns converged within a common 1 km diameter area bridging between the Beltline and Sunalta communities bordering downtown Calgary (Supplementary Fig. S1). This area included two residences (cases 2 and 6), six businesses (cases 1–6, 8), and one canvassing site (case 7) confirmed to have been visited during the potential exposure period. By visual analysis of intersections and within the 1 km diameter area, from place of residence or work or visiting, a common area of 8 × 11 blocks was identified (Supplementary Fig. S1). In total, there were 17 active construction sites and four fire incidents identified as potential water-spray sites within the area of interest during the potential exposure period.
Map of downtown Calgary illustrating locations visited by Legionnaires' disease patients. The locations visited (residences, businesses, canvassing sites) by all cases in the 2012 Calgary outbreak from November to December 2012 are indicated. Active construction sites and fire incidents are also shown. A 1 km diameter zone encompasses locations visited by all eight cases in the 2012 outbreak. An interactive html map is available (https://share.corefacility.ca/index.php/s/arCfWzeT3fqNWDH).

Microbiological testing and molecular characterization
All eight cases tested positive for LP1 urine antigen. Six were also PCR positive for L. pneumophila from respiratory specimens (Table 1), and 5/8 patients were culture positive from respiratory specimens. Further characterization of the five culture-positive cases identified LP1 with a Knoxville monoclonal subtype and an ST222 sequence subtype. One culture-negative patient was PCR positive for L. pneumophila ST222, and matched to 6/7 alleles from the other five cases confirmed to be ST222 (Table 1).
Serological testing
Serological testing was of limited value with no cases demonstrating a fourfold rise in titre, although one case demonstrated a ⩾fourfold decrease in titres between acute and convalescent sera (Table 1) and one case had a single static titre of >1:1024. No family members of the cases were found to have either a fourfold increase or a single static high titre.
Genomic analysis
The genomic architecture among Calgary 2012 isolates was analysed using Mauve (see Methods section). With the exception of large rearrangements observed in isolates from cases 3 and 7 (isolates 120825 and 120 842, respectively), the Calgary 2012 isolates are highly syntenic (Fig. 4, Supplementary Fig. S2). Synteny and homology in the Calgary 2012 isolates was also revealed by Blast analysis of genomic content (Fig. 5). Within the Calgary 2012 cluster, macro-level variation is limited to repetitive and multi-copy elements (such as 16S/23S ribosomal RNA and repeats in toxin rtxA genes) which are known artifacts of short-read based assemblies.
Blast Atlas of Calgary 2012 outbreak cluster isolates. A Blast Atlas was generated with GView Server using L. pneumophila genomes from the Calgary 2012 outbreak (turquoise) and Ontario (violet). Regions with Blast scores >80% identity and Expect values <e−10 to the reference genome (Calgary- 120 826) are displayed. Upper tracks: Blast analysis of draft genome sequences; lower tracks: Blast analysis of predicted CDSs and genomic elements, GC content, and GC skew. Components of the Dot/Icm system, Dot/Icm effectors, Vir/Tra homologs, Integrases, RtxA, and mobile elements (predicted by Island Viewer, PHAST, and PhiSPY) are indicated.

Genome alignment of L. pneumophila isolates showing genome architecture and synteny. The genome alignment and schematic were obtained using the Mauve software package and the CONTIGuator-generated pseudomolecules of the de novo assembled Calgary 2012 draft genomes. Homologous segments are illustrated as coloured blocks. Isolates 120 825 (case 5) and 120 842 (case 7) show translocated segments (pink and green, respectively) relative to the Toronto-2005 reference genome (CP012019) and to the other Calgary 2012 isolates (120 815, case 3; 120 824, case 2; 120 826, case 6).

To infer the genetic distance for the Calgary 2012 isolates compared to other ST222 strains, a phylogeny based on core SNVs was generated [Reference Petkau25] (Fig. 6). The high quality L. pneumophila strain Toronto-2005 reference genome [Reference Rao26] is representative of a clonal 2005–2006 LD outbreak linked to 135 cases including 23 deaths in Ontario, Canada [Reference Gilmour8, Reference Tijet10]. Analysis of the reference mapping data revealed that a single copy 17 kb subregion (Toronto-2005: 2 694 469–2 711 545) of the 77·6 kb transfer (Tra) element [Reference Rao26] showed allelic duplication in the Calgary-2012 isolates, coinciding with ~16 kb and ~103 kb genomic islands (Calgary- 120 826: 601 143–620 107 and 2 628 230–2 731 168). These regions show homology to several Lvh (Legionella vir homolog) and Tra components of the type IVA secretion system [Reference Segal, Russo and Shuman38] and are flanked by hallmark elements of integrative conjugative elements (ICEs) [Reference Flynn and Swanson39]. For instance, the latter 103 kb genomic island in the Calgary- 120 826 comprises several Lvh/Tra components, integrases, and direct interspersed 45 bp tRNAMet repeats (Fig. 4 and data not shown). The imperfect nature and high SNV density observed in this duplication (data not shown) indicates that at least one of these Lvh-ICE duplications was acquired through a horizontal gene transfer event. Thus, the entire region was excluded from core phylogeny analysis.
Maximum likelihood SNV phylogeny analysis of ST222 L. pneumophila isolates. Maximum likelihood phylogenetic model of L. pneumophila ST222 isolates based on 1688 core SNV loci (Supplementary Table S3) illustrating a close relationship (⩽1 SNV) among Calgary 2012 outbreak isolates (refer to Methods section). The Calgary cluster is distinguished from Ontario strains by ⩾11 core SNVs (Mississauga-2006). Strains associated with sporadic Legionnaires' disease cases are denoted with an asterisk (*). Reference genome: Toronto-2005 (CP012019). The number of SNVs between isolates according the phylogenetic model is indicated and a distance bar is shown. Calgary 2012 isolates: 120 815, case 3; 120 824, case 2; 120 825, case 5; 120 826, case 6; 120 842, case 7.
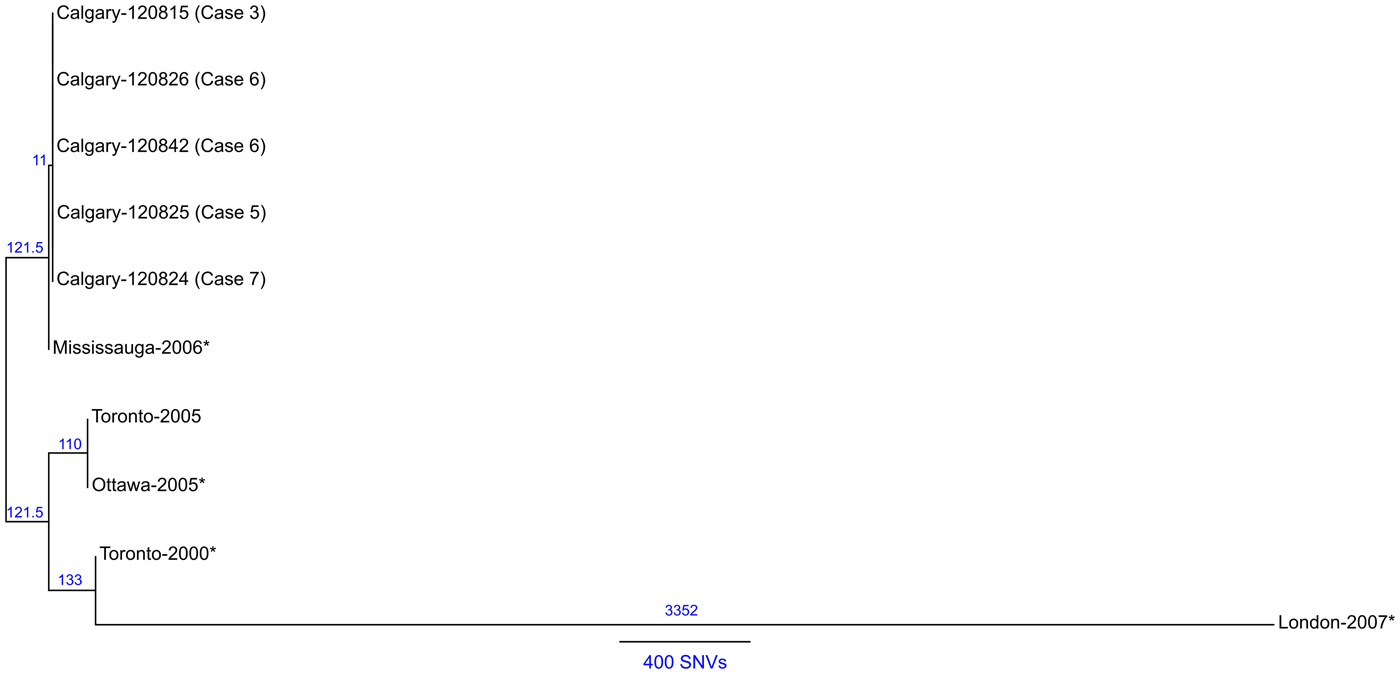
A total of 1688 high-quality SNVs were identified for the ST222 isolates (Supplementary Table S3 and Methods section). Phylogenetic SNV analysis (Fig. 6) shows that the Calgary-2012 cluster isolates form a distinct clade and are distinguished from the Ontario ST222 strains by a minimum of 11 SNVs. SNV variation within the 2012 cluster isolates is limited to ⩽1 SNV due to a single SNV in isolate 120 825 (case 5). Together, these analyses suggest that the Calgary 2012 cluster isolates are highly isogenic.
DISCUSSION
This outbreak occurred in a relatively short time-frame within a 1 km diameter area in a densely populated inner-city area. It is notable that since Legionella was first described in 1976, this is the first recognized LD outbreak in Calgary. There have been confirmed LD cases within the Calgary area previously reported, including persons with no travel history outside of Alberta, although these were sporadic (unlinked). The prevailing winter weather conditions were not considered conducive to Legionella [Reference Ng6, Reference Lévesque7, Reference Ng9, Reference Hicks17]. Case geomapping suggested that an 8 × 11 block area was common to all the cases. Taken together, the temporality, localized geography, and isogenic isolate characterization suggests a common environmental source of exposure. The identification of the Calgary outbreak strains as ST222 is particularly noteworthy: this sequence type was first reported in Ontario in 1999 and has emerged as a frequent cause of LD in that province [Reference Tijet10], most notably as the source of a large Toronto outbreak of disease in 2005 [Reference Gilmour8]. In addition, the occurrence of a confirmed non-travel-associated L. pneumophila ST222 outbreak in Western Canada is the first identified cluster of this emerging sequence type outside of Ontario and the northeastern United States [Reference Tijet10, Reference Kozak-Muiznieks11].
The structure of the duplicated Lvh-ICE region in the Calgary-2012 isolates resembles the LpcGI-2 genomic island in L. pneumophila strain Corby [Reference Lautner40]. Such ICEs can be excised as part of a larger episomal element and inserted into the chromosome by a conservative cut-and-paste mechanism [Reference Lautner40]. The imperfect nature of the Lvh-ICE duplication in Lp2012 does not support this scenario; furthermore, the lack of excessive read coverage depth at these regions in the Calgary-2012 isolates (data not shown) argue against the presence of an episomal Lvh-ICE element. Thus, while at least one of these duplicated regions was acquired via horizontal gene transfer, the mechanism (i.e. recombination due genomic island swapping or integration), requires further investigation.
Our outbreak investigation involved environmental sampling aimed at identifying hypothesized common sources, and targeted venues of common attendance for sampling. We did not identify a common source of LP1 from environmental samples, patient residences, or cooling towers within or upwind of the area of interest, and no evidence of Legionella infection was found in serological specimens from family members. Therefore, we hypothesize that the source of the Legionella strain in this outbreak may have been one or more construction or fire sites located in the area of interest. Activities such as spraying concrete or water for dust control were performed at construction sites in this area and may have created aerosol plumes. While none of the construction sites were sampled for testing, our models suggest that aerosol generating construction activities should be sampled for future suspected outbreaks of LD.
Our results are both unique and novel since they describe the occurrence of LD arising from a probable outdoor exposure and subzero temperatures which has not previously been described with L. pneumophila. The literature supports a seasonality of LD that occurs more frequently during summer and early autumn and in warm, humid environments [Reference Ng6, Reference Lévesque7, Reference Ng9, Reference Hicks17, Reference Farnham41, Reference Biedrzycki42]. A large study reviewing 23 076 cases of legionellosis reported from 1990 to 2005 revealed a marked seasonality in eastern United States, with most cases reported in summer or autumn [Reference Neil and Berkelman43]. A review of legionellosis cases in central Canada also identified summer–autumn seasonality [Reference Ng9]. Outbreaks of community-associated or nursing-home-associated LD in Canada have generally been limited to summer and autumn months [Reference Lévesque7, Reference Gilmour8, Reference Abbas44, Reference Loeb45] and have been associated with cooling towers. To the best of our knowledge, no published Canadian or international data have described a community-associated outbreak of Legionella in a cold-climate setting.
There are plausible explanations as to why this event may have occurred in a community setting with potential outdoor exposure with temperatures between 7 °C and −26 °C. As noted there were numerous active construction sites and small fire events in a localized area and temporality with frequent use of water spraying increasing the likelihood of a common exposure through aerosols. No family members showed evidence of legionellosis which argues against multiple occurrences occurring by chance alone. An interesting observation is that the relative humidity during the time of the exposures was well above the usual average which may have favoured an exposure-transmission event. Evidence has suggested a strong association with higher humidity/precipitation with a significant dose-response relationship for occurrence of cases with each of the parameters [Reference Fisman14]. In a study of 240 legionellosis cases, despite a marked summertime seasonality, a case-crossover analysis identified a significant association with precipitation [odds ratio (OR) 2·48, 95% confidence interval (CI) 1·30–3·12] and increased humidity (OR per 1% increase in relative humidity: 1·08, 95% CI 1·05–1·11) 6–10 days before occurrence of cases [Reference Fisman14]. In addition, although Legionella has been reported to grow optimally between 25 °C and 45 °C, there is evidence the bacterium is capable of sustaining growth in lower temperatures [Reference Arvand, Jungkind and Hack46]. Nosocomial transmission from a cold water supply and ice machines have been reported [Reference Arvand, Jungkind and Hack46], which supports cold chain transmission potential for Legionella.
We recognize the limitations to our study, including issues of recall bias in interviewed patients, potential for unidentified cases, the limited number of sampling sites and the absence of a confirmed environmental source. We attempted to reduce recall bias by re-interviewing patients post-recovery, as well as spouses/partners, and we looked at all lower respiratory tract specimens from patients from 1 October to 19 December 2012 in the Calgary area that were submitted for influenza testing to increase the case-finding. It is possible that with more sampling sites an environmental source may have been determined, but because of subzero temperatures cooling towers were not operational. From a genomics perspective, while we have included all available ST222 genomic data in our analyses, including additional ST222 strains may have provided additional diversity and insight. Furthermore, the Legionella population structure in the Calgary area is not known; thus, whether this strain was introduced or endogenous to the region of the outbreak remains an open question. Despite these limitations, the identification of nearly identical isolates of LP1 caused by a strain never reported previously in Calgary or even in western Canada, is a significant finding in our study and suggests that this was a common-source outbreak within a very limited geographical area coincident with very heavy construction activities. This outbreak has provided several important lessons and we would suggest to expand the interview process to additional family members, add questions regarding open water sources in construction areas, include more environmental sampling sites and conduct sampling at an earlier stage of the investigation.
In conclusion we present a L. pneumophila Knoxville ST222 outbreak with no associated mortality, but a high proportion of critical illness that mainly affected an elderly population in a setting where LD is considered very rare in terms of local acquisition. These results suggest that L. pneumophila may also be transmitted in a community setting in cold climatic conditions and should not be overlooked as a possibility during late autumn and winter months in the Northern Hemisphere.
APPENDIX. Legionella Outbreak Investigative Team (listed alphabetically)
K. A. Bernard1,2, C. Berry1, J. Carson3,4,5, B. Friesen3,6,7, M. W. Gilmour1,2, M. R. Graham1,2, K. Houde3, J. MacDonald3,6,7, A. L. Pacheco1, N. Punja3, A. R. Reimer1, K. Simmonds7,8, R. Tellier3,9,10, G. Van Domselaar1,2, R. Zaheer1, A. Zetner1
1 National Microbiology Laboratory, Public Health Agency of Canada, Winnipeg, Manitoba, Canada; 2 Department of Medical Microbiology, University of Manitoba, Winnipeg, Manitoba, Canada; 3 Alberta Health Services, Calgary, Alberta, Canada; 4 Department of Pathology and Laboratory Medicine, Cumming School of Medicine, Calgary, Alberta, Canada; 5 Calgary Laboratory Services, Calgary, Alberta, Canada; 6 O’Brien Institute for Public Health, Cumming School of Medicine, University of Calgary, Calgary, Alberta, Canada; 7 Department of Community Health Sciences, Cumming School of Medicine, Calgary, Alberta, Canada; 8 Alberta Health, Edmonton, Alberta, Canada; 9 Calvin, Phoebe and Joan Snyder Institute for Chronic Diseases, University of Calgary, Calgary, Alberta, Canada; 10 Department of Microbiology, Immunology and Infectious Diseases, Cumming School of Medicine, Calgary, Alberta, Canada
SUPPLEMENTARY MATERIAL
For supplementary material accompanying this paper visit http://dx.doi.org/10.1017/S0950268816001965.
ACKNOWLEDGEMENTS
We thank Bryanne Crago, Christine Ferrato, Kanti Pabbaraju, Dr Graham Tipples, Dr Greg Tyrell, and Sallene Wong, at the Alberta Provincial Laboratory for Public Health for assistance with the transport and initial typing of the isolates; the Alberta Health Services Environmental Public Health Team; Allan Torg for environmental sampling assistance; Matthew Walker at the Public Health Agency of Canada for WGS technical assistance.
This work was supported by in-kind contributions from the Public Health Agency of Canada – National Microbiology Laboratory, ProvLab Alberta, and Calgary Laboratory Services.
DECLARATION OF INTEREST
None.


 Open access

