Section 1. Forecast overview and policy recommendations
The short-term outlook for the UK economy is very murky indeed, with a significant risk that a severe economic downturn will begin within the next six months. With economic growth already faltering, a disorderly no-deal Brexit could cause widespread disruption to trade, a sharply lower exchange rate, higher inflation and lower living standards.
A disorderly no-deal Brexit is not the most likely outcome, but it is a definite possibility among the large number of possible paths the United Kingdom could take in the months ahead.
One of the few certainties is that things are about to change, although this is unlikely to lead to any clarity around the UK's long-term relationship with the EU. When the new Prime Minister takes over from Mrs May on 24 July, there will be only three months before the United Kingdom is due to leave the European Union on 31 October. The new Prime Minister will appoint new ministers, including a new team to negotiate Brexit. There will also be changes to the EU negotiating team as the leadership of the EU Commission and Council changes hands. Given the lack of time to renegotiate the existing EU withdrawal agreement that has been rejected by the UK Parliament, and the perceived political imperative not to further delay EU exit, there is a significant risk that the UK will leave the EU on 31 October without a deal.
The continuing uncertainty about Brexit is affecting many aspects of economic life. For example, as figure 1 shows, the value of sterling appears to be tracking the probability of a no-deal Brexit implied by betting markets: each 5 percentage-point rise in the no-deal probability is associated with a 1p rise in the sterling price of dollars, implying by linear extrapolation that a no-deal Brexit would be associated with a depreciation of sterling to around $1.10. The forthcoming change in political leadership means that there is also a lack of clarity about government policy in many areas, including taxation, especially as it is possible that there will be a general election in the months ahead to break the parliamentary impasse, and that could lead to a change in government.
No-deal probability and exchange rate

Alongside domestic uncertainty, the global economy is also in a delicate state. As outlined in the World Economy chapter of this Review, we are expecting global GDP growth to be weaker in 2019 and 2020 than in recent years. We think that a more sustained downturn will be prevented by a vigorous policy response.
Against this background of chronic uncertainty, the UK economy appears not to have any significant momentum in the run-up to the new Brexit date. As discussed at the most recent NIESR Business Conditions Forum,Footnote 1 uncertainty has hindered decision making and led to investment projects being deferred. This lack of dynamism has affected productivity growth and brought underlying economic growth to a standstill.
There is a significant risk that the economy is already in a technical recession. After growing by 0.5 per cent in the first quarter as businesses built up inventories ahead of a feared no-deal Brexit at the end of March, GDP fell in April, before recovering a little in May. With surveys suggesting that output was flat in June, our latest GDP Tracker estimates that the economy contracted by 0.1 per cent in the second quarter, partly due to shutdowns in car manufacturing and persistent weakness in services. As figure 2 illustrates, services output, which accounts for about 80 per cent of GDP, is not growing at a sufficient pace to offset the effects of falling production and construction output. Our GDP Tracker suggests that a technical recession will be narrowly avoided with output expected to expand by 0.2 per cent in the third quarter. Nevertheless, with little positive momentum in the economy, output may contract again in the third quarter, and there is around a one-in-four chance of two consecutive quarters of negative growth, the technical definition of recession.
Contributions to quarterly growth

While the economy has been held back by the effect of Brexit-related uncertainty on business investment and productivity growth, there has not been any obvious deficiency of aggregate demand. Stimulatory monetary policy has supported consumers' expenditure and housing investment, and 12-month CPI inflation was exactly 2 per cent in June, suggesting that aggregate supply and demand are broadly in balance. The public sector financial deficit is also smaller than for a number of years. Borrowing in the latest full financial year (April 2018 to March 2019) was £24.0 billion (1.1 per cent of GDP), £17.8 billion less than in the same period in the previous year; the lowest financial year borrowing for 17 years, though borrowing was a little higher than the Office for Budget Responsibility (OBR) had forecast in its March 2019 Economic and Fiscal Outlook. Despite higher levels of saving in the public sector, low levels of national saving are reflected in a significant current account deficit. The UK current account deficit widened by £6.3 billion to £30.0 billion in the first quarter, or 5.6 per cent of GDP; the fifth-highest quarterly deficit on record as a percentage of GDP.
The prospects beyond the third quarter are very uncertain and depend on the form of Brexit that emerges, if any, and the policy response to it. The three broad options are that the Article 50 period is extended again, the UK leaves the EU with a deal, or it leaves without a deal. Our assessment is that any of these three options has a reasonable chance of emerging in the coming months, though some well-informed commentators think that a no-deal Brexit is more likely than not. This means that there are significant risks ahead, especially as some of the possible policy responses to a no-deal Brexit that have been suggested, such as tax cuts for the higher paid, will do little to address the low national saving rate or other structural weaknesses that are also detrimental to the long-term prosperity of the United Kingdom.
Brexit assumptions and alternative scenarios
by Arno Hantzsche
Brexit forms the single most important risk to the UK economic outlook and assumptions about the type of exit, the timing and eventual policy responses determine our projections to a large extent. Instead of averaging across a range of different scenarios, we continue to describe a coherent main case consistent ultimately with a ‘soft’ form of Brexit and contrast it with a ‘harder’ exit scenario, while discussing risks around each case. This box explains the assumptions that underlie both scenarios.
Main-case forecast scenario
In this scenario, elevated levels of political and economic uncertainty persist for some time as Brexit negotiations continue. Little changes regarding the trading relationship between the UK and EU in the short term as the UK retains nearly frictionless access to the European single market and customs union. This scenario is consistent with the UK leaving the EU on 31 October along the lines of the negotiated withdrawal agreement, followed by a transition period of around two years during which the future trading relationship is being negotiated. A further Brexit extension, some form of standstill agreement, or a revocation of Article 50 are also consistent with the main-case scenario. This scenario is also in line with forecasts previously published by NIESR once the rise in uncertainty is taken into account.
In the main-case forecast scenario, higher uncertainty is reflected in lower investment, consumption and productivity and a negative residual is also applied to the export equation. We assume that stocks built up prior to the initial exit date at the end of March are gradually being depleted, acting as a drag on economic activity in the quarters ahead. The UK would meet its obligations under the financial settlement and continue to make contributions to EU programmes such that net fiscal transfers would not be much different from today.
Figure A1 shows that the growth path of GDP is dampened for 2–3 years as a result of elevated uncertainty before the economy reverts back to its long-run growth trend if frictions to UK-EU trade remain limited. While consistent with the main case in the short run, a customs union deal between the UK and EU would lead to a 3 per cent reduction in economic output relative to the soft Brexit case (not shown, see Reference Hantzsche and YoungHantzsche and Young, 2019) and if a free-trade agreement were to be struck this would make the economy some 4 per cent smaller (not shown, see Reference Hantzsche, Kara and YoungHantzsche, Kara and Young, 2018).
The impact of different Brexit scenarios on real GDP

Alternative case: orderly no-deal Brexit
In this scenario, the UK exits the EU on 31 October without a deal, i.e. the negotiated withdrawal agreement is not ratified, there is no transition period and the political declaration on the future trading relationship will not apply. The UK reverts to trade on WTO terms, regulatory barriers are erected and customs duties collected at the border.
In the long run, we assume in line with empirical evidence that UK-EU trade is 50–60 per cent lower compared to continued EU single market and customs union membership; foreign direct investment would be lower by one quarter; net migration would be reduced by 100,000 persons a year; labour productivity would be lower by 1.6 per cent; and the UK would no longer contribute to the EU budget once outstanding liabilities are repaid (for details see Reference Hantzsche, Kara and YoungHantzsche et al., 2018).
Over the medium-run forecast horizon, the economic outlook would depend on the level of preparedness of firms, households and the government, on how quickly barriers to tariff and non-tariff barriers to trade were erected, and on macroeconomic stabilisation policies.
Contingency measures. We assume that the exit is orderly in the sense that short-term contingency measures are put in place and financial stability is safeguarded. The Bank of England is convinced that the UK banking system would withstand the range of economic and financial shocks associated with a no-deal exit (Bank of England, 2019). It is likely that no-deal preparations would be stepped up once a new Prime Minister is in office and in a review of no-deal preparations the European Commission in June concluded that “there is no need to amend any measures on substance and that they remain fit for purpose” (European Commission, 2019).
Table A1 highlights a number of contingency measures adopted or planned by the British government and the European Commission. Importantly, most of these measures would only be effective if reciprocated by both sides. The EU has made it clear that several measures, for instance regarding financial services, are explicitly temporary and serve the purpose of allowing EU importers time to switch to non-UK suppliers. There is also a risk that firms and households have become complacent after two Brexit deadlines had run out without effect in the first half of this year. Warehouse space already limits further stockbuilding activity and will do so in particular prior to Black Friday and Christmas sales. Some cash-strapped companies may not be able to step up no-deal preparations.

Putting procedures, infrastructure and staff in place to facilitate visa applications and customs checks will help mitigate temporary disruptions and queues but does not change the fact that freedom of movement would end, a number of services may no longer be licensed to trade, and the cross-border costs of goods trade would increase. For instance, food imports would have to undergo veterinary and safety checks, border delays may interrupt tightly tuned value chains in the production sector and uncertainty about the immigration regime may lead to increased staff shortages, in particular in the health and social care sectors (Reference Dolton, Nguyen, Castellanos and RolfeDolton, Nguyen, Castellanos and Rolfe, 2018).
We account for short-term disruptions in our scenario by assuming an initial 1 per cent drop in productivity, higher investment premia, lower equity prices (equity premium) and higher borrowing costs (term premium) relative to the main-case scenario. A quarter of the long-run impact on trade occurs immediately upon exit in this scenario, gradually increasing over time as border checks are enforced and regulatory barriers become binding.
Macroeconomic stabilisation policies. Higher trade barriers, higher uncertainty and lower productivity in our analysis lead to an immediate fall in economic output and disposable income. To smooth the economic adjustment, a mix of macroeconomic stabilisation policies is likely to be activated. While targeted fiscal policy measures may be able to redistribute income to sectors and individuals most affected by a no-deal exit, Box C discusses that the macroeconomic effect of tax and spending measures aimed at stabilising aggregate demand is small, as these measures tend to be crowded out by exchange rate adjustments in open economies like the United Kingdom. Monetary policy would be more effective but faces the trade-off between fighting higher inflation, as a result of higher import prices and a sharp exchange rate depreciation, and stabilising the level of output.
Figure A1 shows the path of GDP under no deal for two different monetary policy responses. In the first variant, monetary policy responds mechanically to higher inflation and lower output. Given the dominance of supply side shocks associated with a no-deal Brexit in our analysis, interest rates rise sharply in this variant and to 3 per cent by 2020. The recent past shows that this is not a very realistic assumption as the Bank of England has tended to look through temporary episodes of elevated inflation. In the second variant (which in this chapter serves as the main no-deal variant), we assume that Bank Rate is instead cut by 50 basis points immediately after exit to smooth the response of output. Within two years of exit, Bank Rate then rises more steeply compared to the main-case forecast to alleviate rising inflationary pressures.
Figure A1 shows that with this type of response the economy is able to avoid a deep downturn, holding all else equal (table 1 in the chapter summarises the response of other variables over the forecast horizon). However, this response is only available if inflation expectations remain well anchored and the inflationary uptick temporary (see also Reference Hantzsche and KaraHantzsche and Kara, 2019). Figure A1 also makes clear that demand-side policies can spread the cost of adjustment over time but, in the long run, differences in the level of GDP across Brexit scenarios depend on the supply of capital, labour and how efficiently these production factors are combined (see also the Commentary in this Review). We estimate that GDP would be 5–6 per cent lower in the long run under a no-deal scenario compared to the main-case scenario.

In the rest of this chapter we describe our assessment of the economic prospects for the United Kingdom in three main ways.
First, we provide a narrative around a main-case scenario based on a continuation of chronic uncertainty while the UK's trading relationship with the EU remains unchanged in the short term pending the negotiation of the future relationship.
Second, we also describe an orderly no-deal Brexit scenario, characterised by an abrupt shift in the UK's trading relationship with the EU and continuing uncertainty.
Third, we summarise the various risks in fan charts for GDP growth and CPI inflation. These include both forecast scenarios and the risks around them. Given the wide range of possible paths that the United Kingdom might take over the next few months, we put most emphasis on the fan charts as a way of describing where the UK economy might be heading.
Main-case forecast scenario
Our main-case forecast scenario assumes a prolonged period of uncertainty while the UK and EU work out their future relationship. This main case is consistent in the short term with the UK leaving the EU on 31 October 2019 along the lines of the negotiated withdrawal agreement, followed by a transition period that forms a bridge to the to-be-negotiated future relationship. Other possibilities, such as a further extension to the Article 50 period or, less likely, a standstill arrangement agreed with the EU under Article XXIV of the General Agreement on Tariffs and Trade, that involve little change to trading arrangements in the short term, are also consistent with our main-case scenario.
In our main-case forecast scenario, economic conditions are set to continue roughly as they are, with high levels of capacity utilisation but slow growth as businesses refrain from investment in view of high uncertainty about future trading relations. In this scenario, GDP grows by around 1 per cent in both 2019 and 2020. It is then expected to pick up to close to 2 per cent as the global economy recovers, uncertainty fades and domestic demand picks up, led by government consumption and investment.
The labour market appears to be tight with unemployment falling to 3.8 per cent of the labour force in the first half of 2019. Wages are now growing at an annual rate of around 3½ per cent. With little productivity growth this means that unit labour costs are growing at an annual rate of above 2 per cent, contributing to domestically-generated inflationary pressure. While sterling has depreciated by 4 per cent over the past three months, sterling import prices are expected to remain relatively subdued in view of low global inflation.
Risks
As has been emphasised, there is significant uncertainty around the economic outlook reflecting the different paths to the future relationship with the EU that may be taken. Our broad assessment is that there is around a 60 per cent chance that the outlook can be described by our main-case scenario where the UK's trading relationship with the EU is unchanged, and a 40 per chance of no deal. There are then a range of upside and downside risks around these two scenarios. The outlook under an ‘orderly’ no-deal Brexit is set out in Box A. In such a scenario, we would expect GDP growth to fall to zero per cent in 2020, provided inflation expectations remain anchored allowing monetary policy to be accommodative and see through a short-term rise in inflation as a result of higher trade costs and a weaker exchange rate (see also low panel of table 1). Our assessment of the various risks to GDP growth and inflation is summarised in the fan-charts shown in figures 3 and 4. The fan charts include the risks of a disorderly Brexit.
GDP growth fan chart (per cent per annum)

Inflation fan chart (per cent per annum)

We see the risks to growth to be heavily weighted to the downside in view of the high probability of a no-deal Brexit and the risk that this could be disorderly. Given the slow underlying growth rate of the UK economy, the fragility of the global economy, and the significant risk of an abrupt downward shift at the end of this year, we judge that there is around a 30 per cent chance of output growth of less than zero per cent in 2020. The risks to inflation lie to the upside, symmetrically opposite to the risks to growth.
These forecast distributions are considerably more pessimistic over the next year or more than those published by the Warwick Business School Forecasting System (WBSFS), which combines state-of-the-art statistical models weighted solely by the forecasting performance of each model (Box B). This difference comes about because we have applied judgement to take account of the possible effects of different Brexit outcomes in compiling our forecasts, whereas the WBSFS forecasts are judgement free and make no explicit allowance for the risks arising from Brexit. As such, they provide a clear indication of the chances of different growth and inflation outcomes in the absence of Brexit. On the WBSFS forecasts, there is a 20 per cent chance that four-quarter GDP growth for the final quarter of 2019 will be less than 1 per cent. Our own estimate is that the chance of this outcome is closer to 50 per cent, reflecting observed weakness in the middle of the year and the possibility of a damaging no-deal Brexit outcome. For the final quarter of 2020, the WBSFS points to an 8 per cent chance that four-quarter GDP growth will be negative, whereas we would put that probability at close to 30 per cent. On inflation, the WBSFS model points to only a 15 per cent chance that CPI inflation will exceed 3 per cent for the final quarter of 2020, whereas we would put the chance of above 3 per cent inflation at the end of 2020 at around 40 per cent.
Monetary and fiscal policy recommendations
Our monetary and fiscal policy recommendations are based on our assessment of the risks to the economy set out in the fan charts shown in figures 3 and 4. In more normal conditions, our main-case scenario would suggest that monetary policy be tightened at a faster pace than currently priced into the yield curve. With the economy at around full employment, we would also be recommending that taxes be raised, both to promote a higher rate of national saving and to finance the provision of sufficient public services as the population ages.
In particular, we would recommend that alongside the Spending Review scheduled for later this year, the government should also announce a Comprehensive Tax Review, aimed at replacing the existing piecemeal and arbitrary approach to taxation with a more principled approach. Just as the Spending Review is intended to allocate spending across the public sector in an efficient manner, so the Comprehensive Tax Review would try to ensure that taxes are raised in a fair and efficient manner. Despite the principles of good taxation and a range of recommendations being clearly set out in the Mirrlees Review in 2011, no evident progress has been made in this area (Mirrlees et al, 2011). A Comprehensive Tax Review along these lines would probably recommend substantial changes such as a progressive income tax with a transparent and coherent rate structure, a largely uniform VAT, no transactions taxes such as stamp duty, a consistent carbon tax, a lifetime wealth transfer tax, and a land value tax for business and agricultural land.
But with the United Kingdom about to leave the European Union, possibly without a deal, monetary and fiscal policy need to be ready to respond vigorously to significantly different economic circumstances. In the accompanying Commentary NIESR Director, Jagjit Chadha, discusses in general terms the monetary and fiscal options in the event of a ‘no-deal Brexit’. As he points out, leaving the European Union is likely to mean that the supply capacity of the United Kingdom is lower in the long run than it would otherwise have been. There is not much that fiscal and monetary policy tools can do about that. Indeed, by lowering the tax base, there would be less scope in a no-deal scenario for the government to address many of the challenges that the country is already facing, such as how to respond to the needs of an ageing population.
Forecasting with a benchmark: the Warwick Business School forecasting system
by Ana Galvão, Anthony Garratt and James Mitchell
We provide benchmark forecasts to help understand and contextualise the forecasts presented in this Review. The box presents density forecasts for UK GDP annual growth and inflation, and reports the probabilities of a range of output and inflation events occurring, as calculated using the Warwick Business School Forecasting System (WBSFS).Footnote 1
To reflect the uncertainties inherent in economic forecasting, and following the practice of NIESR and other forecasters such as the Bank of England and OBR, the WBSFS provides probabilistic forecasts. The WBSFS forecasts are produced by explicitly combining density forecasts from a set of twenty four, statistically motivated, univariate and multivariate econometric models commonly used in the academic literature. The use of combination forecasts or model averaging reflects the view, supported by research (e.g., see Reference Bates and GrangerBates and Granger, 1969; Reference WallisWallis, 2011; Reference Geweke and AmisanoGeweke and Amisano, 2012; Reference Rossi, Elliott and TimmermannRossi, 2013), that because any single model may be mis-specified there may be gains from the use of combination forecasts.
Comparison of the Institute's forecasts with the probabilistic forecasts from the WBSFS may be interpreted as providing an approximate indicator of the importance of expert judgement, which may include views on the underlying structure of the macroeconomy. This is because the WBSFS forecasts are computed by exploiting regularities in past data with the aid of automated time-series models; they do not take an explicit, structural or theoretical view about how the macroeconomy works; and they do not rely on (subjective) expert judgement to the same degree as those presented by the Institute. The forecasts from the WBSFS are not altered once produced; they are deemed ‘simply’ to represent the data's view of what will happen to the macroeconomy in the future.
Figure B1 presents WBSFS's latest (as of 5 July 2019) probabilistic forecasts for real GDP growth and inflation – defined as year-on-year growth rates for 2019Q4 and 2020Q4 – as histograms. The information set used to produce these forecasts includes information on GDP growth up to 2019Q1 and data on CPI inflation up to May 2019.
WBSFS forecast probabilities for real GDP growth and inflation, year-on-year

Table B1 extracts from these histogram forecasts the probabilities of specific output growth and inflation events. The events considered are the probability of output growth being less than 0 per cent, 1 per cent and 2 per cent, and of inflation lying outside the 1–3 per cent target range (i.e., the probability of the Bank of England's Governor having to write a letter explaining how and why inflation has breached its target range). Also reported are the individual probabilities of inflation being less than 1 per cent and greater than 3 per cent, to indicate which side of the target range is most likely to be breached.

Examination in table 1 of the output growth forecasts for 2019Q4 suggests that, compared with our forecasts made one quarter ago, the risk of ‘low’ growth (growth less than 1 per cent) in 2019Q4 is forecast to be lower: the predictive probability of this event has decreased from 30 per cent to 20 per cent. However, the most likely outcome in 2019Q4 remains growth between 1 per cent and 2 per cent, with a forecasted probability of 40 per cent, up from 35 per cent last quarter. In turn, the chance that growth exceeds 2 per cent has increased from 35 per cent one quarter ago to 40 per cent.
Looking further ahead to 2020Q4 we forecast a higher chance that growth exceeds 2 per cent: the probability forecast rises from 40 per cent this year to 47 per cent next year, more or less unchanged from the probability we gave to this event one quarter ago.
The probability of inflation falling outside the 1–3 per cent range has changed little between April and July. It has decreased, but only by 2 per cent points, from 34 per cent to 32 per cent. This change is attributable to a notable leftward shift in the inflation density for 2019Q4. The probability of inflation exceeding 3 per cent is now forecast to be 4 per cent rather than the 19 per cent forecast one quarter ago; and the probability of inflation being less than 1 per cent has increased from 15 per cent last quarter to the current 28 per cent. This represents a continuation of the downward movements observed in our inflation forecasts last year. Looking further ahead to 2020Q4, although the forecast uncertainties are unsurprisingly higher as evidenced by a wider range of forecast outcomes than for 2019Q4, we also forecast a similar pattern. Relative to our forecasts made one quarter ago, this downward trend in inflation is forecast to continue through to 2020Q4 with the probability of inflation exceeding 3 per cent falling from 22 per cent one quarter ago to 15 per cent.
Notes
1 WBSFS forecasts for UK output growth and inflation have been released every quarter since November 2014. Details of the releases are available at https://www2.warwick.ac.uk/fac/soc/wbs/subjects/emf/forecasting/ and a description of the models in the system and of the indicators employed is available at https://www2.warwick.ac.uk/fac/soc/wbs/subjects/emf/forecasting/summary_of_wbs_forecastng_system.pdf.
Nevertheless, there is considerable scope for monetary and fiscal policy to be used to smooth the response of the economy to the United Kingdom's new trading arrangements. Our key recommendation in these circumstances is that monetary policy be used to the maximum possible extent to offset undesirable shifts in aggregate demand and that fiscal policy be used to support monetary policy as well as responding to specific shifts in supply conditions.
The Monetary Policy Committee appears ready to adjust monetary policy appropriately in the event of a no-deal Brexit. It has provided guidance on how it will adjust the future path of Bank Rate in response to different Brexit outcomes. In particular, the MPC will assess the balance of the effects on demand, supply and the exchange rate and set policy rates accordingly. As MPC members have clarified, this could mean that interest rates be cut even if there was a no-deal Brexit that resulted in additional inflationary pressure provided long-run inflation expectations remained anchored to the inflation target. This could occur if aggregate demand weakened even more sharply than aggregate supply and that output fell as inflation rose. In these circumstances the MPC would allow inflation to rise above target to balance the trade-off between the speed at which inflation is returned to target and the support that monetary policy provides to jobs and activity (Reference CarneyCarney, 2018).
Figure 5 provides a guide to the possible range of outcomes for Bank Rate, consistent with MPC guidance. Bank Rate rises in our main-case forecast scenario, but there is a reasonable chance that the next move in Bank Rate is a cut towards the effective lower bound. In August 2016, the MPC said that the effective lower bound for Bank Rate was then judged to be “close to, but a little above, zero”. We judge that there is a possibility of Bank Rate reaching a low point of 0.1 per cent in the immediate aftermath of a no-deal Brexit, though we would not expect it to remain long at that rate given the extent of the depreciation of sterling and upward pressure on inflation that would be likely in that situation.Footnote 2
Bank rate fan chart (per cent)

In normal conditions, monetary policy has sufficient flexibility to manage the demand-side implications of a macroeconomic shock. But with Bank Rate close to its effective lower bound and doubts about the effectiveness of other monetary policy measures, such as asset purchases and forward guidance, fiscal policy may also need to play an active supporting role.
In his Mansion House speech, Phillip Hammond, Chancellor of the Exchequer in the May government, asserted that “the fiscal headroom I have built up means an incoming Prime Minister will have scope for additional spending or tax cuts”, but that this headroom would be soaked up by a “damaging no-Deal Brexit”.
There are arguments against both parts of this statement. In the first place, it is premature to say that the government has met its fiscal objectives. It is by no means clear that there is any fiscal headroom that allows additional spending or tax cuts. The fiscal headroom that the Chancellor has identified only exists relative to an arbitrary target that the government has set itself. It refers to a forecast last updated in spring, when economic conditions looked more robust, that the government is currently on track to borrow less than its borrowing target – its ‘fiscal mandate’ – which requires structural borrowing to be below 2 per cent of GDP in 2020/21. But the government's overall aim is to return the public finances to balance by around 2025, and the chances of that appear relatively low, especially as a new accounting treatment of student loans in public finance statistics will increase public sector net borrowing headline figures by another 0.5 per cent of GDP. Nevertheless, it is by no means clear that these long-term borrowing targets are appropriate when public sector debt is around 80 per cent of GDP and the economy's saving rate is so low. While it is important to have a clear set of fiscal rules, a case could easily be made for more stringent borrowing targets that would leave even less fiscal headroom.
In the second place, this statement understates the flexibility of fiscal policy. Even if there were currently no headroom against the government's fiscal objectives, and even if a no-deal Brexit were to reduce tax revenue causing borrowing to rise, there is nevertheless ample scope for further government borrowing to help stabilise the economy in response to a change in circumstances, especially when long-term borrowing costs are low relative to the potential growth rate of the economy. Borrowing is a means of smoothing shocks and it would make more sense to allow borrowing to rise in the event of a no-deal Brexit than to risk exacerbating any downturn by cutting spending or raising taxes when the economy is already weakening.
This suggests, contrary to Phillip Hammond's view, that there is scope to allow well-targeted fiscal measures to help the economy adjust to a no-deal Brexit. But a concern is that, in practice, fiscal measures may not be directed to the areas where they are most needed. We discuss the macroeconomic economic effects of some fiscal giveaways in Box C. We illustrate the effects of fiscal measures suggested by Conservative and Labour politicians that would raise the government's budget deficit by 1–2 per cent of GDP. We look at tax cuts, as proposed in the Conservative Party leadership contest, and government spending and investment proposals put forward by the Labour Party, financed partly by higher tax rates. We find that the macroeconomic effect of such measures is small if they do not also improve the supply potential of the economy. This is because fiscal expansions aimed at increasing aggregate demand rather than supply tend to be crowded out by exchange rate adjustments in open economies like the United Kingdom. The exception is when interest rates are at their lower bound when additional fiscal measures can provide effective demand stimulus. This suggests that monetary and fiscal policies will need to be coordinated in the event of a no-deal Brexit if they are to be used effectively.
Given the small macroeconomic effects of fiscal measures, we recommend that any fiscal measures be directed at smoothing the adjustment of the economy towards its new long-run trading relationship with the EU. In the short run, contingency measures will need to be enacted to avoid major disruptions at the border and support industries currently reliant on EU funding, for example agriculture. Further out, a no-deal Brexit is likely to lead to a structural transformation of the UK economy, with some sectors losing international competitiveness and others gaining market shares. Examples of additional public spending that might help the transition include grants to regions that are most adversely affected by a no-deal Brexit, and additional spending on training and active labour market programmes aimed at keeping people in work. Government policy will also need to address some of the underlying reasons of the Brexit vote, like reductions in local government and welfare spending that activated existing economic grievances (Reference FetzerFetzer, 2019). More generally, fiscal policy adjustments should be made where they are most effective and consistent with addressing the long-run needs of the country. Based on our own assessment of government expenditure needs (Reference Hantzsche and YoungHantzsche and Young, 2018), we have been arguing for some time that spending will have to rise to accommodate demographic pressures and maintain the quality of public services. This will almost certainly require tax increases over time and it would be preferable if decisions about short-term fiscal measures were taken within a framework that recognises these long-run challenges.
The macroeconomics of fiscal give-aways
by Arno Hantzsche
In this box, we evaluate the macroeconomic effects of expansionary fiscal policy measures on the UK economy. We consider two fiscal packages, one based on Labour Party policy and one based on some of the policies put forward during the Conservative Party leadership campaign. We show that while these policies would have little effect on the level of economic output, they might nevertheless change the composition of output and the distribution of income in the directions desired by those that proposed them.
After more than ten years of fiscal restraint, a loosening of the public purse now appears almost inevitable. There are clear pressures for higher spending. Based on our own assessment of government expenditure needs (Reference Hantzsche and YoungHantzsche and Young, 2018), we have been arguing for some time that spending will have to rise to accommodate demographic pressures and maintain the quality of public services. Recent proposals confirm our judgement. And with borrowing costs low, the argument that there is space for spending more/taxing less has also been strengthened recently (Reference BlanchardBlanchard, 2019).
Using simulations on NIESR's global econometric model NiGEM, we find that expansionary fiscal measures akin to those proposed at both ends of the political spectrum would add to public borrowing. However, the impact on economic growth is estimated to be small, in line with conventional wisdom that fiscal expansions are crowded out by monetary policy and exchange rate adjustments in open economies, especially when output is at or close to potential.
Scenario A: Labour Party proposals: Higher public sector pay, higher spending, higher taxes
This scenario is based on the Labour Party document, Funding Britain's Future (Labour Party, 2018) which sets out additional current spending measures (worth £48.6 billion in 2021–22) and a matching set of tax raising measures. Labour also intends to boost public investment by £250 billion over ten years through a National Transformation Fund (ibid.) which it would finance by additional borrowing. The modelling assumptions made to implement this scenario are set out in table C1. In particular, we model an increase in public sector wages such that the currently persisting gap of around 3.5 per cent between prevailing public sector wage levels and their long-run trend is eliminated within four years. This is reflected in whole-economy wages being 0.6 per cent higher than they would otherwise have been and a public sector paybill that is £7 billion per year higher by 2023–4. We further account for additional real government consumption of £44.6 billion per year by 2021–2 which Labour would mainly target at education, health and social care, and work and pensions (ibid.). We also include additional annual capital expenditure of £25 billion per year. The party plans to finance these spending promises through higher income and corporate taxes and a range of levies and anti-avoidance measures. We have increased effective income tax rates in NiGEM, which apply to the single representative household considered by the model, so as to raise £6 billion in additional tax revenue by 2021–2. Given that the aim is to target predominantly high-income households, whose consumption behaviour tends to be less elastic, we also apply a positive shock to consumption that dampens half the impact of higher taxes. We have also imposed an increase in effective corporate tax rates such that an additional £19 billion is raised by 2021–2 (ibid.). We do not account for the effects of the levies and anti-avoidance measures suggested by the Labour Party and as such this scenario is not the same as put forward by Labour.

Scenario B: Conservative Party proposals: Lower taxes
The Conservative leadership campaign focussed predominantly on lowering taxes. We build a scenario to assess the combined impact of lower income taxes, lower national insurance contributions, and lower corporate taxes (table C1). More specifically, we consider a change in tax policy that would raise the higher income tax threshold from currently £50,000 to £80,000. According to the Institute for Fiscal Studies (Reference Johnson and WatersJohnson and Waters, 2019), this would lead to a direct revenue shortfall of £9 billion per annum, holding all else equal – an estimate we use to calibrate effective income tax rate changes. We further consider an increase in the threshold for National Insurance contributions from £8,632 currently to £12,500 assuming it applies to employers, employees and self-employed. The IFS (ibid.) estimate that such a policy would cost £17 billion per annum and we implement a corresponding effective tax rate reduction in NiGEM. Both measures benefit predominantly high earners. As above, we dampen the impact on consumption by one half to account for lower tax elasticities of private spending. Finally, we model a reduction in the corporation tax rate from 17 per cent to 12.5 per cent at an estimated fiscal cost of £13 billion (Johnson et al., 2019).
Macroeconomic effects
We assess the combined macroeconomic effect of the policy measures under each scenario using NiGEM, which allows us to account for feedback effects between fiscal policy, monetary policy and the wider economy. The effects are calculated relative to a baseline scenario where government spending and taxation plans are taken from the Office for Budget Responsibility's March 2019 projections.
Figure C1a shows that fiscal policy measures under scenarios A and B have a similar effect on public finances, raising the public sector deficit by more than 1½ percentage points of GDP relative to the OBR's last projections between 2020–21 and 2024–5. As a result, debt levels stabilise at around 80 per cent of GDP rather than entering a downward trajectory as planned by the May government (figure C1b).
Fiscal impact

In scenario A, additional borrowing is mainly the result of increased government consumption and investment expenditure, adding 2½ percentage points of GDP to the deficit. The modelled tax increases are not enough to cover these costs in our analysis, contributing only 1 percentage point of GDP to lowering the deficit. This is partly because a rise in income and corporate tax dampens consumption and investment, leading overall to a lower total tax intake than direct tax effects would suggest (figure C2). Any additional revenue raised from levies and anti-avoidance measures would potentially reduce the deficit impact somewhat if these measures were to be as effective as suggested by Labour.
Direct and induced tax revenue effects

Spending measures considered under scenario A initially instil some volatility in the economy. This is to a large extent driven by government consumption expenditures which boost aggregate demand between 2020–21 and 2022–3, but the effect on economic growth then reverses as the economy adjusts. Higher demand adds to inflationary pressures, requiring the Bank of England, which we assume adopts a standard policy rule, to respond by raising Bank Rate by around 30 basis points relative to the baseline. As a result of the fiscal boost and monetary policy response, the exchange rate appreciates by around 2 per cent. This, in turn, weakens external competitiveness, the current account balance deteriorates and any initial boost to economic growth is neutralised.
In the long run, higher capital expenditure as a result of proposed investment measures in scenario A bolsters the productive capacity of the economy, adding 0.5 per cent to annual economic output by 2029–30. Net of higher taxes, which dampen activity, measures under scenario A add around 0.4 per cent to long-run economic output.
In scenario B, two thirds of the overall deficit effect is driven by lower income tax and NI contributions and one third the result of lowering corporate taxes. Figure C2 shows that the induced impact on total tax revenue, arising from higher consumption and higher corporate profits, is estimated to be £2.6 billion (adding up differences between the red and black bars), far from covering the direct revenue shortfall of £39 billion.
The impact on economic output of tax cuts considered under scenario B is small, adding on average less than 0.1 per cent per year to GDP by lowering costs of production and encouraging spending.
Macroeconomic impact

Overall, our analysis suggests that expansionary fiscal policy measures proposed at both ends of the political spectrum would require borrowing to go up. Any spending promises in addition to suggested tax cuts, for instance on defence and education, would lead to additional increases in the deficit. Pressures to maintain the quality of public services and accommodate an ageing population would further add to spending needs. The increase in borrowing in both scenarios risks making the economy vulnerable in the event of other shocks, like a no-deal Brexit, and mean that the costs of servicing the public debt will rise. In other words, while borrowing costs may be lower than in the past, some of the costs associated with fiscal give-aways are transferred to future generations.
Another key lesson from the present exercise is that fiscal policy in an open economy of moderate size operating a flexible exchange rate is not very effective in boosting output. Higher spending or lower taxes tend to lead to capital inflows, a higher exchange rate and a loss of competitiveness replacing private sector activity with public spending. Instead, monetary policy is a more effective instrument in the short run if the economy happens to operate below potential, at least as long as interest rates are well above the effective lower bound as they are in this exercise. Higher public investment partly financed by higher taxes and broad-based tax cuts of the magnitude described here would make a small contribution to long-run growth potential.
As a caveat, higher investment and lower tax rates may also have a positive impact on productivity or boost investor confidence which the present analysis does not consider, given that effects are largely unclear and depend, for instance, on the type of investment projects. We have also not considered any distributional effects which across both scenarios may differ widely.
Section 2. Forecast in detail
Financial market conditions
As uncertainty around Brexit and global trade dampen the macroeconomic outlook, financial markets have increasingly placed trust in monetary authorities to add stimulus, pricing in a looser monetary stance than at the time of our May forecast. As a result, borrowing conditions facing households and businesses remain favourable while equity markets have reached new record highs.
The increased likelihood of a no-deal Brexit has led to a marked depreciation in the sterling exchange rate (figure 6, see also figure 1). The pound depreciated by around 4 per cent against both the US dollar and euro between April and July. Our exchange rate forecast is determined by international interest rate differentials (table A1). In our main-case scenario, sterling returns to a US dollar exchange rate of $1.30 in three years' time. In the case of an orderly no-deal Brexit, we would expect sterling to fall below $1.20, with the possibility of an even sharper fall.
Sterling exchange rate

As the anticipation of interest rate cuts in the US is firming, market participants are also expecting the Bank of England to adopt a looser monetary policy stance. A survey of 52 economists conducted by Bloomberg at the beginning of July implies that the Bank of England is expected to keep policy unchanged until the second quarter of 2021, reflecting the risk of a no-deal Brexit. Market-implied interest rate expectations are 15 basis points lower than the current level of Bank Rate of 0.75 per cent until the end of 2020, some 20 basis points below the path expected at the beginning of April and lower than the conditioning path for Bank Rate in our main-case scenario (figure 7).
Market implied paths for short-term interest rates and NIESR main-case scenario

The prospect of looser monetary policy has also led to a reduction in long-term interest rates. NIESR estimates of government bond yield components suggest that this is mainly due to a continued contraction in the term premium (figure 8).
Decomposition of 10-year bond yield

As a result of expected monetary loosening and low long rates, borrowing costs on debt capital markets remain low. Global uncertainty led to some volatility in corporate bond spreads at the beginning of June but much less than at the end of 2018. Since then UK corporate spreads have again fallen, although not as much as in the Euro Area (figure 9).
BBB Corporate bond spread

While demand for credit remains subdued given weak investment conditions, the Bank of England Agents survey reports that credit was generally readily available, apart from slight reductions in certain sectors, like store-based retailers and higher education establishments.
Boosted by the prospect of looser monetary policy, global equity markets have been steaming ahead since the beginning of June after a temporary slowdown and at the beginning of July had almost fully recovered from the bear market of late 2018 (figure 10).
Equity markets

Aggregate demand
Output and components of demand
The quarterly path of GDP is likely to be volatile over the course of 2019 and 2020, partly reflecting changes in stockbuilding and associated exports and imports around key Brexit-related dates. According to the latest ONS data and the NIESR GDP Tracker respectively, the economy expanded by 0.5 per cent in the first quarter, as production and imports increased to meet inventory demand ahead of the original Brexit date, and then contracted by 0.1 per cent in the second quarter. The nowcast of contraction in the second quarter is driven by falls in production and construction output, partially offset by a smaller than usual positive contribution from the service sector. Growth in the service sector appears to have stalled: the headline business activity balance in the IHS Markit/CIPS UK services PMI survey fell from 51 in May to 50.2 in June, the lowest reading since the 48.9 recorded in March, when confidence dipped ahead of the original Brexit departure date. The reduced positive contribution of the service sector points to an ongoing loss of momentum in the economy. There is a material risk that the UK economy is already in recession, though the NIESR GDP Tracker suggests that this will be narrowly avoided with output forecast to expand by 0.2 per cent in the third quarter.
In our main-case forecast scenario the economy grows by around 1 per cent in both 2019 and 2020, a little slower than the rate achieved in 2018.
As shown in figure 11 (and table A3), the forecast slowdown in GDP growth in 2019 and 2020 is largely matched on the demand side by a similar slowdown in consumption growth, while fluctuations in the contribution of stockbuilding are expected to be largely offset by changes in net trade as import growth first rises and then falls. The underlying picture was also distorted in the first quarter of 2019 by significant movements in imports of unspecified goods, including non-monetary gold, that account for large but offsetting impacts to gross capital formation and net trade.
Contributions to GDP growth

Household sector
After growing at an average quarterly rate of 0.4 per cent in 2017 and 2018, private consumption growth picked up to 0.6 per cent in the first quarter. This may have reflected some stockpiling of imported goods by households ahead of the original Brexit departure date, though the evidence for this is only anecdotal. More generally, a relatively flat saving ratio over the past couple of years suggests that consumption is growing broadly in line with household income.
The outlook for private consumption growth will depend primarily on how household incomes develop. In our main-case forecast scenario, household incomes continue to grow at an average annual rate of around 2 per cent, driven by growing real wages and rising employment. This real income growth supports private consumption growth of around 1½ per cent per annum and a gradual increase in the household saving ratio from its current level of 4.1 per cent of household income to 5 per cent in 2020 and 6 per cent in 2021. This build-up of saving would be consistent with relatively low consumer confidence, as measured by the GfK Consumer Confidence Index. Evidence from the Bank of England Agents shows that uncertainty about Brexit and a soft housing market are contributing to subdued consumer demand.
We would expect private consumption growth to be much weaker in any no-deal scenario. This reflects a weaker path for real disposable income in that scenario, with incomes stagnating in 2020. The extent of the weakness of consumption growth would depend on how households react to weaker income, dependent partly on whether they expect incomes to be permanently lower. One possibility, incorporated within our orderly no-deal scenario, is that households reduce saving a little to cushion the effect on consumption. This would be consistent with households to some extent being prepared for a no-deal Brexit, and already having built up the household net worth-to income ratio to record levels. But this view could prove to be too optimistic. In the immediate aftermath of the financial crisis, the household saving ratio rose sharply from a trough of 6.5 per cent at the beginning of 2008 to 11.9 per cent in the middle of 2009, thereby contributing to the sharpness of the downturn. A similar increase in saving in a no-deal Brexit would accentuate any reduction in aggregate demand and so make the downturn worse than shown in our no-deal scenario.
Investment
Following four consecutive quarters of decline throughout 2018, business investment grew by 0.4 per cent in the first quarter of 2019, partly driven by investment in buildings and structures.
Recent surveys suggest that business investment is likely to continue to be paralysed by Brexit-related uncertainty. Results from the Bank of England/Nottingham/Stanford Decision Maker Panel have highlighted the extent to which Brexit-related uncertainty has contributed to weak business investment. In a recent speech, Bank of England Governor, Mark Carney, reported that investment has been persistently weaker among businesses that cite Brexit-related uncertainty as one of their three most important sources of uncertainty, reducing total business investment by 6 to 14 per cent (Reference CarneyCarney, 2019). The latest Deloitte CFO Survey, measuring sentiment in the second half of June, found that a more challenging environment was weighing on the corporate sector, with risk appetite among UK CFOs falling to the lowest level since the failure of Lehman Brothers in 2008. In the latest CBI Industrial Trends Survey, 61 per cent of manufacturers cited demand uncertainty as a factor limiting capital expenditure, the highest reading in six years.
Investment in ‘Global Britain’ – gain, retain … or risk economic pain?
by Arno Hantzsche and David Nguyen∗
This box reviews recent trends in foreign direct investment (FDI) based on various ways of measurement. It highlights the importance of reinvestments alongside new investment projects and shows that to bolster future welfare, policy should not only focus on publicity-generating new investor arrivals but also create an economic environment that encourages current foreign investors to retain and expand their existing investments in the UK. This is of particular relevance in the context of the government's ambition to advance the UK's position after Brexit as an outward-looking economy.Footnote 1
FDI measures investments made by foreign entities in domestic enterprises and has three components: equity capital, reinvested earnings and intra-company loans. FDI inflow data tends to be very volatile and often reflects large investment projects by individual firms making comparisons over time difficult. Figure D1 shows that in particular prior to the Great Financial Crisis, FDI inflows into the UK were soaring.
Inward foreign direct investment flows

To draw comparisons across countries and over time, a better measure is the stock of FDI. In 2017, total inward investment stocks in the UK exceeded US$1.5 trillion according to latest data from the United Nations Conference on Trade and Development (UNCTAD), nearly four times as much as Italy (378 per cent), and nearly twice as much as France and Germany (168 per cent and 179 per cent respectively).Footnote 2 The UK is also a large source of foreign direct investment abroad, until 2016 holding more in assets abroad than foreign investors held in the UK. Within Europe, only German firms have accumulated higher FDI stocks.
A third measure is counting the number of ongoing investment projects, which often allows for timelier estimates compared to stocks and flows data. Figure D3 shows data from the Department for International Trade on recent trends in the number of investment projects. The figure highlights an important distinction between new investment projects and those aimed at maintaining or expanding existing investments. It shows that, in recent years, reinvestments have made up more than half of all FDI projects, which also include those that result from mergers and acquisitions. This is also reflected in FDI flows and is a widespread feature in developed economies. According to the UNCTAD 2017 World Investment Report, “in 2016, as in the previous year, reinvested earnings accounted for roughly half of FDI outflows from developed-country [multi-national enterprises]” (p. 15). In the UK, reinvested earnings accounted for more than half of all inward FDI in 2017 and for 70 per cent in 2018 according to Eurostat.Footnote 3 It is therefore a worrying sign that since 2017, not only the number of new investment projects, but also reinvestments have been falling. Anecdotal evidence of international carmakers closing car plants in the UK and relocating elsewhere, as well as research based on most recent investment data (Breinlich et al., 2019), suggest that uncertainty about the UK's future trading relationship with the EU takes a large part of the blame. Single market and customs union membership enabled non-EU investors to enjoy the UK's business friendly environment while being able to access the European market without major frictions to trade and global value chains. Uncertainties around global trade and new trade agreements between the EU and third countries, like Japan, which eliminate frictions to trade that otherwise would have encouraged foreign companies to produce locally, are likely to have contributed to a global slowdown in FDI.
Inward foreign direct investment stocks

UK inward foreign direct investment projects by investment type (number of projects)

∗The authors thank Jagjit Chadha and Garry Young for helpful comments.
Figure D3 also shows that the number of jobs created by foreign investors has dropped by 23 per cent since 2016. Often FDI is associated with better ideas and management practices competing with those of local incumbents (so-called ‘demonstration effects’, see Reference Görg and GreenawayGörg and Greenaway, 2004; Helpman et al., 2004).Footnote 4 If the slowdown of FDI were to continue in the future, this would pose an important risk for employment and productivity in the UK. Investment data suggests that the focus should as much be on retaining current investors as on attracting new ones from around the globe.
Notes
1 Members of government have been using the label ‘Global Britain’ to promote trade openness, international political cooperation and importantly also international investment after Brexit. An overview of the use of this label by the government and a critical review is provided in House of Commons Foreign Affairs Committee (2018), Global Britain. Sixth Report of Session 2017–19.
2 While UNCTAD is reporting FDI stocks data in historical cost terms to address revaluation effects, differences may still arise between FDI flows and first differences of FDI stocks as the result of different underlying data sources and definitional discrepancies.
3 Balance of payments statistics.
4 For a detailed discussion of short- and long-run economic effects of FDI see also Reference ChadhaChadha (2016).
In our main-case forecast scenario, persistent uncertainty continues to drag on business investment. In this main-case scenario, business investment falls by 1½ per cent in 2019, before growing slightly in 2020.
In an orderly no-deal Brexit scenario, the uncertainty that has been holding back investment would crystallise and business investment would be expected to fall sharply. Our no-deal scenario incorporates a fall in business investment of 22 per cent in 2020, broadly in line with the decline in the immediate aftermath of the financial crisis when business investment fell by 20 per cent. One of the drivers of lower investment in a no-deal Brexit would probably be a reduction in investment in the United Kingdom by foreign businesses. Box D discusses recent trends in foreign direct investment. It is possible though that this would be too pessimistic as some businesses may simply be waiting to find out whether they should invest for a soft or hard Brexit and holding back on both until they knew which direction to take.
External sector
Alongside faltering demand at home, the global trading environment is also fragile (see the World Economy chapter of this Review). In our main-case scenario, export growth picks up to 3 per cent in 2019, after being nearly flat in 2018, before slowing again in 2020 (table A4). Import growth is likely to be volatile as stockbuilding increases and then falls. Import growth reaches 7 per cent in 2019, before falling by 5 per cent in 2020.
In a no-deal Brexit scenario, net trade could be expected to adjust to cushion the effects of reduced expenditure at home, assisted by a depreciation in the exchange rate that would switch expenditure towards UK goods and services. This adjustment would largely come about by imports falling by more than exports. In our no-deal scenario, imports fall by over 7 per cent in 2020, while exports fall by around 2 per cent.
The expected fall in exports in a no-deal scenario is in sharp contrast to their rise in the immediate aftermath of the EU referendum. Exports rose by 5.6 per cent in 2017 supported by a stronger global economy and weaker export prices due to the currency depreciation.
The weaker global outlook in 2019 suggests that UK businesses would face a tougher external environment in the event of a no-deal Brexit. Moreover, while businesses that faced falling demand at home would be expected to try to pivot towards external markets, this would be hampered by any new tariffs and non-tariff barriers applied by the European Union. For the most part EU tariffs on goods imported from third countries, as the United Kingdom would become in a no-deal scenario, average around 4 per cent, and so would not be a major impediment to exports. The more significant impediment is expected to be non-tariff barriers, particularly on services exports. The impact of leaving the EU single market on services exports is expected to be substantial, though the speed and magnitude of the decline in services exports is uncertain.
Supply conditions
There continues to be little, if any, slack remaining in the economy. Economic growth, therefore, will need to come from an expansion in supply potential, determined by the availability of capital, labour and the efficiency with which they are used in production. However, productivity growth is precarious, weak investment limits the growth rate of capital while the labour market remains tight – altogether constraining potential output growth to around 1½ per cent per year. A no-deal Brexit poses a severe risk to supply conditions, potentially leading to an inefficient reallocation of resources as moving input factors across the border becomes more costly.
As far as capital is concerned, the net capital stock is estimated to have grown by 1.5 per cent in 2018. Our forecast of weak investment implies that capital stock growth will continue at around 1½ per cent per year.
The labour market
The labour market remains tight, yet early signs are emerging of a slight cooling amidst Brexit and global uncertainties.
Unemployment remains at the lowest rate since 1974, having reached a floor of 3.8 per cent at the beginning of 2019. A wider measure of labour market slack is underemployment, which also accounts for the fact that a share of those employed work fewer hours than they would like to, and others work more (Reference Bell and BlanchflowerBell and Blanchflower, 2018). By the end of 2018, both measures of economic slack had converged, suggesting there is little spare capacity left on labour markets (figure 12).
Unemployment and underemployment

However, most recent data suggests that employment growth is slowing down (figure 13). Increases in employment since the beginning of 2019 were entirely due to rising numbers of self-employed persons, while the number of employees has actually fallen from a high of 27.7 million in the three months to February to 27.6 million in the three months to May. Net migration continues to add to the supply of labour but has remained stable since 2016 as a sharp fall in EU net migration has been offset by higher net migrant inflows from non-EU countries. At the same time, the number of job vacancies has recently fallen, by 21,000 to a total of 827,000 in the second quarter of 2019 relative to the first quarter.
Employment and vacancies

Survey evidence by KPMG and the Recruitment and Employment Confederation suggests that Brexit uncertainty and global trade tensions play an important role in explaining the cooling of the labour market. Hiring activity remained muted in June as permanent staff placements fell for the fourth month in a row and temporary billings expanded at a low pace. According to the Bank of England's Agents, employment intentions fell in the second quarter of 2019, the first negative print since 2016. Deloitte reports that 62 per cent of CFOs surveyed by the consultancy expect to reduce hiring in the next three years as a result of Brexit.
The uncertain economic climate has also led to an easing of staff turnover as employees have increasingly become reluctant to move job. Data on job-to-job moves show that this trend is most pronounced for low and medium skilled jobs (figure 14).
Job-to-job moves by skill level (destination job(a)

In our main-case forecast scenario we forecast the unemployment rate to remain around 4 per cent and employment to grow by 0.2 to 0.6 per cent per year as labour force participation increases further and inward migration keeps adding to the number of available workers (table A7). In the case of an orderly no-deal exit, we would expect the unemployment rate to rise by 1–2 percentage points within two years. In this scenario, a lower level of inward migration poses a long-run risk to supply potential.
Productivity puzzles
A marked slowdown in the growth rate of labour productivity was recorded in the first quarter of 2019. Output per hour decreased by 0.2 per cent compared to the same quarter one year earlier, the third quarter in a row with a negative print. This was mainly due to a strong increase in hours worked of 2 per cent relative to a year earlier, outpacing the growth rate of gross value added of 1.8 per cent. Labour productivity measured by output per job increased by 0.8 per cent over the same period.
The ONS estimates that the weakness in market sector output per hour growth since the first quarter of 2008 (of 0.3 per cent by the first quarter of 2019) was predominantly due to a fall in multi-factor productivity, reducing labour productivity growth by 4.5 percentage points. The reallocation of capital to labour in recent years also played a role, as capital deepening added a mere 1.4 per cent to labour productivity growth, leaving a 3.3 percentage point contribution from improvements in the skills composition of the labour force.
Consistent with the assumption of chronic uncertainty in our main-case forecast scenario, we project labour productivity growth to remain weak at 0.3 per cent in 2019, recovering only slowly to just above 1 per cent in 2020 and 2021.
Prices
A tight labour market with widespread skills shortages on one hand, and cooling hiring intentions amidst elevated levels of uncertainty on the other hand mean that wage growth is stabilising at a robust pace. The ONS estimates that whole-economy unit labour costs increased by 2.1 per cent in the first quarter of 2019 compared to a year earlier, after more than 3 per cent in the last quarter of 2018. This reflects a slowdown in the growth rate of labour costs per hour of 1.9 per cent relative to 2.9 per cent in 2018Q4 as hours worked increased markedly, dampening hourly compensation, as well as the reduction in labour productivity.
Whole economy regular average weekly earnings increased by 3.6 per cent in the three months to May, compared to the year before. While an increase in the National Living Wage of 4.9 per cent to £8.21 in April increased the cost of employing workers at the lower end of the wage distribution and public sector pay increased markedly in April, this was offset by a slowdown in wage growth in other areas. NIESR's Wage Tracker nowcasts an increase of 3.8 per cent in the second quarter of 2019 and forecasts 3.6 per cent for the third quarter. Elevated levels of Brexit-related uncertainty are likely to reduce workers' bargaining power, dampening wage growth prospects more than historically low levels of unemployment would otherwise suggest. Together with information from our monthly GDP Tracker and forecasts of employment growth and non-wage labour costs, we estimate unit labour cost growth of around 3 per cent in the second and third quarter of 2019. With wage and employment growth stabilising, we expect rates of labour cost growth to ease back to between 2 and 3 per cent for the rest of the year and 2020 (figure 15, table A2).
Unit labour costs, annual growth rate

Robust yet stabilising domestic cost pressures and a weaker exchange rate translate into elevated inflationary pressure, offset partly by weak world price inflation. While the headline annual consumer price inflation in June remained at 2 per cent, our trimmed mean measure of underlying inflation, which excludes the highest and lowest 5 per cent of price changes, rose by 0.2 percentage points to 1.0 per cent (see NIESR press note on CPI inflation statistics).
In our main-case forecast scenario, we expect inflation to remain around 2 per cent over the forecast horizon. In the event of a no-deal exit, a higher unemployment rate may dampen wage pressures but the expected depreciation of the pound and higher sterling import prices would considerably add to price pressures. In our orderly no-deal scenario, CPI inflation rises to more than 4 per cent in 2020.
Public finances
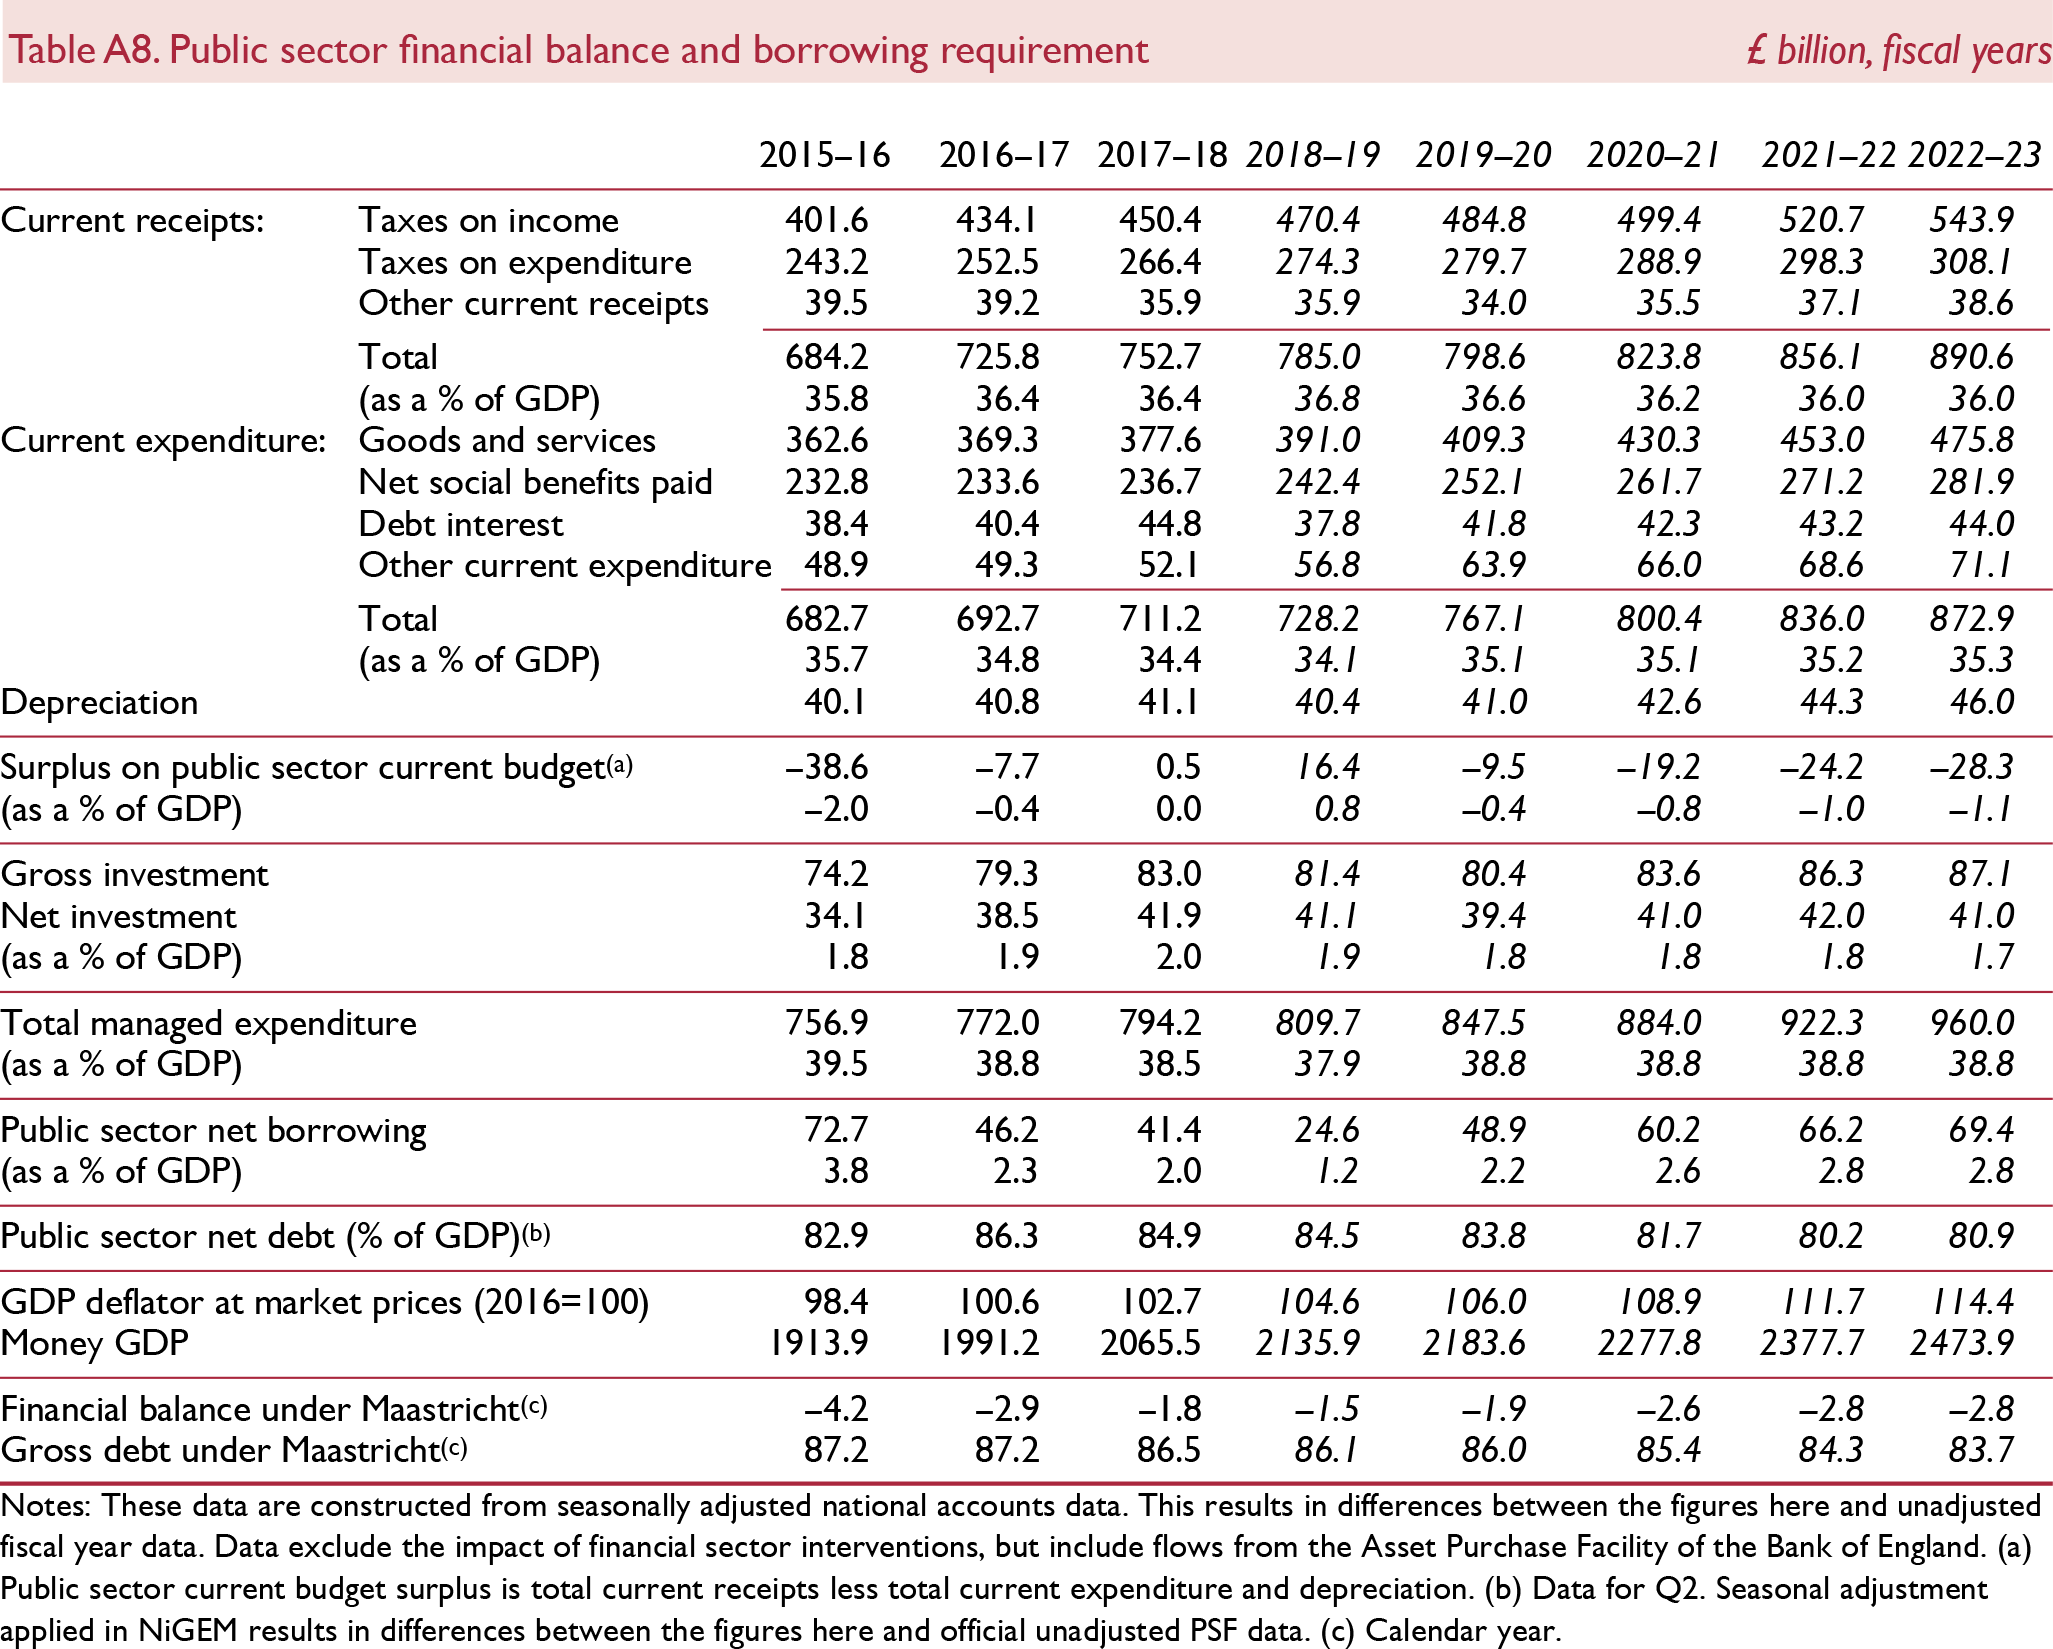
Recent public finances data have continued to be very favourable. Public sector borrowing in the first two months of the 2019–20 financial year was £11.9 billion, £1.8 billion higher than at the same stage of the previous financial year in the whole of which (April 2018 to March 2019) borrowing turned out to be the lowest in 17 years. Public sector net debt at the end of May 2019 was 83 per cent of GDP, 1.4 percentage points lower compared to a year before.
Looking ahead, the picture is darkening. As discussed in more detail in section 1 and Box C, the likelihood has increased considerably that public spending will be higher and/or tax revenue lower in the near term, resulting in higher borrowing. Against the backdrop of high fiscal uncertainty, we maintain the assumption that total managed expenditure will grow at a faster rate than projected by the Office for Budget Responsibility in their March 2019 Economic and Fiscal Outlook. At the same time, a weaker outlook for the economy in the near term means that GDP in our main forecast is lower than projected by the OBR and also leads to less tax revenue being generated. Our main-case forecast scenario has public sector net borrowing increasing above 2 per cent of GDP in 2019–20, to levels last recorded in 2016–17, and it stays elevated over the forecast horizon. As a result, public sector net debt falls more slowly than last projected by the OBR and in our forecast does not drop below 80 per cent of GDP in the medium term.
A harder Brexit poses a substantial risk to our public finances projection. For instance, we estimate that an orderly no-deal exit would add 3–4 percentage points to the net debt-to-GDP ratio by 2023–24.
The ONS has published updated guidance on the treatment of student loans in the public sector finances to better reflect the government's and borrowers' financial position by partitioning genuine loans and government spending.Footnote 3 It estimates that the new treatment would add considerably to public sector net borrowing figures, including historical ones. For instance, the impact in 2018–19 is estimated to be £10.6 billion, or 0.5 per cent of GDP. We will reflect accounting changes in our next forecast once they have been fully implemented by the ONS in September.
Sectoral balances
Table A9 shows the saving and investment balances of the household, corporate and public sectors of the economy and the resulting balance with the rest of the world. If investment is greater than saving for a sector, then that sector is a net borrower. The aggregation of these three domestic sectors is the current account balance, which reached a deficit of 5.6 per cent of GDP in the first quarter of 2019, the amount of borrowing from the rest of the world that is required in order to fund domestic investment plans (see also figure 16).
Aggregate saving, investment and current account deficit

In the first quarter of 2019, all three domestic sectors of the economy – households, companies and government – were in deficit, reflecting the low level of saving in the UK economy. This is unusual historically; it is more normal for the household sector to save more than it invests and help finance the deficits of the corporate and government sectors.
The unusually large household sector deficit reflects both low financial saving and relatively high housing investment. Household investment rose steadily from a trough of 3.2 per cent of GDP in 2009 to 4.4 per cent of GDP in 2018, which is similar to the pre-crisis high of 4.5 per cent in 2006–7. Gradually rising levels of household saving will mean that the financial deficit will be reduced over time and move into a more typical surplus position around 2022.
On the corporate side, saving has been supported by robust profits, offset by higher dividend distributions, some of which impact directly on the balance of payments as they are paid overseas. We forecast the corporate saving to GDP ratio to pick up to 10 per cent in the medium term, broadly in line with corporate investment, so that the corporate sector as a whole becomes broadly self-financing.
Government sector saving is expected to fall from a recent peak of 1½ per cent of GDP in 2018 to around zero per cent of GDP in the medium term as austerity is eased. With government investment running at around 2½ per cent of GDP we expect the government to remain in a net borrowing position of around 2½ per cent of GDP beyond 2020.
The current account deficit is forecast to fall from a peak of almost 5 per cent of GDP in 2019 towards 2 per cent of GDP by 2023, reflecting higher saving in the household sector. The deficit is currently high compared with most other G7 economies or the Euro Area and is a reflection of lower saving in the UK than elsewhere. The net international investment position is estimated to be in deficit by £195 billion in the first quarter of 2019 (around 10 per cent of GDP).
Appendix – Details of main-case forecast scenario