


1. Introduction
Glucagon-like peptide-1 (GLP-1) receptor agonists were initially developed as a method of combating diabetes; however, the secondary effects of improved satiety, slowed gastric emptying, and appetite suppression (Latif et al., Reference Latif, Lambrinos, Patel and Rodriguez2024; Mayo Clinic, 2024) have made the medications an increasingly popular method for weight loss and weight management. Early public polling efforts in Spring 2024 indicated that 6% of U.S. adults were currently using GLP-1 medications and that between 2 and 3% were using them specifically to lose weight (Montero et al., Reference Montero, Sparks, Presiado and Hamel2024; Witters and Maese, Reference Witters and Maese2024). Subsequent efforts indicate that the prevalence of GLP-1 use is quickly growing, with Hristakeva et al. (Reference Hristakeva, Liaukonyte and Feler2026) estimating an incidence rate among U.S. adults of 8.3% by July 2024 and a national Gallup poll estimating a usage rate of 12.4% through October 2025. Additionally, Gratzl et al. (Reference Gratzl, Rodriguez, Cartwright, Baker and Stucky2024) estimate that GLP-1 prescribing rates (defined as the monthly number of individuals with a GLP-1 receptor agonist prescription divided by the number of individuals with any prescription) have grown from approximately 1% in 2020 to 4.4% in March 2024.
This growth in usage has been accompanied by discussion of potential implications for the U.S. food system. Industry practitioners have noted changes in where GLP-1 users are purchasing their meals and what products are being purchased, with a noticeable shift toward high-protein items (Circana, 2024; 2025b). Despite these broad industry observations, the economic literature has not yet formally examined the relationship between GLP-1 use and preferences for meal location, and findings related to protein consumption are mixed (Dilley et al., Reference Dilley, Adhikari, Silwal, L. Lusk and McFadden2025; Roe, Reference Roe2024). Further, relatively little is known about how preferences differ across varying durations of use, despite industry observations indicating that longer-term users have consumption patterns that differ relative to those observed at the onset of their treatment (Circana, 2025a; Ulie, Reference Ulie2025). Thus, the long-term implications for the U.S. food retail, foodservice, and protein industries are uncertain. Taken collectively, the objectives of this study are to: i) estimate which food outlets (i.e., sources of meals, such as retail and restaurant options) GLP-1 users are more likely to choose when consuming their meals, ii) examine preferences for protein sources included in their meals, and iii) quantify differences in meal preferences between non-users and users, as well as across varying durations of GLP-1 use.
This research contributes to the growing literature on GLP-1 use and to broader work on food and store choice, both substantively and methodologically. First, industry reports and media emphasize the importance of protein in GLP-1 users’ diets (Circana, 2024; Wainer, Reference Wainer2025), consistent with the inherent “GLP-1 friendliness” of lean protein sources (Mozaffarian et al., Reference Mozaffarian, Agarwal, Aggarwal, Alexander, Apovian, Bindlish and Bonnet2025) and the benefits of high-protein diets during periods of weight loss (Halton and Hu, Reference Halton and Hu2004; Paddon-Jones et al., Reference Paddon-Jones, Westman, Mattes, Wolfe, Astrup and Westerterp-Plantenga2008; Westerterp-Plantenga et al., Reference Westerterp-Plantenga, Lemmens and Westerterp2012). However, empirical evidence on how GLP-1 use affects protein consumption is mixed. Roe (Reference Roe2024) reports that around 56% of GLP-1 users experienced no change in their consumption of meat following adoption, with the remaining 44% split evenly between having increased and having decreased their consumption. In contrast, Dilley et al. (Reference Dilley, Adhikari, Silwal, L. Lusk and McFadden2025) report consistent net reductions in consumption across major animal proteins, despite GLP-1 users’ similar stated desire to consume relative to non-users. Meanwhile, Bina et al. (Reference Bina, Tonsor and Richards2026) note a “premiumization” effect of GLP-1 use on meat protein demand where users consume lower quantities but value it more highly, whereas Hristakeva et al. (Reference Hristakeva, Liaukonyte and Feler2026) report that GLP-1 adoption yields 6% reductions in expenditures on retail fresh and frozen meat.
In the context of current GLP-1-related discourse, this study expands existing knowledge by examining how preferences differ across specific protein sources among GLP-1 users, and how these preferences vary across food outlets. Prior work primarily documents net changes in consumption or expenditures and therefore does not capture how preferences are distributed across protein types or meal settings. Identifying these relative preferences provides a more detailed understanding of GLP-1 users’ consumption patterns and informs how industry may respond to these patterns.
Second, and extending beyond our focus on GLP-1 use, a substantial body of literature examines the role of protein consumption during weight loss. Halton and Hu (Reference Halton and Hu2004) document short-run benefits of high-protein diets, including increased thermic effects and greater satiety. Paddon-Jones et al. (Reference Paddon-Jones, Westman, Mattes, Wolfe, Astrup and Westerterp-Plantenga2008) corroborate these findings and note that moderate increases in dietary protein, combined with exercise and controlled energy intake, can help preserve fat-free mass and reduce fat mass. Westerterp-Plantenga et al. (Reference Westerterp-Plantenga, Lemmens and Westerterp2012) further argue that successful weight management under negative energy balance depends on sustained satiety, basal energy expenditure, and the preservation of fat-free mass. To achieve these outcomes, they recommend maintaining daily protein intake at 0.8–1.2 g per kilogram of body weight while restricting carbohydrates and fats, noting that the effectiveness of “low-carb” diets largely reflects their higher protein content. Collectively, this literature highlights a link between protein intake and weight loss outcomes, suggesting that protein-dense diets may appeal to GLP-1 users and others seeking weight loss.
Despite this prior nutrition and weight loss literature and the potential appeal of protein to GLP-1 users, evidence on GLP-1 users’ preferences for protein consumption remains limited. Existing studies primarily examine household-level expenditure changes (Hristakeva et al., Reference Hristakeva, Liaukonyte and Feler2026) or self-reported shifts in consumption (Dilley et al., Reference Dilley, Adhikari, Silwal, L. Lusk and McFadden2025; Roe, Reference Roe2024), which do not capture actual meal-time decisions and may be influenced by reporting bias (i.e., GLP-1 users necessarily feel more satiated, which may influence consumption volume reporting). While Dilley et al. (Reference Dilley, Adhikari, Silwal, L. Lusk and McFadden2025) provide insight into stated desire to consume protein, they do not assess realized choices within meals. As a result, there remains an incomplete understanding of whether GLP-1 users prefer to include protein in their meals, and which sources they select when they do. We address this gap directly.
Last, there is a long body of literature that leverages household-level data to inform assessments of food store choices (Briesch et al., Reference Briesch, Chintagunta and Fox2009; Cuffey and Beatty, Reference Cuffey and Beatty2022; Dong and Stewart, Reference Dong and Stewart2012; Kyureghian and Nayga, Reference Kyureghian and Nayga2013; Taylor and Villas-Boas, Reference Taylor and Villas-Boas2016). The data and methods used in these efforts are powerful and have enabled refined insights across a host of household characteristics and the estimation of causal policy impacts. However, this literature typically models decisions at the level of shopping trips or temporally aggregated expenditures, rather than at the level of individual meals, where consumers may derive utility from both where food is obtained and what is consumed.
This distinction is particularly relevant in the context of GLP-1 medications, as users experience reduced appetite and may elect to forego meals. While free-food events have been formally addressed in prior work (Taylor and Villas-Boas, Reference Taylor and Villas-Boas2016), the decision to skip a meal has not been explicitly modeled. This omission has important implications for food outlet patronage, aggregate food spending, and diet-related health outcomes. Thus, efforts to analyze consumer food purchasing behavior in the context of health trends (e.g., GLP-1 use, weight management) should account not only for food outlet choice, but also for the possibility that consumers elect to skip a meal altogether. This outcome is particularly relevant when appetite is directly affected and has important implications for food sellers concerned with consumer patronage.
We use a discrete choice model of consumer behavior (McFadden, Reference McFadden1974) to meet the objectives of this study and to address the key gaps in our understanding of GLP-1 medications. Our framework specifies that consumers have various food outlet alternatives in which they can consume their meals, and these outlets provide different marginal utility. In food-at-home (FAH) decision making, consumers can choose to eat a meal with ingredients purchased in person, online, or through a meal preparation or other service. In food-away-from-home (FAFH) decision making, consumers can choose to eat a meal purchased in a fine dining restaurant, in a casual dining restaurant, in a fast casual or quick service restaurant, or in some other establishment. Last, an outside option is available in which consumers can elect to skip a meal. Our choice model specifies that the utility obtained from a meal depends not just on the chosen food outlet, but on which of five protein sources are included in the meal: beef, chicken, pork, seafood, and alternative proteins. Interactions between GLP-1 use indicators and outlet- and protein-specific variables allow us to examine differences in preferences between users and non-users, as well as across durations of use. The model is estimated using survey data that combine information on GLP-1 use and prior-day meal consumption among U.S. adults.
As a preview of our results, GLP-1 use is associated with sizable differences in meal choice probabilities. Relative to non-users, GLP-1 users are substantially less likely to consume meals sourced from physical retail (44.9% versus 63.3%) and more likely to skip a meal (21.3% versus 11.8%), while also being slightly more likely to source meals from online retail and each FAFH outlet. These differences are concentrated among shorter-term users. Individuals who have used GLP-1 medications for one to six months exhibit the lowest probability of physical retail meal sourcing (38.6%), while longer-term users’ probabilities are much closer to non-users’ (60.1% for those using for more than twelve months). Protein preferences also differ across groups. Non-users uniformly prefer meals that include each evaluated protein source relative to meals with no protein, whereas GLP-1 users show a less consistent pattern, with strong preferences for beef and chicken, but weaker or absent preferences for pork and seafood in some outlets. Overall, the largest deviations from non-users are observed among shorter-term GLP-1 users, while longer-term users more closely resemble non-users in both meal location choices and protein preferences.
These findings are important in three distinct ways. First, our modeling of food choices at the meal level explicitly incorporates meal skipping as a choice outcome, allowing us to capture differences not only in what consumers eat, but in whether they choose to eat at all. This is particularly important in contexts such as GLP-1 use and weight management, where appetite suppression (or intentional dieting) is prevalent and traditional analyses of food purchasing behavior may overlook variation in meals consumed. By accounting for this component of choice, our approach provides a more complete representation of consumer behavior across GLP-1 users and non-users.
Second, we provide new empirical evidence on how GLP-1 use is associated with both food outlet choice and protein inclusion, revealing notable differences across outlets and consumer groups. Examining these components is important because they offer insight into which outlets and product categories are more prominent among GLP-1 users, and thus are more exposed to changes in purchasing patterns. These patterns are directly relevant for retailers and foodservice establishments seeking to adapt product offerings and marketing strategies.
Third, we show that these associations vary substantially by duration of GLP-1 use, with shorter-term users driving most observed differences. This distinction is important because it highlights that differences in food choices are not uniform across GLP-1 users, but instead vary across user groups, helping to explain mixed evidence related to protein consumption in the early literature (Dilley et al., Reference Dilley, Adhikari, Silwal, L. Lusk and McFadden2025; Roe, Reference Roe2024) and providing more targeted insight into which segments of users exhibit the largest differences in behavior. Collectively, these findings contribute to the GLP-1 literature by providing further understanding of how the health technology is interacting with U.S. food markets.
The remainder of this study is as follows. We start by describing the survey data and its application to the analysis of food outlet and protein preferences. We then outline the empirical approach and sensitivity assessments. The results of our analysis are then presented, followed by a discussion of the implications of our findings and directions for further research.
2. Materials and methods
2.1. Data
We use survey data obtained from the Meat Demand Monitor (MDM) project administered by K-State Research and Extension and jointly funded by the U.S. Beef and Pork Checkoff programs. The MDM is a national, online consumer survey that is intended to measure domestic meat demand in both retail and foodservice settings (Tonsor, Reference Tonsor2020). It is distributed every month by the market research company Dynata to a new sample of the population (i.e., the data takes a pooled cross-sectional structure) that is designed to be representative in terms of sex, age, income, educational attainment, race, and geographic region. Survey respondents receive redeemable “points” through the Dynata rewards system upon completion of the survey to incentivize participation.
A prior day consumption recall embedded in the MDM survey is key to this research. Participants are first asked to recall where they consumed breakfast, lunch, and dinner the day before. Available options are “At Home,” “Away from Home,” and “Neither” (i.e., skipped meal). This last option is especially pertinent in our application to GLP-1 use (and more broadly, weight management) and has not been formally considered in prior, related work assessing food outlet choices. If a participant reports consuming a meal at home, they are then asked if the ingredients for that meal were purchased in person from a grocery store or other physical retailer (FAH Retail), purchased online and delivered to the home (FAH Online Retail), or purchased from a meal preparation company or other source (FAH Other). If a meal was consumed away from home, participants report whether it was consumed at a fine dining restaurant (FAFH Fine), a casual dining restaurant (FAFH Casual), a fast casual or quick service restaurant (FAFH Quick), or in some other setting (FAFH Other). Thus, participants have three meal decisions (i.e., breakfast, lunch, and dinner) and eight location alternatives across FAH, FAFH, and skipping the meal.
In a similar fashion, participants are asked which aggregate protein sources were included in each of their prior day (non-skipped) meals with available options being beef, chicken, pork, seafood, alternative proteins (including eggs), and no protein. Importantly, this prior day consumption recall measures the inclusion of protein in a meal but not the volume. Thus, this study does not speak to consumption quantity, but rather frequency.
Last, participants report whether they are currently taking a GLP-1 medication and, if so, how long they have been taking it. Industry reporting suggests that food purchasing behavior may evolve over the course of GLP-1 use (Circana, 2025b; Ulie, Reference Ulie2025). While our data do not allow us to observe within-person changes over time, reported duration of use provides a means of comparing meal choices across GLP-1 users at different stages of use. As such, duration is used to define cross-sectional groups rather than to track individual behavioral changes. Importantly, these questions related to GLP-1 use in the MDM appear toward the end of the survey instrument and after all prior day meal location and protein inclusion questions. Thus, concerns over possible framing effects and bias in the prior day recall related to the presentation of GLP-1 information is mitigated compared to more common stand-alone or one-time survey assessments focused heavily on GLP-1 use.
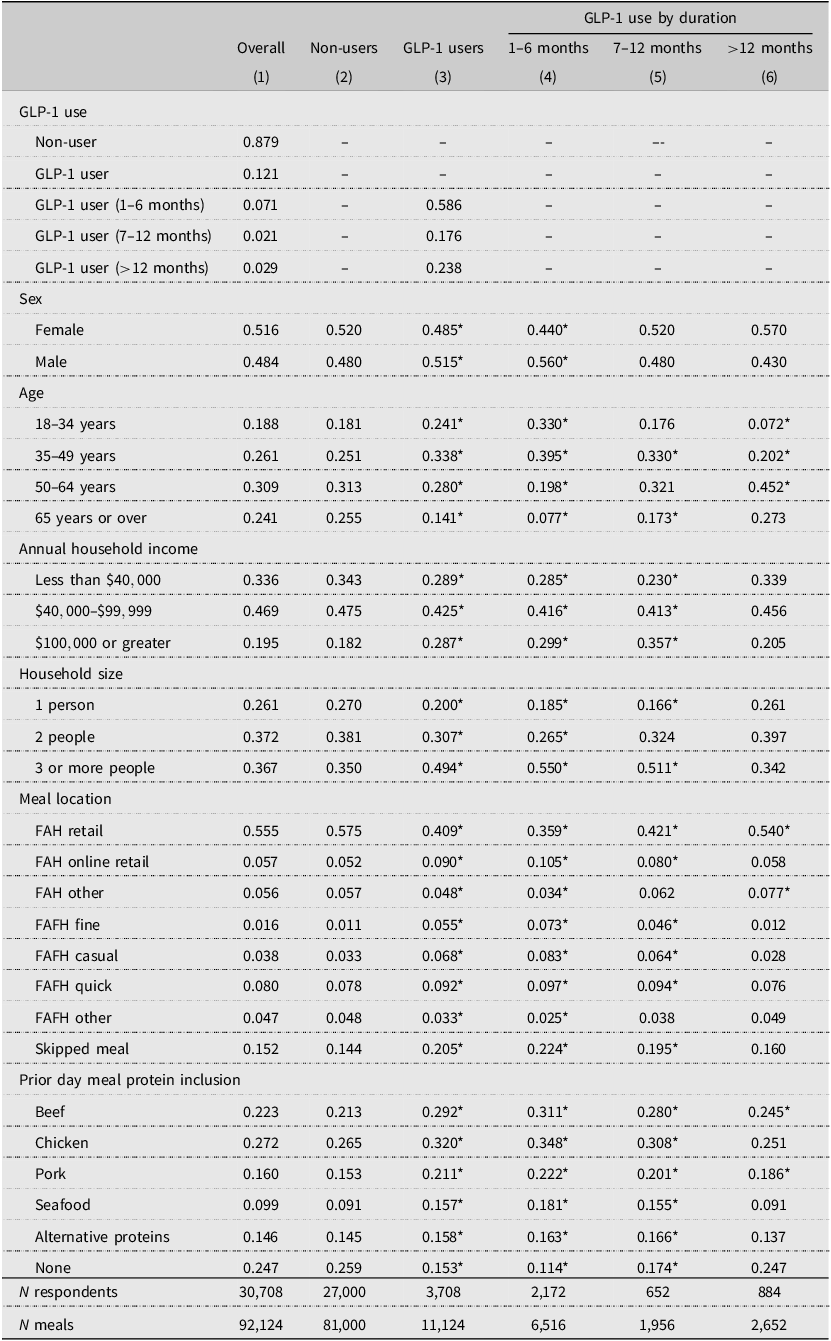
A total of 51,557 participants completed the MDM survey between January and December 2025. We restrict our analysis to 30,708 participants that are over the age of 18, who pass two embedded attentiveness checks, and who provide complete prior day recalls and sociodemographic information. Table 1 describes the sample and their meal choices. Importantly, 12.1% of our usable sample is currently using a GLP-1 medication, which is consistent with growing prevalence reported by Hristakeva et al. (Reference Hristakeva, Liaukonyte and Feler2026) and a 12.4% usage rate among U.S. adults through October 2025 (Witters and James, Reference Witters and James2025).
MDM participant and meal characteristic relative frequencies
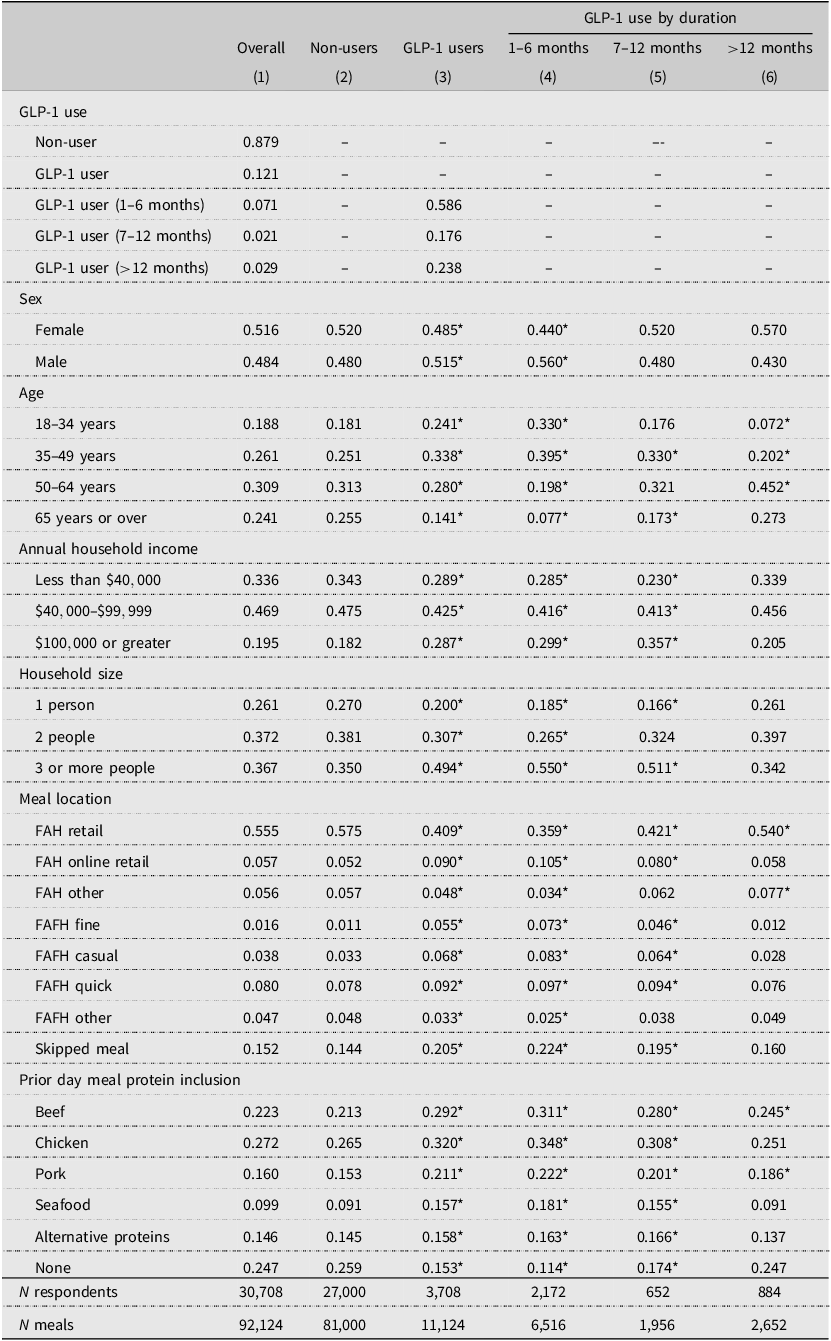
Table 1. Long description
The table presents data on 30,708 participants over the age of 18, detailing their meal choices and sociodemographic information. It includes columns for overall data, non-users, GLP-1 users, and GLP-1 use by duration (1-6 months, 7-12 months, over 12 months). The table is divided into several sections: GLP-1 use, sex, age, annual household income, household size, meal location, and prior day meal protein inclusion. Each section lists relative frequencies for different categories. For example, under GLP-1 use, the table shows 87.9% non-users and 12.1% GLP-1 users. The sex section shows 51.6% females and 48.4% males overall. Age groups range from 18-34 years to 65 years or over, with varying percentages. Annual household income is categorized into less than $40,000, $40,000-$99,999, and $100,000 or greater. Household size includes 1 person, 2 people, and 3 or more people. Meal locations are divided into categories like FAH retail, FAH online retail, FAH other, FAFH fine, FAFH casual, FAFH quick, FAFH other, skipped meal, and prior day meal protein inclusion, which includes beef, chicken, pork, seafood, alternative proteins, and none. The table provides a comprehensive overview of the participants’ characteristics and meal choices.
Note: Asterisks (*) in columns 3 through 6 indicate that the estimate is statistically different from “Non-users” (column 2) at the five percent level or lower using two-proportions z-tests. We use a Bonferroni correction for 26 between-group comparisons. Shares of meals including each protein source will not sum to one because multiple proteins can be consumed in a single meal.
We see stark differences in the sociodemographic composition of the GLP-1 user (column 3) and non-user (column 2) groups. Relative to non-users, GLP-1 users are more frequently male (52%), under the age of 50 (58%), earning at least $100,000 in annual household income (29%), and belonging to households of at least three people (49%). Users’ location of meal consumption is also distinctly different from that of non-users’. Importantly, 41% of meals eaten by GLP-1 users are at home and using ingredients purchased in FAH Retail, which compares to 58% of non-users’ meals. Correspondingly, users’ meal location frequency is higher for FAH Online Retail, FAFH Fine, FAFH Casual, and, to a lesser extent, FAFH Quick, relative to non-users’. Additionally, GLP-1 users report skipping a meal at a rate about six percentage points higher than non-users (roughly 21% versus 14%). These differences in meal location extend to protein consumption, with GLP-1 users reporting higher rates of including each protein source in their meals and a lower rate of not consuming protein in a meal by around 11 percentage points relative to non-users.
We also observe differences in sociodemographic characteristics within the GLP-1 user group itself. For instance, individuals who have taken the medications for more than twelve months are more frequently female (57%), while newer users (one to six months) are more frequently male (56%). Similarly, individuals who have used GLP-1 medications for more than twelve months are more frequently over the age of 50 (approximately 73%) and substantially more likely to have annual household incomes below $40,000 (34%), while those who have taken the medications for between one and six months are more frequently under the age of 50 (about 73%) and with annual household incomes above $100,000 (30%).
These differences in characteristics of shorter- and longer-term GLP-1 users may drive consumption decisions. For example, longer-term users (i.e., more than twelve months) more frequently report consuming their meals at home with ingredients purchased in FAH Retail, while shorter-term users (i.e., one to six months) report higher rates of eating from FAH Online Retail, in FAFH Fine, in FAFH Casual, in FAFH Quick, and skipping meals. Shorter-term users also report consuming each protein source in their meals at a relatively higher rate. For instance, individuals who have used GLP-1 medications for one to six months consume beef in 31% of their meals, on average, while individuals who have used the medications for more than twelve months consume beef in 25% of their meals. Overall, longer-term users tend to more closely resemble non-users across observable characteristics than shorter-term users, with the primary exception being age.
Although the MDM survey is designed to approximate U.S. sociodemographic proportions, the resulting sample (as reflected in Table 1) does not perfectly mirror the national population. Importantly, the observed share and composition of GLP-1 users in the sample should not be interpreted as nationally representative prevalence estimates. However, this study does not seek to estimate population-level GLP-1 usage. Rather, the objective is to obtain reliable econometric estimates of differences in meal location and protein inclusion choices across GLP-1 use groups. Further, for weighting purposes, nationally representative sociodemographic profiles of GLP-1 users have not yet been established in related literature, necessitating a focus on within-sample comparisons rather than population inference.
2.2. Choice model
Consistent with prior food outlet choice and meat demand research (Arnold et al., Reference Arnold, Oum and Tigert1983; Dong and Stewart, Reference Dong and Stewart2012; Kyureghian et al., Reference Kyureghian, Nayga and Bhattacharya2013; Lusk and Tonsor, Reference Lusk and Tonsor2016), we analyze consumer choices using a random utility framework (McFadden, Reference McFadden1974). For individual i, the deterministic portion of utility of consuming meal k purchased at outlet j is expressed as: $\eqalign{{{V_{ijk}}} =\; & ({\alpha _j} + {\sigma _j}{d_{ij}}) + {\gamma _j}GL{P_i} \cr & + {\sum\limits_{p = 1}^5 {{\pi _{jp}}} Protei{n_{ikp}} + \sum\limits_{p = 1}^5 {{\tau _{jp}}} (Protei{n_{ikp}} \times GL{P_i})} \cr& + {\sum\limits_{m = 1}^2 {{\delta _{jm}}} Mea{l_{ikm}} + \sum\limits_{w = 1}^6 {{\rho _{jw}}} WkDa{y_{iw}} + \sum\limits_{l = 1}^L {{\theta _{jl}}} {Z_{il}};{\mkern 2mu} {d_{ij}}\,\sim N(0{{,}}1),}\cr}$
where α j and σ j are the mean and standard deviation, respectively, of the marginal utility of consuming a meal in FAH Retail, FAH Online Retail, FAH Other, FAFH Fine, FAFH Casual, FAFH Quick, and FAFH Other (with skipping a meal normalized to zero for identification purposes), and d ij is the standard normal deviate. These collectively form alternative-specific constants (ASCs) that capture preferences for each location arising from all factors not explicitly incorporated into the model (e.g., pre-treatment health focus, convenience, etc.). ASCs are normally distributed to allow outlet-specific marginal utilities to be either negative or positive relative to the normalized alternative, similar to Taylor and Villas-Boas (Reference Taylor and Villas-Boas2016).
GLP i is a binary indicator equal to one if an individual is currently using a GLP-1 medication and zero otherwise. In this application, GLP i is included as a segmentation variable that allows preferences for meal location to differ between GLP-1 users and non-users through the parameters γ j .Footnote 1 Importantly, we do not interpret GLP i as a causal determinant of food outlet choice. GLP-1 use is a self-selected behavior that is likely correlated with underlying factors such as health concerns, income, and GLP-1-related behavioral adjustments that also influence meal decisions. Accordingly, our objective is not to identify causal effects of GLP-1 use, but rather to document differences in meal location choices between users and non-users that are relevant for industry decision makers. The MDM data also precludes distinguishing GLP-1 use by purpose (i.e., weight management versus diabetes treatment), and thus the estimates reflect overall differences across users irrespective of use motivation.
The subscript p indexes beef, chicken, pork, seafood, and alternative proteins and Protein ikp is then a vector of binary variables that are equal to one if individual i consumes protein source p in meal k and equal to zero otherwise. This specification allows us to document how preferences for protein types vary both within and across food outlets, though we do not imply that protein inclusion itself determines outlet choice. Further, the MDM grouping of prior day protein inclusion by animal source maintains variation in nutritional and behavioral distinctions as consumers have views on protein quality and healthfulness that vary across animal species (Font-i Furnols and Guerrero, Reference Font-i Furnols and Guerrero2014; Szendrő et al., Reference Szendrő, Dalle Zotte, Fülöp, Garamvölgyi and Tóth2024). Importantly, protein inclusion in a meal impacts utility through the parameters π jp for non-users and through the parameters π jp and τ jp for users (via protein inclusion and GLP-1 use interaction terms), allowing preferences to vary between groups. Further, the vector of binary protein inclusion variables, Protein ikp , are overlapping in the sense that MDM participants can report consuming multiple protein items in a single meal. Thus, the estimates of π jp and τ jp are interpreted relative to not consuming any protein source.
Meal m is a vector of binary variables indicating if a meal was lunch or dinner (with breakfast being the default, dropped level). Meal occasion is fundamental in determining where to consume a meal (Marshall and Bell, Reference Marshall and Bell2003) and should be controlled for to ensure that outlet marginal utilities do not reflect within-day temporal confounding. These binary indicators influence utility through the parameters δ jm . Similarly, WkDay w is a vector of binary variables indicating the weekday on which the survey response was recorded (with Saturday as the omitted base category). These variables control for differences in consumption patterns arising from work schedules and potentially greater flexibility on weekends. Survey participation varies moderately across weekdays, with the lowest share of responses observed on Sunday (11.5%) and highest share on Wednesday (17.8%).
Z il is then a vector of characteristics of the individual including age, sex, income, and household size that influence utility through the parameters θ jl . These are correlated with GLP-1 use (see Table 1) and are likely highly predictive of consumers’ meal location choices. Since these consumer traits are observed in the MDM data, we viewed it as appropriate to explicitly control for them.
Equation (1) represents a random parameters logit (RPL) model with outlet-specific constants that are normally and independently distributed. We note that prior assessments of store choice have controlled for a more comprehensive suite of consumer characteristics (e.g., race, vehicle availability). Those efforts have either used reduced form approaches (Dilley et al., Reference Dilley, Adhikari, Silwal, L. Lusk and McFadden2025; Kyureghian et al., Reference Kyureghian, Nayga and Bhattacharya2013), multinomial logit (MNL) modeling (Briesch et al., Reference Briesch, Chintagunta and Fox2009; Dong and Stewart, Reference Dong and Stewart2012; Kyureghian and Nayga, Reference Kyureghian and Nayga2013), or linearized MNL modeling (Taylor and Villas-Boas, Reference Taylor and Villas-Boas2016). The discrete nature of MDM prior day meal reporting and our desire to allow for random taste variation (requiring numerous random coefficients and increased computational demands) make our empirical framework most appropriate but require limiting the included participant characteristic variables to maintain an estimable choice model. Finally, in accordance with our final stated objective, we consider that preferences for meal location and protein may change over the course of GLP-1 use (Circana, 2025b; Ulie, Reference Ulie2025). Using MDM data, we do not observe an individual’s meal choices over an extended period. However, we do observe meal choices made across GLP-1 users that vary in how long they have taken the medications. Thus, we alter Equation (1) by replacing γ
j
GLP
i
with $\sum _{d=1}^3\gamma _{jd}Duration_{id}$
, where Duration
id
is a vector of binary variables that indicate if individual i has used GLP-1 medications for between one and six months, between seven and twelve months, or for over one year (with being a non-user the default, dropped level).Footnote
2
This allows the utility obtained from consuming a meal in a specific food outlet to vary across different durations of GLP-1 use. We also replace GLP
i
with Duration
id
in the protein inclusion and GLP-1 use interaction terms to allow the utility received from the respective protein sources to likewise vary across duration of GLP-1 use.
$\sum _{d=1}^3\gamma _{jd}Duration_{id}$
, where Duration
id
is a vector of binary variables that indicate if individual i has used GLP-1 medications for between one and six months, between seven and twelve months, or for over one year (with being a non-user the default, dropped level).Footnote
2
This allows the utility obtained from consuming a meal in a specific food outlet to vary across different durations of GLP-1 use. We also replace GLP
i
with Duration
id
in the protein inclusion and GLP-1 use interaction terms to allow the utility received from the respective protein sources to likewise vary across duration of GLP-1 use.
Estimation of the RPL model is conducted using simulated maximum likelihood (Train, Reference Train2009) and via the Apollo package in R version 4.4.1 (Hess and Palma, Reference Hess and Palma2019). We use 750 individual-specific Modified Latin Hypercube Sampling draws to avoid correlation patterns that arise in Halton sequences in higher-dimension integration [such as this study that considers seven random parameters] (Hess et al., Reference Hess, Train and Polak2006). These draws have been shown to outperform various Halton sequences in up to a 16-dimensional RPL design and at a number of draws as few as 50. Starting values of parameters are obtained from first-stage multinomial logit (MNL) modeling to aid in convergence.
2.3. Economic measures
Because choice probabilities from an RPL model cannot be computed in closed form, we estimate them using simulation following Train (Reference Train2009). The procedure is as follows: i) draw values of β from the estimated parameter distribution f(β∣θ), where β denotes the parameters and θ denotes the estimated distributional moments; ii) calculate the logit probability using each draw [see Train (Reference Train2009) for formulas]; iii) repeat this process many times; and iv) average the resulting probabilities across draws. In this study, we use 1,000 draws from the standard normal distribution for d ij in Equation (1). For each consumer group, data are held at group means, choice probabilities are simulated separately, and group differences are then computed from those simulated values.
Marginal utilities are constructed in a similar way. We again use 1,000 simulation draws to average over heterogeneity in preferences and obtain the ASCs. In this context, ASC j represents a non-user’s marginal utility of consuming a meal from outlet j without any protein included, relative to skipping the meal. We then form linear combinations of the ASCs, GLP-1 use parameters, and protein parameters to obtain the marginal utility of meals that include a specific protein source. For example, ASC j + γ j + π jp + τ jp is the marginal utility of a GLP-1 user consuming a meal from outlet j that includes protein source p, relative to skipping the meal. Higher values of π jp + τ jp imply that outlet j becomes more attractive when protein source p is included for a user. If π j1 + τ j1 > π j2 + τ j2, then protein source 1 contributes more to utility in outlet j than protein source 2, and is therefore more preferred within that outlet for a GLP-1 user.
To construct these utility measures, data are again held at group means. In doing so, all observed covariates (including meal occasion, weekday indicators, and participant characteristics) enter utility through the ASCs as shifters evaluated at their mean values within each consumer group. The protein indicator of interest is then set equal to one while the remaining protein indicators are set to zero. This approach allows us to isolate the contribution of each protein source to utility and to calculate marginal utilities separately by consumer group and protein type.
2.4. Variance estimation
In RPL models, uncertainty arises from both parameter estimation and individual preference heterogeneity. To account for both sources of variation, we follow Hensher and Greene (Reference Hensher and Greene2003), Rigby and Burton (Reference Rigby and Burton2005), and Tonsor et al. (Reference Tonsor, Schroeder, Pennings and Mintert2009) using a two-stage simulation procedure.
First, we draw 1,000 vectors of parameter estimates using a Krinsky and Robb (Reference Krinsky and Robb1986) resampling procedure. Second, for each parameter draw, we compute the economic measures described in the previous subsection using simulation over heterogeneous preferences. Specifically, we take 1,000 draws of the random parameters [based on α j and σ j from Equation (1)] and use these to calculate choice probabilities, marginal utilities, and between-group differences.
This procedure yields one set of simulated economic measures for each Krinsky-Robb draw. Collectively, these form an empirical distribution of 1,000 values for each measure. The reported point estimates are the means of these distributions, and the associated 95% confidence intervals are constructed from their empirical percentiles. These results are reported throughout the remainder of the study.
2.5. Estimation considerations and sensitivity analysis
Two important estimation considerations are made: i) omitted outlet-level price data and ii) household and store location endogeneity. First, prices are an important consideration when determining both where to purchase a meal and what type of protein to include in it, if any. Taylor and Villas-Boas (Reference Taylor and Villas-Boas2016) justify missing price data by noting that as long as outlet type j always has higher (or lower) prices than outlet type k, then time-invariant differences in prices will be captured by the outlet-specific constants.
In our application, as long as GLP-1 user and non-user groups experience the same relative prices between outlets (e.g., fine dining prices are always higher than physical retail prices for both groups), then the relative ordering of utilities between groups is unaffected by missing prices. Within FAH decision making, we can reasonably assume that purchasing ingredients in physical retail is less expensive than in online retail (which usually entails shipping costs), and purchasing ingredients in online retail is less expensive than in the “FAH Other” category that includes meal preparation purchases (which entail costs associated with shipping and value-added activities). We can also reasonably assume that FAFH purchases are more expensive than FAH and, within FAFH decision making, fine dining is more expensive than casual dining, and casual dining is more expensive than fast casual and quick service dining.
Further, regarding omitted protein prices, which are unobserved by the researchers given the nature of the MDM meal reporting, to the extent that GLP-1 user and non-user groups experience the same relative prices between protein sources in outlet j (e.g., they both experience higher prices for beef products than pork products in fine dining), then our conclusions regarding relative ordering of utilities between groups likewise do not depend on prices of the respective protein sources. We have no reason to believe that relative prices between protein sources within a specific outlet would differ systematically across GLP-1 users and non-users. However, estimated utility measures should be interpreted as reflecting the joint price and non-price attributes associated with each protein source.
Second, the food store choice literature has widely acknowledged the endogeneity of household and store locations (Cuffey and Beatty, Reference Cuffey and Beatty2022; Currie et al., Reference Currie, DellaVigna, Moretti and Pathania2010; Kyureghian et al., Reference Kyureghian, Nayga and Bhattacharya2013; Taylor and Villas-Boas, Reference Taylor and Villas-Boas2016). Food retailers and restaurants make decisions on where to locate stores based on population characteristics, while households make decisions on where to live based on the available food amenities. Kyureghian and Nayga (Reference Kyureghian and Nayga2013) note the challenge in finding valid instruments and elect instead to use lagged values of the retail environment. Currie et al. (Reference Currie, DellaVigna, Moretti and Pathania2010) take a different approach, leveraging detailed geographic and household data and finding no evidence of endogenous store placement when examining small distances. Subsequent research draws from their efforts by controlling for a large variety of household and food environment characteristics (Taylor and Villas-Boas, Reference Taylor and Villas-Boas2016) or assuming that, within a small geographic space, store placement decisions are due to factors uncorrelated with the characteristics of nearby households (Cuffey and Beatty, Reference Cuffey and Beatty2022).
Unlike data used in prior, related studies, MDM survey data does not include information on participants’ food shopping environments. Additionally, U.S. Census Bureau County Business Patterns data utilized by Kyureghian et al. (Reference Kyureghian, Nayga and Bhattacharya2013) and Kyureghian and Nayga (Reference Kyureghian and Nayga2013) was not available for the 2024–2025 period at the time of writing. To address concerns of household and store location endogeneity, we consider two alternatives. First, we follow related work by including county-level population density as a proxy for physical distance between households and stores in Equation (1) (Dong and Stewart, Reference Dong and Stewart2012; Taylor and Villas-Boas, Reference Taylor and Villas-Boas2016; Volpe et al., Reference Volpe, Okrent and Leibtag2013). MDM participants’ self-reported ZIP codes are mapped to counties using U.S. Department of Housing and Urban Development (2025) crosswalk files. Then, county-level population densities are constructed by dividing U.S. Census Bureau (2025) estimates for population by land area (in square miles).
We also consider that participants may live in either urban or rural areas and have differing access to certain food outlets (Kyureghian et al., Reference Kyureghian, Nayga and Bhattacharya2013; Taylor and Villas-Boas, Reference Taylor and Villas-Boas2016). Specifically, we use Rural-Urban Continuum Codes from the U.S. Department of Agriculture Economic Research Service (2025) to identify which participants live in counties in metropolitan areas of at least 1 million people. We then estimate Equation (1) using only survey data obtained from these participants. Here, we argue that i) individuals living in metropolitan areas have ample access to all food store types (in terms of distance from and density of outlets) and ii) firms have ample access to consumers regardless of store location decision. Thus, the potential for bias due to household and store location endogeneity is minimized.
3. Results
A series of likelihood ratio tests compares three specifications: i) an MNL model with controls, ii) an MNL model with controls and population density, and iii) an RPL model with controls and population density (Appendix Table A1). The RPL specification is preferred and discussed hereinafter. Coefficient estimates from the RPL models are reported in Appendix Table A2.
3.1. Food outlet preferences and choice probabilities
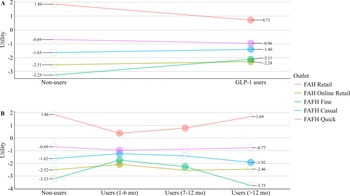
Figure 1 presents the marginal utility estimates for each food outlet alternative. Utility in logit models is identified only up to a normalization, so individual coefficients do not have an absolute interpretation and are instead meaningful in relative terms. Accordingly, emphasis is placed on the ordering of preferences across alternatives and the direction of associations with GLP-1 use, rather than on the magnitude of individual coefficients. Marginal utility estimates are derived at the means of the data within each consumer group, consistent with the approach described earlier in the manuscript.
Food outlet marginal utilities by GLP-1 user group.
Note: Filled in circles indicate estimates for GLP-1 users that are statistically different than non-users at the five percent level or lower. Marginal utilities are constructed via Train (Reference Train2009) and significance is assessed using Krinsky and Robb (Reference Krinsky and Robb1986) resampling. Data are held at the means within each subgroup.

Our sample uniformly ranks meals consumed at home with ingredients purchased in physical retail (FAH Retail) as yielding the highest utility relative to all other outlet options and skipping a meal (normalized to zero and not depicted). This pattern holds across GLP-1 users and non-users, as well as across durations of use. For example, in the pooled specification (Panel A), the marginal utility of FAH Retail is 1.86 for non-users and 0.71 for users. In contrast, all other FAH and FAFH outlets exhibit negative marginal utilities relative to the outside option, as indicated by consistently negative estimates.Footnote 3 Across subsamples, FAH Online Retail and FAFH Fine consistently rank among the lowest-utility options, while FAFH Casual and FAFH Quick hold intermediate positions in the preference ordering.
In comparison to related work, Taylor and Villas-Boas (Reference Taylor and Villas-Boas2016) find positive marginal utility for supermarkets and superstores compared to free-food events, lower but still positive marginal utility for fast food purchases, and negative marginal utility for other FAH outlets and sit-down FAFH dining among low-income and SNAP-participating households. Our findings are consistent with this ordering of preferences, although FAFH Quick (which includes both fast casual and quick service dining) exhibits negative marginal utility in our sample, likely reflecting differences in the two assessments’ normalized food outlet alternative (i.e., the outside option).
Focusing on Panel A, notable differences between GLP-1 users and non-users emerge for FAH Retail and FAFH Fine. GLP-1 users derive substantially lower utility from FAH Retail than non-users (0.71 versus 1.86), while exhibiting higher (i.e., less negative) utility for FAFH Fine. Despite these differences, the overall preference ordering is largely similar across groups, with FAH Online Retail and FAFH Fine switching positions near the bottom of the ranking.
Panel B of Figure 1 provides additional insight by duration of GLP-1 use. Differences in marginal utilities are generally larger for shorter-term users (one to six months) than for longer-term users (at least one year). That is, shorter-term users deviate more from non-users, whereas longer-term users exhibit estimates that are closer to, and generally not statistically different from, those of non-users. For instance, shorter-term users have a marginal utility for FAH Retail that is 1.48 lower than that of non-users (1.86 − 0.38), while longer-term users exhibit similar utility (1.69 versus 1.86, not statistically different). However, the longer-term group reports substantially fewer FAFH Fine and FAFH Casual meals (Table 1), reducing statistical power and increasing uncertainty for those estimates.
Overall, while the relative ordering of outlet preferences is stable across groups (with minor differences at the lower end), preference differences are more pronounced among recent GLP-1 adopters than among longer-term users. These results pertain to modeled meal frequencies and do not necessarily extend to quantities consumed or expenditures. Further, differences in marginal utilities should not be interpreted as causal or dynamic effects of GLP-1 use. Instead, individuals with longer durations of use differ in underlying sociodemographic characteristics, which in turn likely influence purchasing behavior.
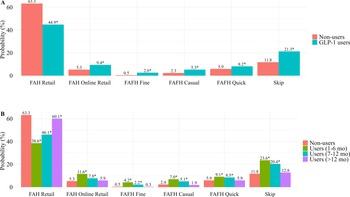
Food outlet choice probabilities are derived following Train (Reference Train2009) and are presented in Figure 2, providing additional insight into differences in meal location decisions between GLP-1 users and non-users. Data are evaluated at subgroup means, as income and other sociodemographic characteristics differ substantially by GLP-1 use status (see Table 1). As shown in Panel A of Figure 2, non-users exhibit the highest probability of consuming FAH Retail meals (63.3%), whereas GLP-1 users exhibit a significantly lower probability (44.9%). Correspondingly, the lower probability of FAH Retail consumption among GLP-1 users is associated with higher probabilities of skipping a meal (21.3%) or consuming in FAH Online Retail (9.4%), FAFH Fine (2.6%), FAFH Casual (5.3%), or FAFH Quick (8.2%) relative to non-users.
Food outlet choice probabilities by GLP-1 user group.
Note: Asterisks (*) indicate estimates for GLP-1 users that are statistically different from non-users at the five percent level or lower. Choice probabilities are constructed via Train (Reference Train2009) and significance is assessed using Krinsky and Robb (Reference Krinsky and Robb1986) resampling. Data are held at the means within each subgroup.
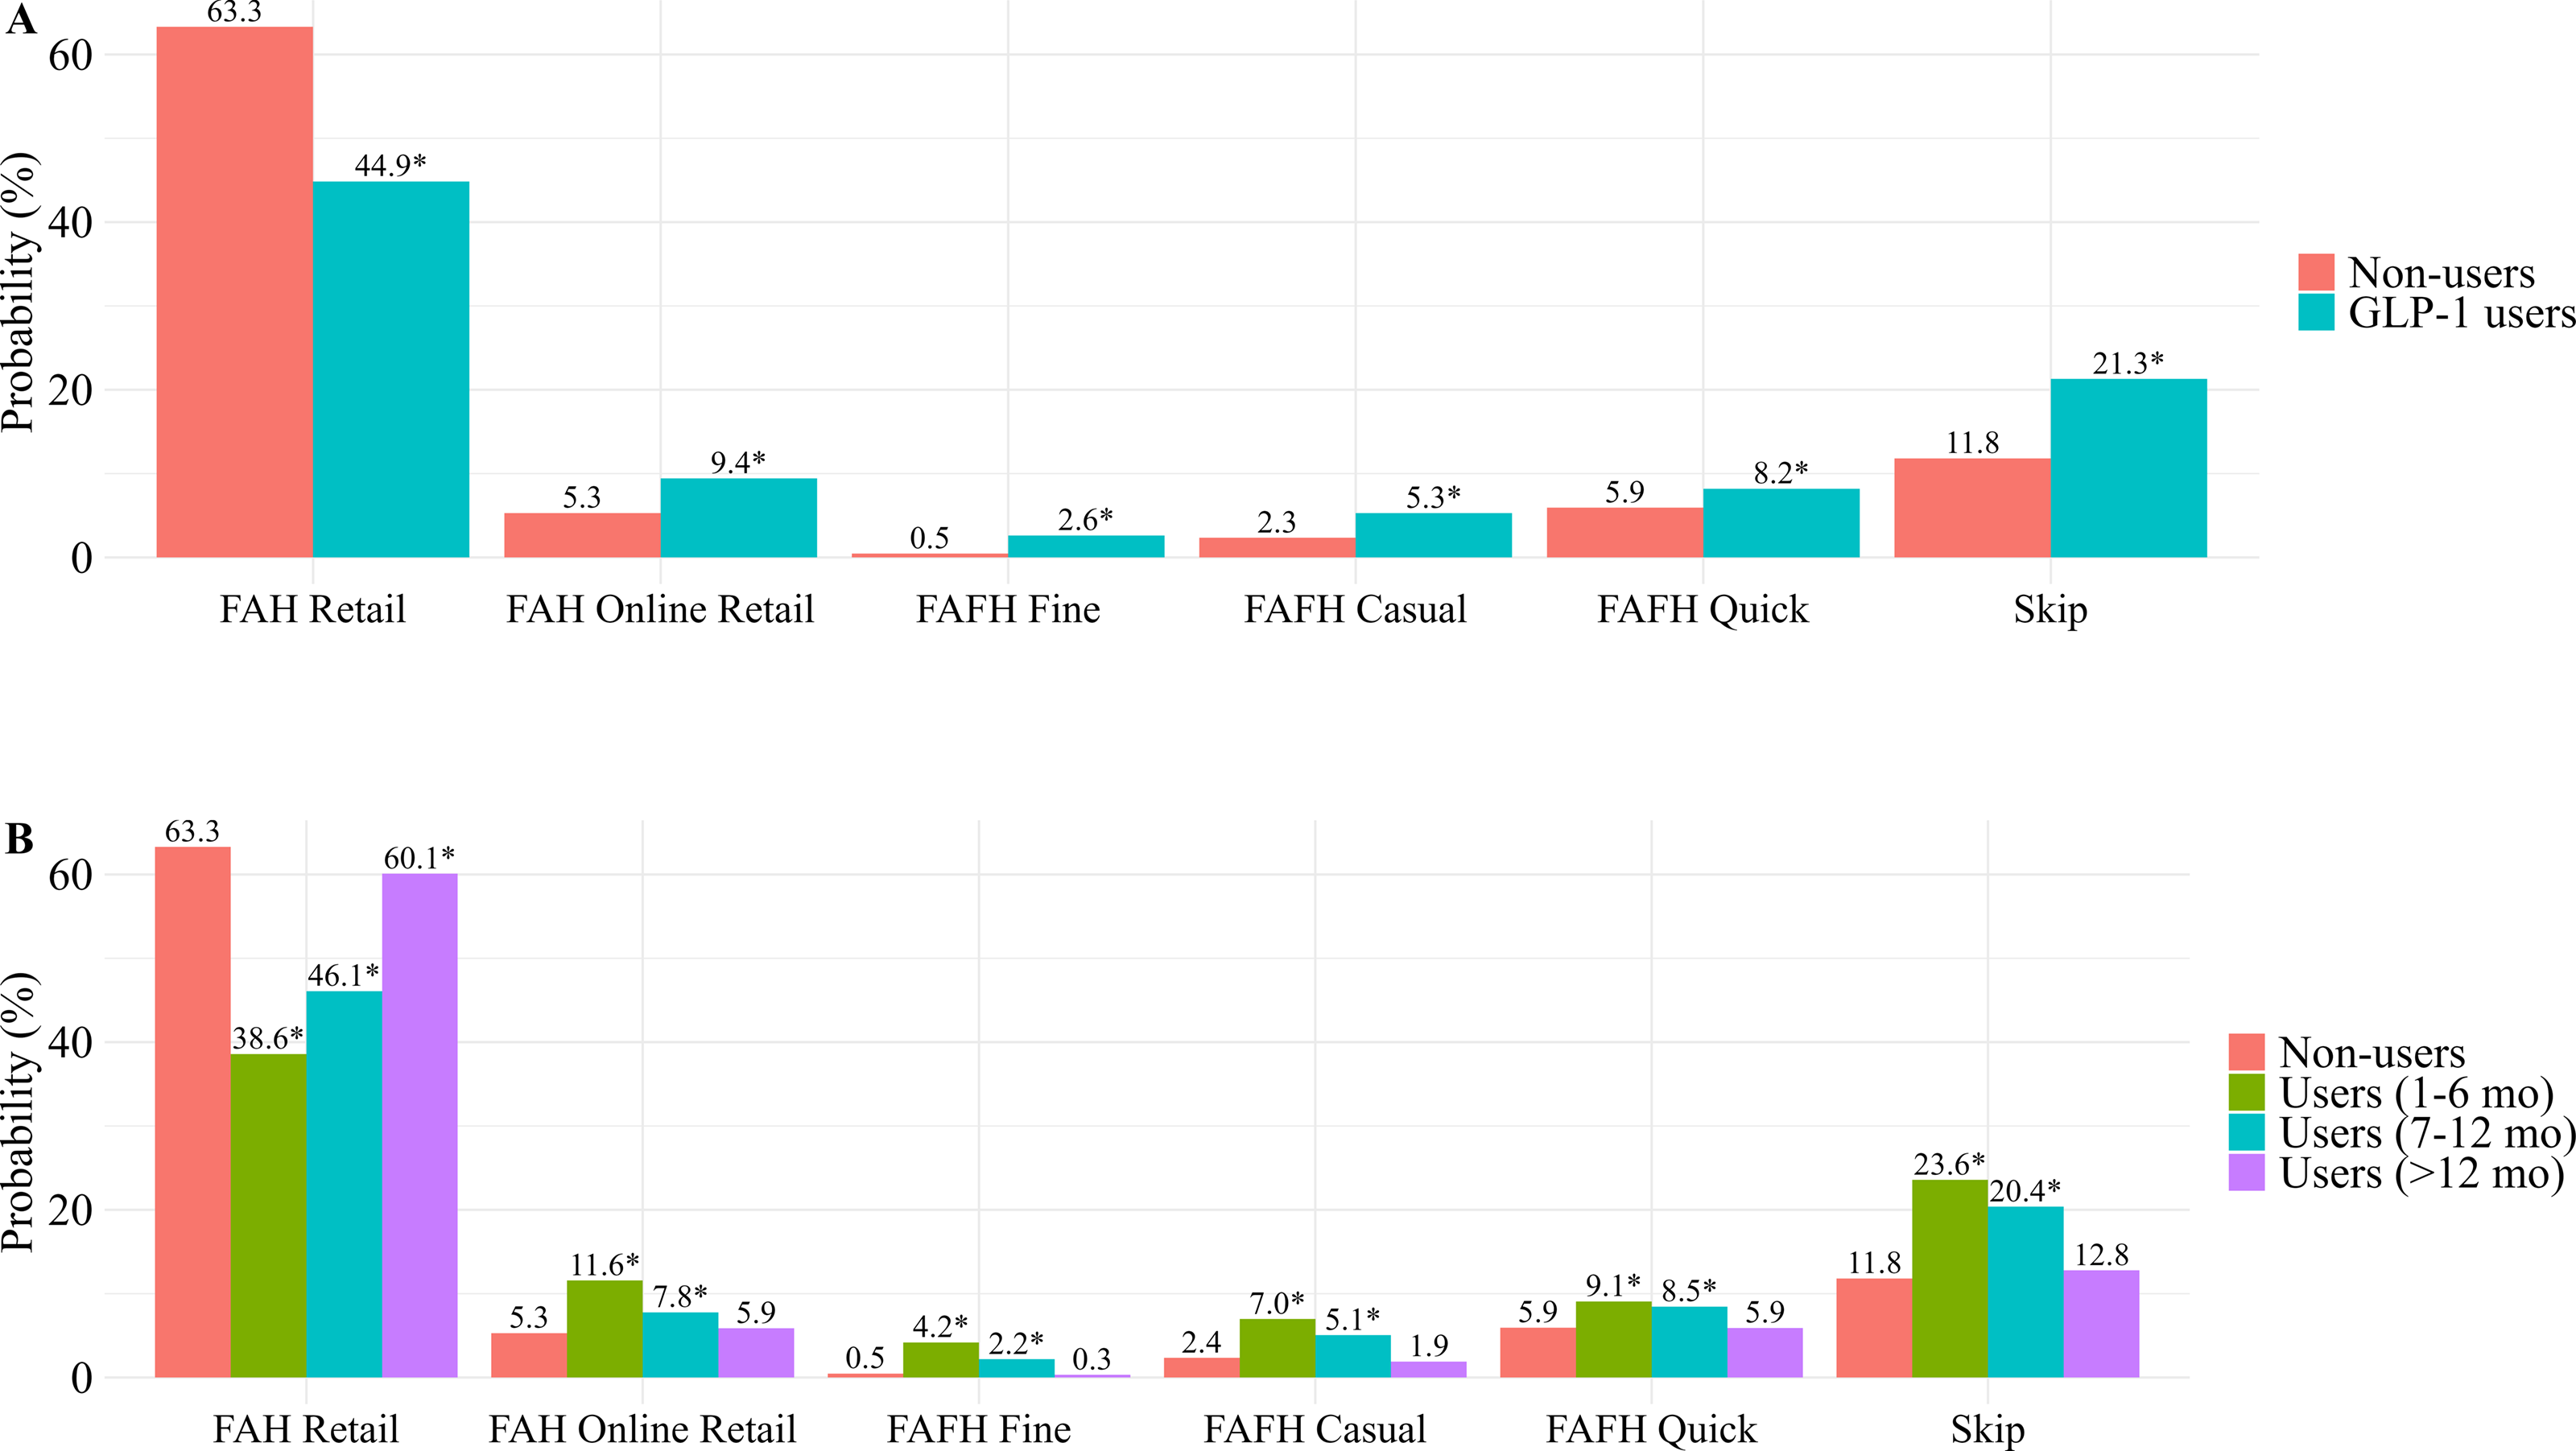
Consistent with earlier results, differences are larger between non-users and shorter-term users than between non-users and longer-term users (Panel B of Figure 2). For example, simulated probabilities of FAH Retail meal sourcing are 38.6% for shorter-term users, 46.1% for intermediate-term users, and 60.1% for longer-term users, compared to 63.3% among non-users. With the exception of FAH Retail, the choice probabilities of longer-term users are not statistically different from those of non-users, whereas those of shorter-term users are.
As a sensitivity check for potential endogeneity in store and household location decisions, we re-estimated the choice models using only respondents from counties in metropolitan areas of at least 1 million people, as discussed previously. The resulting choice probabilities are similar in magnitude to the primary estimates (Appendix Figure A1), and the conclusions regarding differences between consumer groups remain unchanged. In addition to this sensitivity assessment, we also report meal-specific (i.e., breakfast, lunch, and dinner) choice probabilities in Appendix Figures A5 through A7 for those interested in intraday variation in choices.
3.2. Within outlet protein preferences
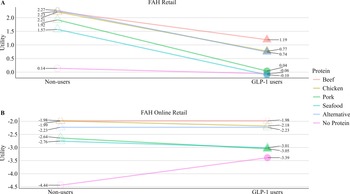
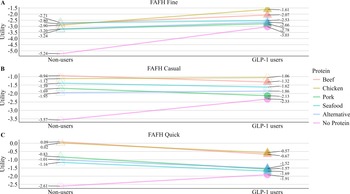
We next examine heterogeneity in preferences for protein inclusion. Appendix Table A3 reports a complete set of marginal utilities by food outlet type, protein inclusion, and GLP-1 use status. For ease of interpretation, we visualize the FAH and FAFH marginal utilities in Figures 3 and 4, respectively. Marginal utility estimates are derived at the means of the data within each consumer group, except the protein indicator of interest, which is set equal to one while the remaining protein indicators are set to zero.
FAH outlet and protein inclusion marginal utility estimates by GLP-1 user group.
Note: Filled in symbols indicate marginal utility that is statistically different from non-users at the five percent level or lower. Triangles (circles) indicate marginal utility from protein inclusion that is (not) statistically different from no protein inclusion at the five percent level or lower. Marginal utilities are constructed via Train (Reference Train2009) and significance is assessed using Krinsky and Robb (Reference Krinsky and Robb1986) resampling. Data are held at the means within each subgroup, varying only the protein inclusion indicators.
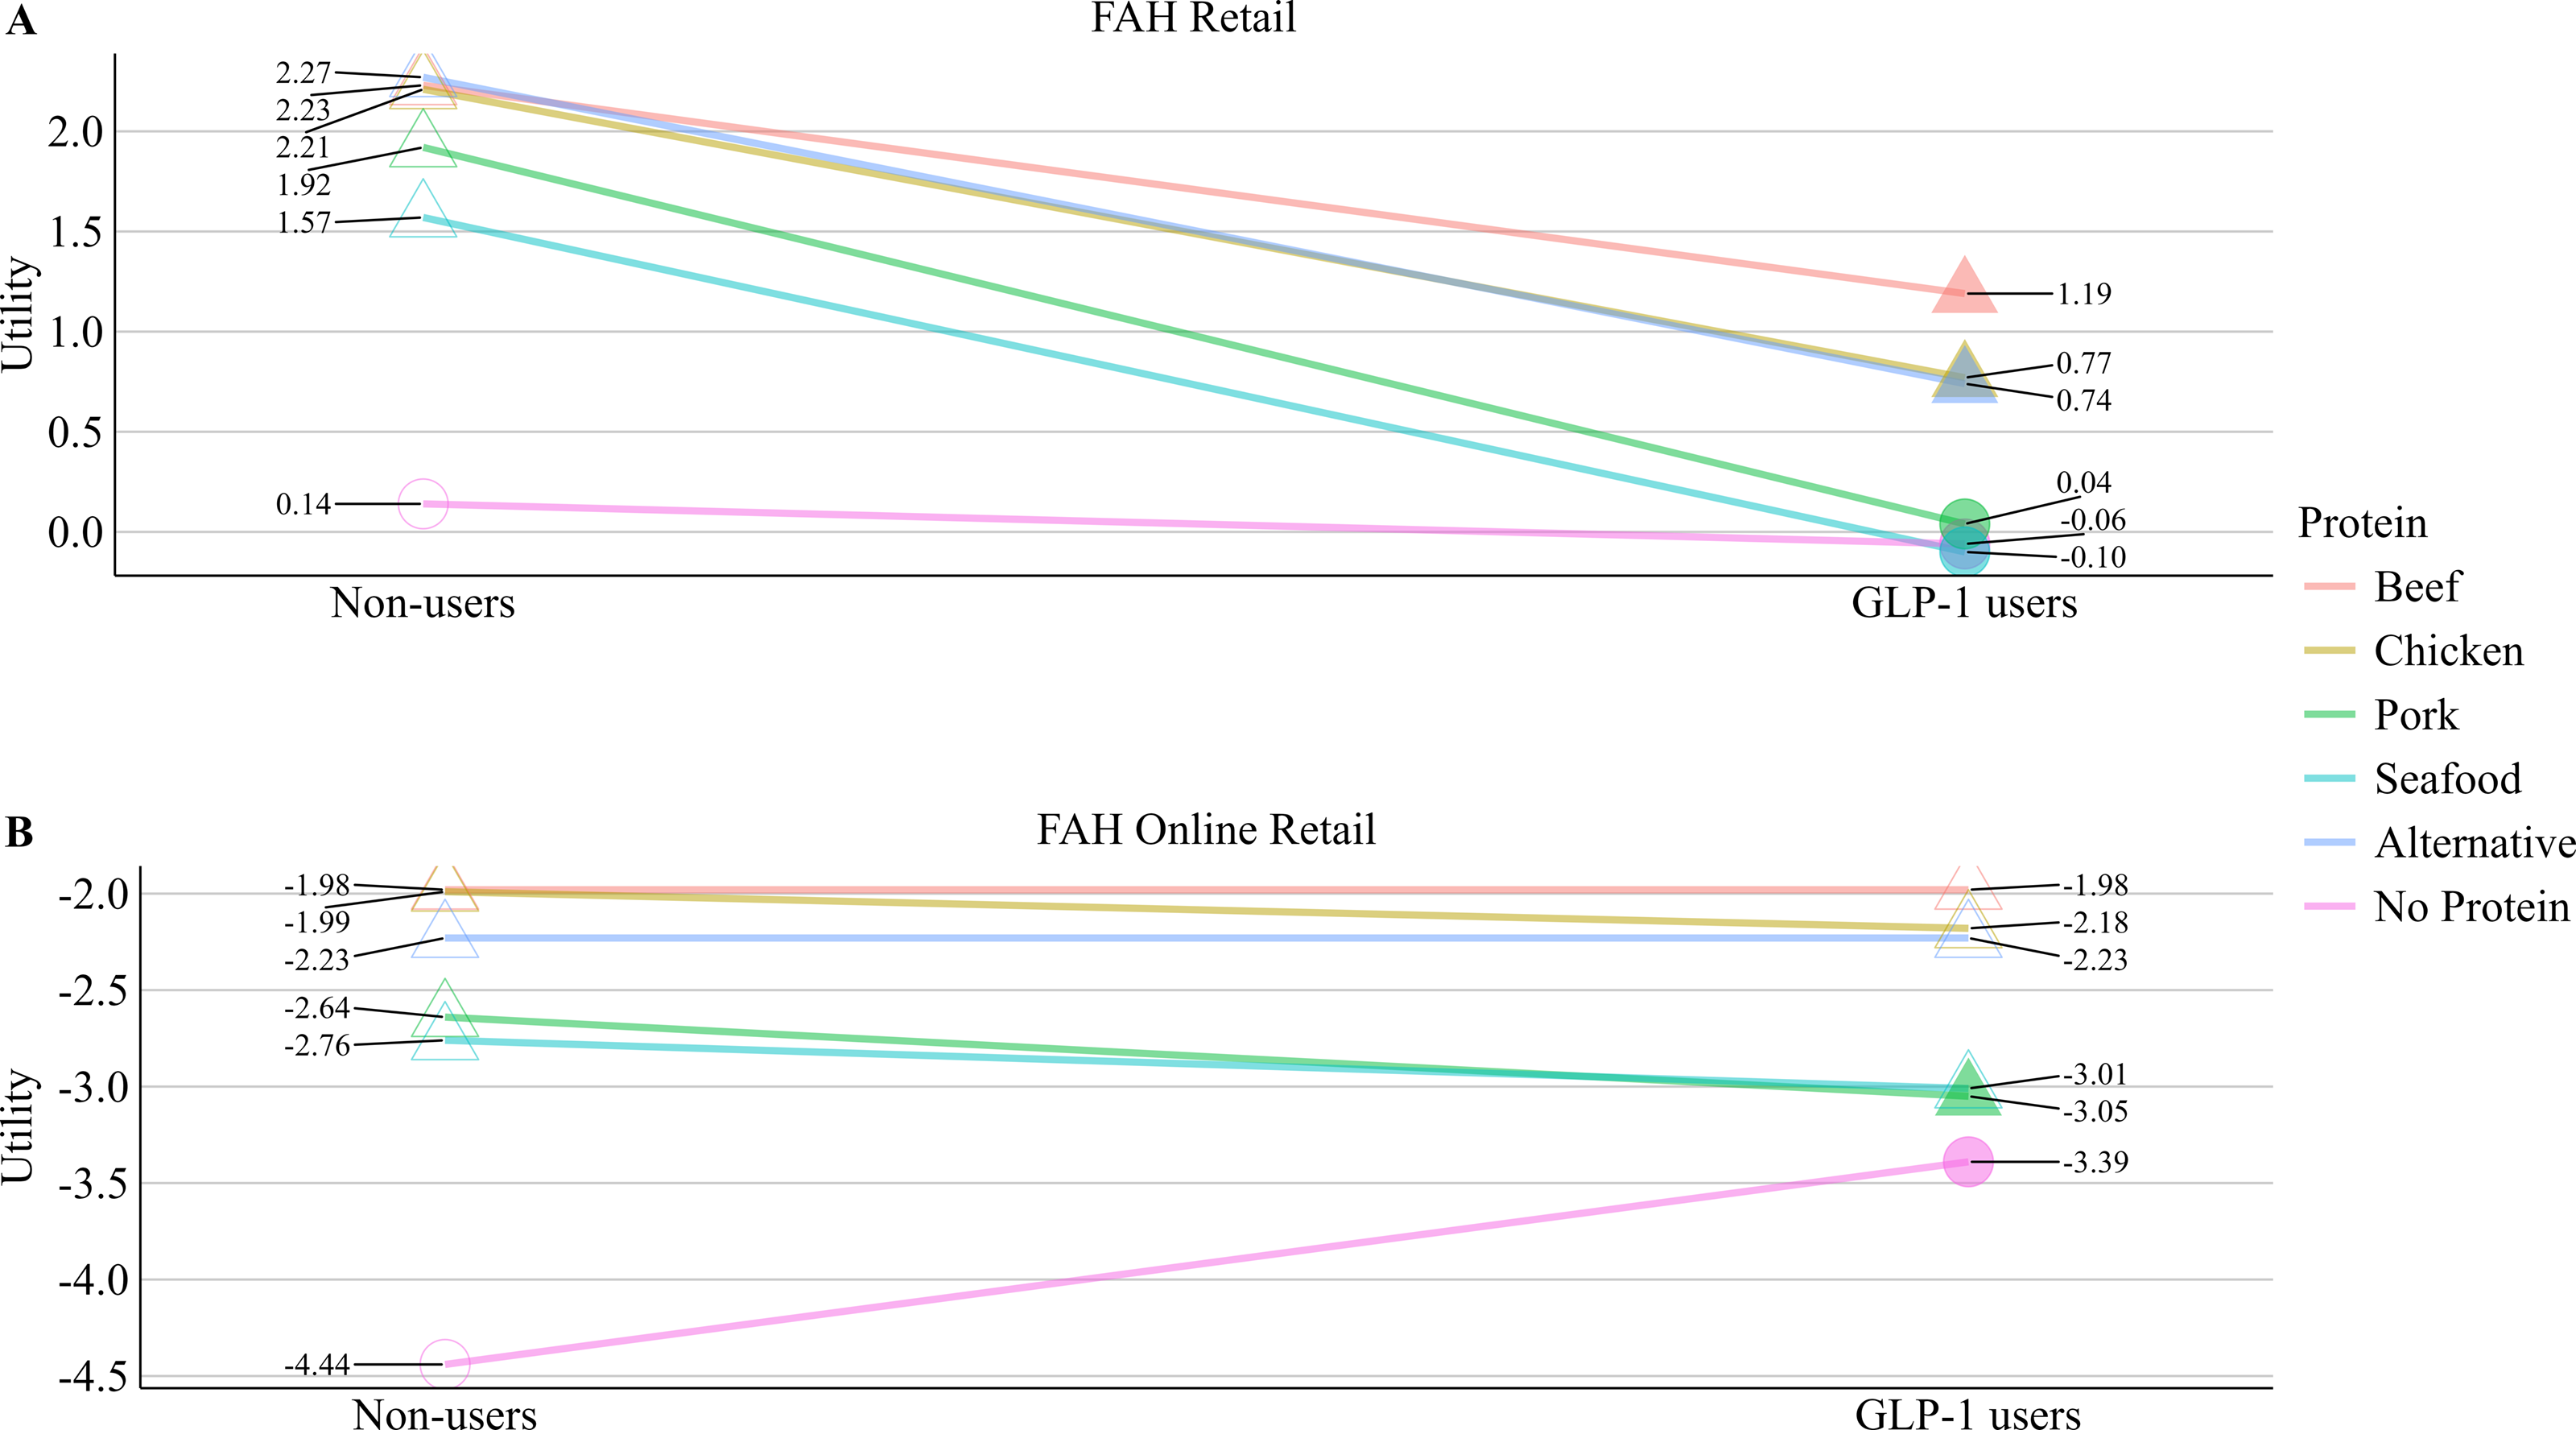
Figure 3. Long description
Panel A: A line graph titled FAH Retail shows the utility of different protein sources for non-users and GLP-1 users. The x-axis represents user groups (Non-users and GLP-1 users), and the y-axis represents utility. The graph includes lines for beef, chicken, pork, seafood, alternative, and no protein. Non-users have higher utility for all protein sources compared to GLP-1 users, with beef having the highest utility for non-users and no protein having the lowest utility for GLP-1 users. Panel B: A line graph titled FAH Online Retail shows the utility of different protein sources for non-users and GLP-1 users. The x-axis represents user groups (Non-users and GLP-1 users), and the y-axis represents utility. The graph includes lines for beef, chicken, pork, seafood, alternative, and no protein. Non-users have higher utility for all protein sources compared to GLP-1 users, with beef having the highest utility for non-users and no protein having the lowest utility for GLP-1 users.
FAFH outlet and protein inclusion marginal utility estimates by GLP-1 user group.
Note: Filled in symbols indicate marginal utility that is statistically different from non-users at the five percent level or lower. Triangles (circles) indicate marginal utility from protein inclusion that is (not) statistically different from no protein inclusion at the five percent level or lower. Marginal utilities are constructed via Train (Reference Train2009) and significance is assessed using Krinsky and Robb (Reference Krinsky and Robb1986) resampling. Data are held at the means within each subgroup, varying only the protein inclusion indicators.

In both Figures 3 and 4, we observe that non-users uniformly prefer to include some source of protein in their meals relative to not consuming protein. This result is consistent across protein sources and all food outlet types. In contrast, GLP-1 users exhibit a less consistent pattern. While they generally prefer including beef, chicken, and alternative proteins relative to no protein across most outlets, this preference does not extend uniformly to pork and seafood. In particular, GLP-1 users do not exhibit a statistically significant preference for including pork or seafood in FAH Retail meals relative to no protein, or a preference for seafood in FAFH Casual, indicating weaker or absent utility gains from including these protein types in these settings.
Turning to preference orderings, GLP-1 users and non-users exhibit broadly similar rankings. From Panel A of Figure 3, both groups most prefer beef, chicken, and alternative proteins, followed by pork and seafood, with no protein least preferred in physical retail. However, for GLP-1 users, there is no statistical difference between pork or seafood and no protein in FAH Retail, indicating that these protein sources do not provide a meaningful improvement over meals without protein in this setting. These patterns are broadly consistent with FAH Online Retail (Panel B), although an important distinction emerges in that, for GLP-1 users, pork and seafood are statistically preferred to no protein in the online retail channel.
A key difference across consumer groups is that, in FAH Retail, the utility gains from including protein are consistently smaller for GLP-1 users than for non-users. In contrast, this pattern is not uniform in FAH Online Retail, where differences between groups are less consistent.
Now focusing on FAFH settings (Figure 4), preference orderings are again broadly similar between GLP-1 users and non-users. Across these dine-out outlets, both groups generally rank beef and chicken as the most preferred protein options; followed by pork, seafood, and alternative proteins; followed by no protein being consistently least preferred. Thus, while protein inclusion remains desirable for both groups when eating away from home, the relative ranking shifts slightly compared to FAH settings, with alternative proteins no longer among the higher-utility options.
Despite these similarities in ordering, differences emerge in the utility obtained from protein inclusion across FAFH outlet types. In particular, GLP-1 users tend to experience relatively larger utility gains from including protein in FAFH Fine dining (Panel A of Figure 4), whereas these gains are comparatively smaller in FAFH Quick settings (Panel C), relative to the utility gains observed for non-users. This suggests that, although protein remains an important driver of preferences when eating out, the extent to which it increases utility for GLP-1 users depends on the dining context.
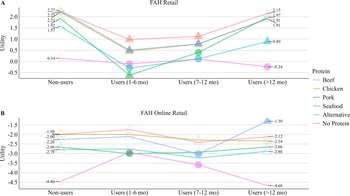
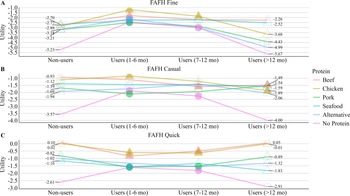
Beyond the results reported in Figures 3 and 4, additional differences in the marginal utilities of food outlets and protein inclusion emerge across the duration of GLP-1 use. These patterns are visualized for FAH and FAFH in Figures 5 and 6, respectively. It is important to interpret these results in the context of the underlying data. Certain subgroups report consumption of specific protein sources within particular food outlets relatively infrequently, leading to imprecise estimates of marginal utility. We are most confident in the FAH Retail results, as this is the most commonly reported meal location across all consumer groups. Accordingly, we focus our discussion on this setting (Panel A of Figure 5), while still reporting marginal utilities across all outlets and protein types for completeness.
FAH outlet and protein inclusion marginal utility estimates by GLP-1 duration.
Note: Filled in symbols indicate marginal utility that is statistically different from non-users at the five percent level or lower. Triangles (circles) indicate marginal utility from protein inclusion that is (not) statistically different from no protein inclusion at the five percent level or lower. Marginal utilities are constructed via Train (Reference Train2009) and significance is assessed using Krinsky and Robb (Reference Krinsky and Robb1986) resampling. Data are held at the means within each subgroup, varying only the protein inclusion indicators.
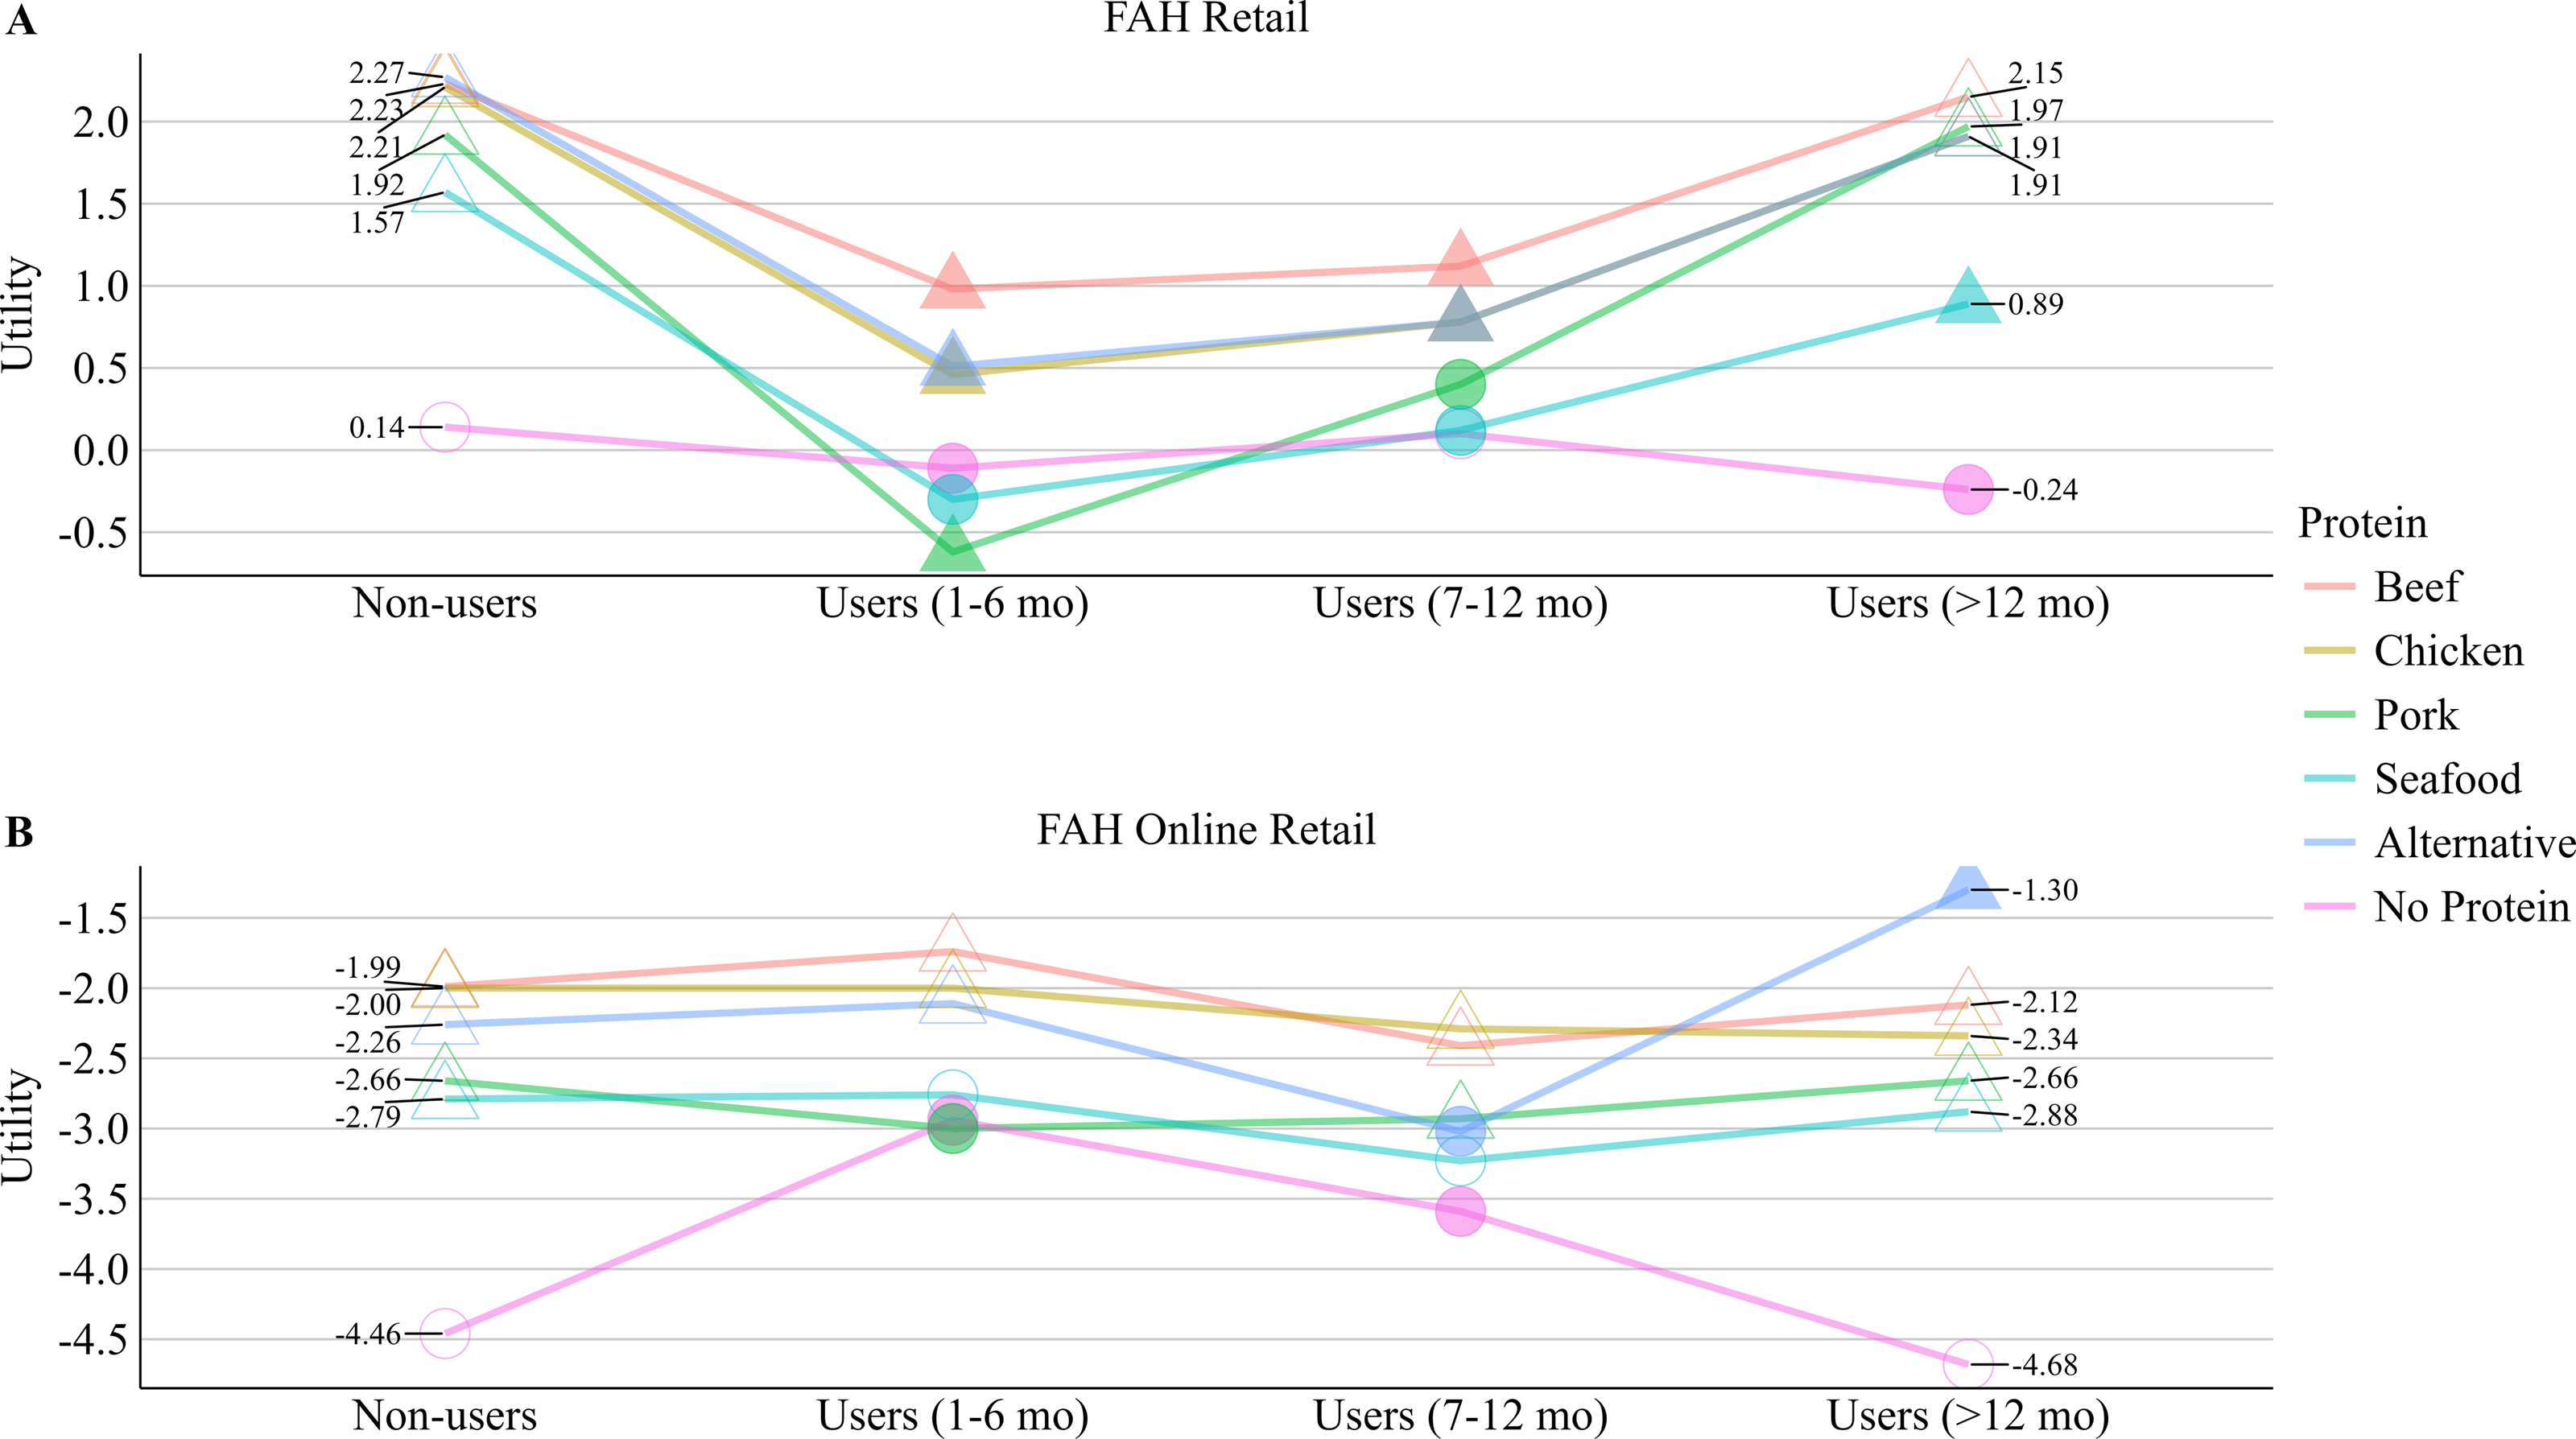
Figure 5. Long description
Panel A: The line graph titled FAH Retail shows the marginal utility estimates for different protein sources over varying durations of GLP-1 use. The x-axis represents user duration categories: Non-users, Users (1-6 mo), Users (7-12 mo), and Users (>12 mo). The y-axis represents utility values. The graph includes lines for different protein types: Beef, Chicken, Pork, Seafood, Alternative, and No Protein. Each line shows how utility changes across different user durations. For example, the utility for Beef starts high among non-users, decreases among short-term users, and increases again among long-term users. Panel B: The line graph titled FAH Online Retail shows the marginal utility estimates for the same protein sources but for online retail. The x-axis and y-axis are the same as in Panel A. The utility values for online retail are generally lower compared to retail. For instance, the utility for No Protein is the lowest across all user durations.
FAFH outlet and protein inclusion marginal utility estimates by GLP-1 duration.
Note: Filled in symbols indicate marginal utility that is statistically different from non-users at the five percent level or lower. Triangles (circles) indicate marginal utility from protein inclusion that is (not) statistically different from no protein inclusion at the five percent level or lower. Marginal utilities are constructed via Train (Reference Train2009) and significance is assessed using Krinsky and Robb (Reference Krinsky and Robb1986) resampling. Data are held at the means within each subgroup, varying only the protein inclusion indicators.
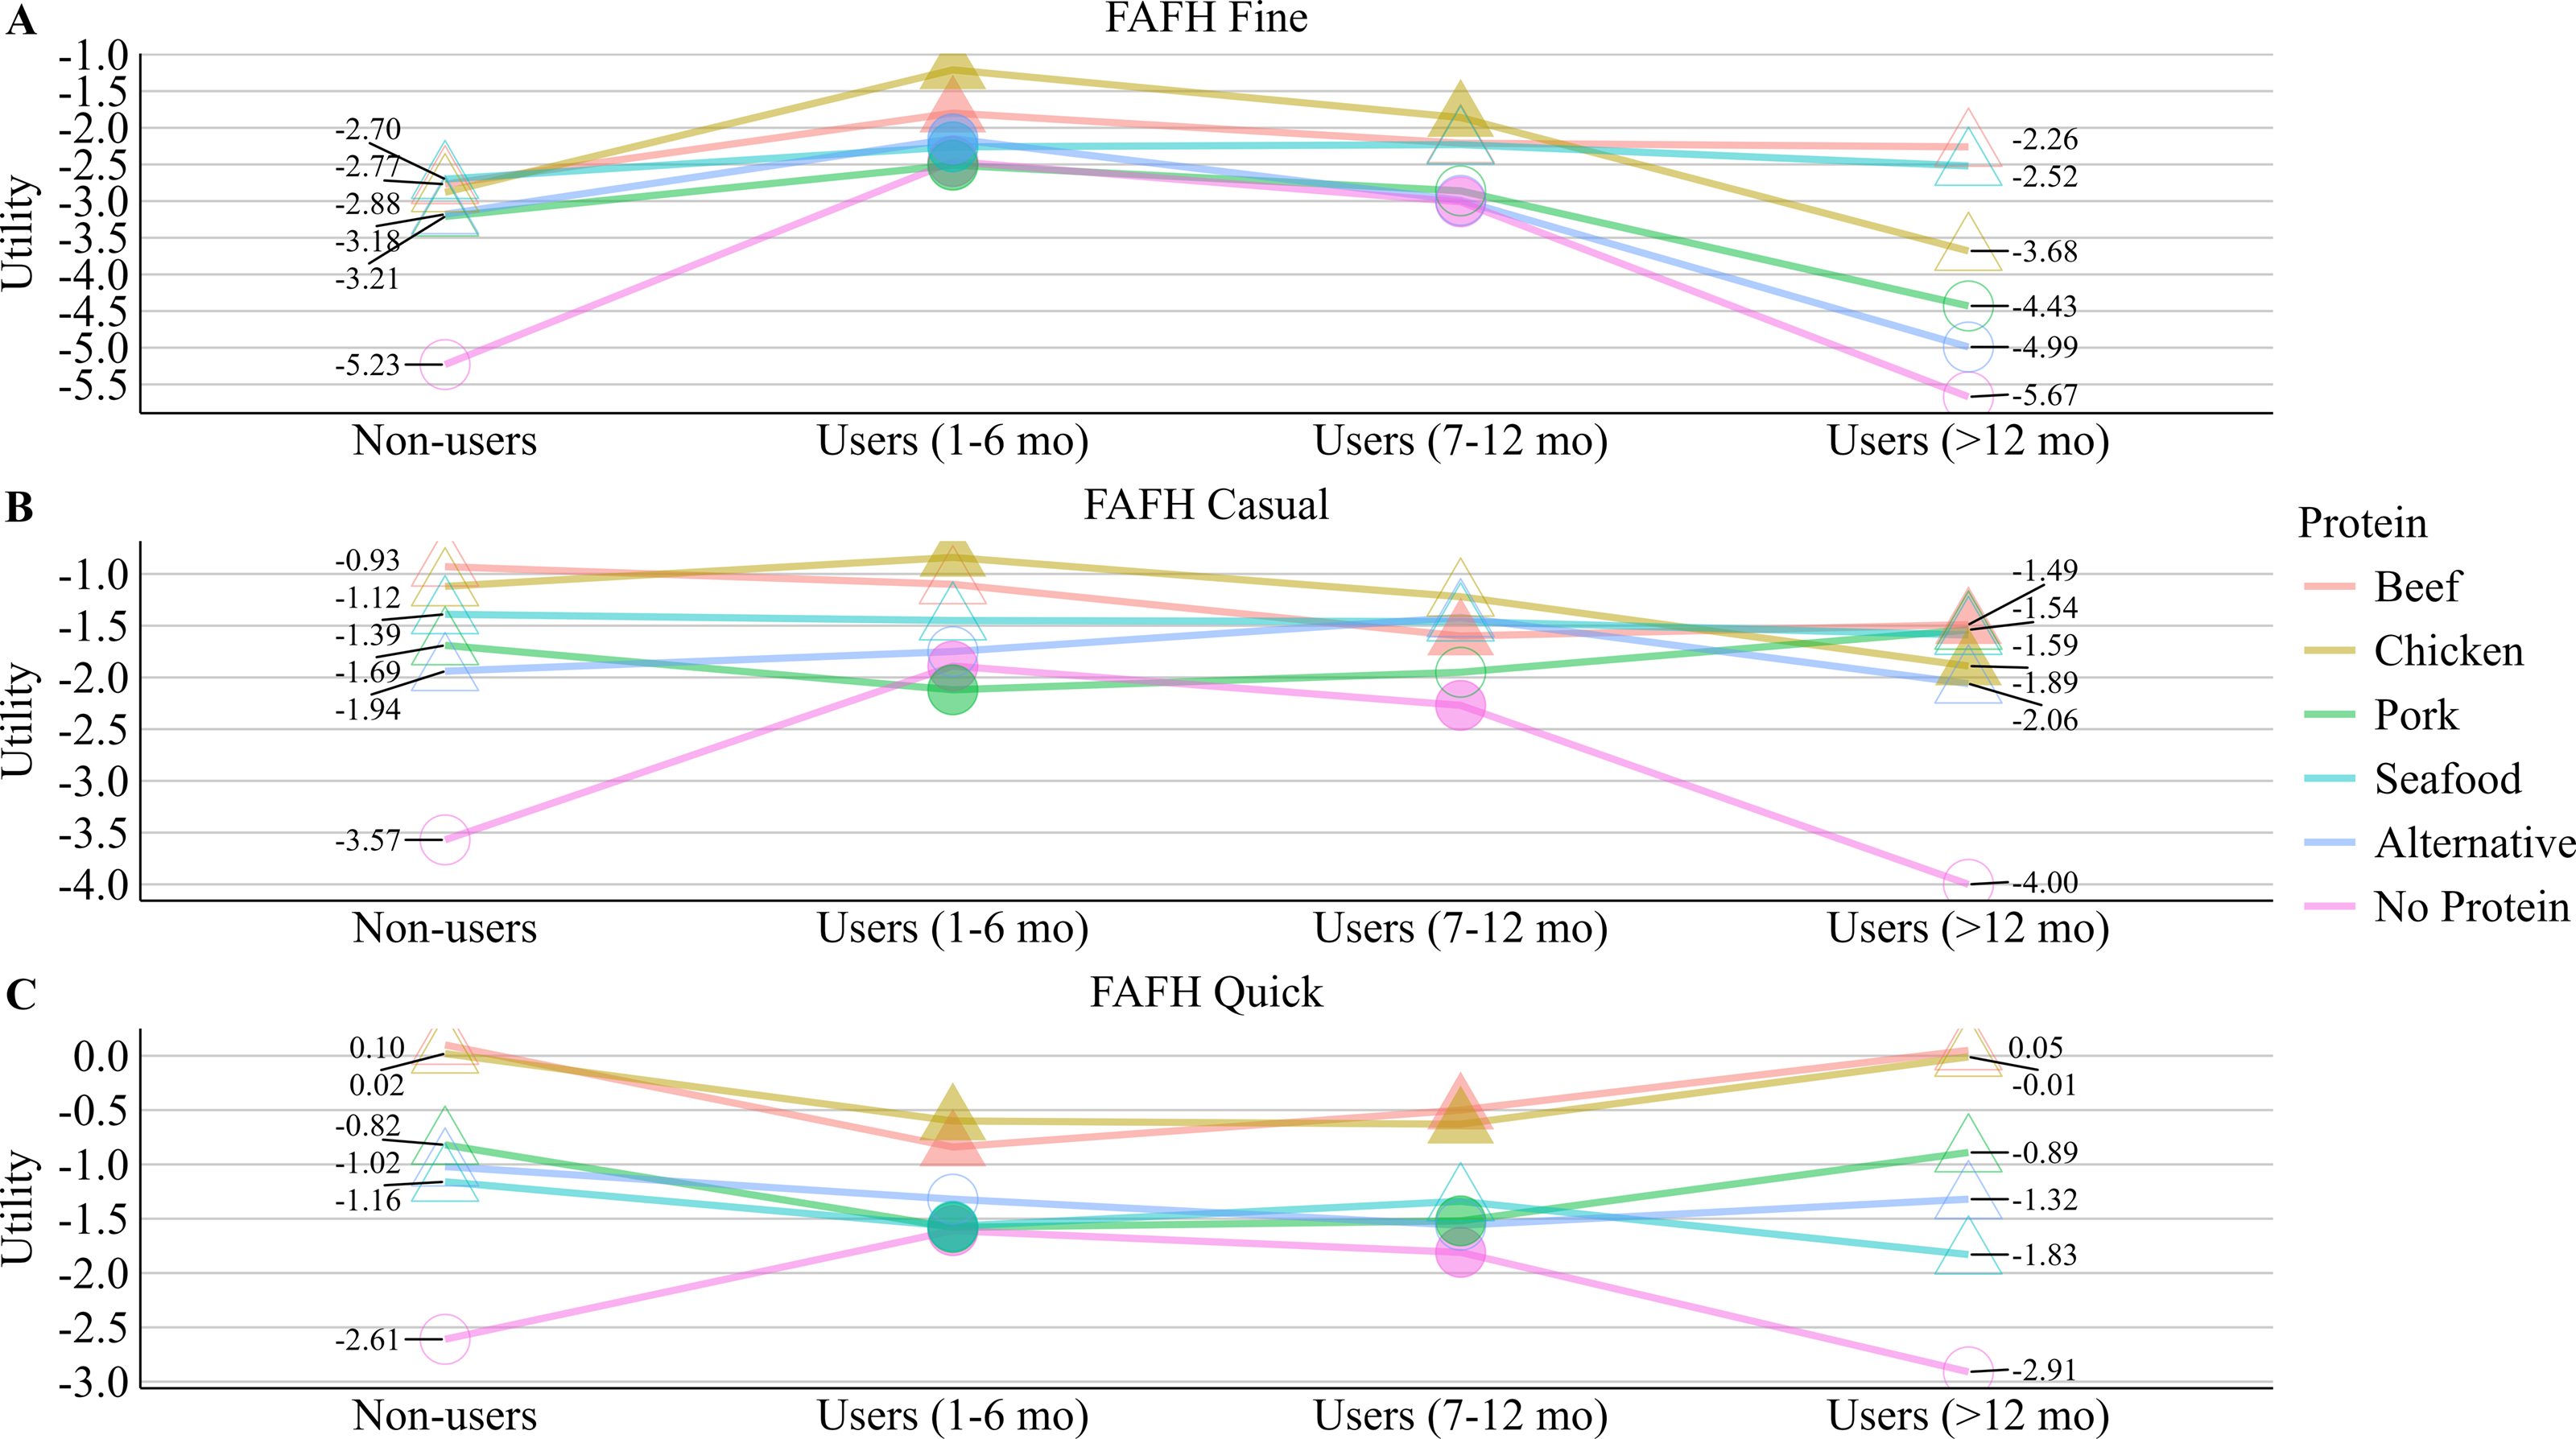
Figure 6. Long description
Three line graphs depict the marginal utility estimates for different food away from home (FAFH) outlets and protein sources by duration of GLP-1 use. Panel A: The line graph titled FAFH Fine shows the utility estimates for non-users, users (1-6 months), users (7-12 months), and users (>12 months) across different protein sources. The x-axis represents the duration of GLP-1 use, and the y-axis represents utility. The protein sources include beef, chicken, pork, seafood, alternative, and no protein, each represented by different colored lines. Panel B: The line graph titled FAFH Casual shows similar data for casual dining. The x-axis and y-axis are the same as in Panel A. Panel C: The line graph titled FAFH Quick shows the utility estimates for quick service dining. The x-axis and y-axis are the same as in the previous panels. Each graph shows how utility estimates vary across different protein sources and durations of GLP-1 use.
Relative to non-users, individuals using GLP-1 medications for one to six months exhibit statistically lower marginal utility from FAH Retail meals that include any protein source. Further, the marginal utility these consumers derive from pork and seafood is either lower than, or not statistically different from, that of meals without protein. Among longer-term users (i.e., at least twelve months), however, marginal utilities for beef, chicken, pork, and alternative proteins are similar to those of non-users, while utility for seafood remains lower, though more positive than that observed among shorter-term users.
Overall, these results indicate that GLP-1 use status and duration of use are associated with differences in preferences for food outlets and protein inclusion, with the largest differences observed among individuals reporting more recent use. Importantly, however, relative preference orderings (i.e., the rankings of protein sources) are largely consistent across GLP-1 use status and duration within each outlet. One notable exception is among shorter-term users in FAH Retail, who exhibit a lessened preference for pork and seafood, with utilities that are lower or not statistically different from no protein. In practice, this likely translates into fewer instances of choosing these protein options in physical retail settings. These protein preference findings are largely robust to the metropolitan-only sensitivity analysis, which we depict in Appendix Figures A2 through A4.
Importantly, these patterns should not be interpreted as within-person changes over time, but rather as differences across groups that vary by reported duration of GLP-1 use. That is, these findings may indicate a reversion in preferences to pre-treatment levels as GLP-1 users’ duration of use lengthens (to the extent that a causal link can be established), though that is purely speculative given the cross-sectional and descriptive nature of this study. More appropriately, the observed variation in preferences across consumer groups (mainly in magnitude rather than relative ranking) likely reflects both GLP-1-related behavioral changes and underlying sociodemographic differences between shorter-term users, longer-term users, and non-users.
4. Discussion
This study examines associations between GLP-1 medication use, meal location choices, and protein preferences using publicly available recall data. We find that GLP-1 users differ from non-users in their sociodemographic characteristics, food outlet selections, and preferences for certain protein sources, with additional heterogeneity observed across reported duration of use. Importantly, these results describe differences across groups rather than within-person changes over time or causal influences and should be interpreted accordingly. Still, the observed patterns offer several insights that are salient to food system researchers and industry decision makers.
First, GLP-1 use is associated with a lower probability of sourcing meals from physical retail and a higher probability of sourcing meals from online retail, away-from-home outlets, or skipping meals entirely. Notably, the association between GLP-1 use and meal location choice appears strongest among individuals reporting shorter durations of use, while longer-term users’ patterns more closely resemble those of non-users. This heterogeneity highlights the importance of accounting for duration of use when evaluating how GLP-1 adoption coincides with food outlet patronage and extends the emerging literature that has largely treated GLP-1 users as a homogeneous group.
Further, these findings align with broader industry and empirical evidence documenting shifts in food purchasing behavior among GLP-1 users, including reductions in grocery spending, altered category demand, and increased attention to protein-focused offerings (Circana, 2024, 2025a, 2025b; Hristakeva et al., Reference Hristakeva, Liaukonyte and Feler2026). Recent responses among food retailers and restaurants, including high-protein offerings, smaller portion sizes, and labeling changes (Chipotle Mexican Grill, Inc., 2025; Conagra Brands, Inc., 2024; Naidu, Reference Naidu2024; Nestlé, 2024), suggest that the U.S. food industry is already adapting product assortments and menus to evolving protein demand across food outlets. The simulated choice probabilities presented here highlight the food outlets with relatively high probabilities of patronage among GLP-1 users, indicating where GLP-1-focused marketing and product positioning may be most visible and effective. In particular, these patterns suggest greater opportunities in away-from-home settings and online retail (relative to non-users), especially among shorter-term users. Further, differences between GLP-1 users’ and non-users’ meal sourcing behavior indicate that traditional marketing strategies, if based on status quo assumptions derived from non-user behavior, may not be as effective when targeting GLP-1 users.
Extending this discussion, the contrast between pronounced differences among shorter-term users and marked similarities between non-users and longer-term users may reflect either temporary behavioral adjustments following GLP-1 adoption (and a reversion in preferences over time) or underlying sociodemographic differences between early-stage and longer-term users. If the former interpretation holds, GLP-1 medications may pose a short-run risk to physical food retailers while creating temporary opportunities for online retailers and foodservice, potentially through higher-margin, protein-dense offerings. To that point, there is some industry research backing the assertion that GLP-1 users’ preferences do, in fact, change throughout the duration of treatment (Circana, 2025b; Ulie, Reference Ulie2025). Alternatively, if the observed differences among shorter-term users reflect underlying consumer traits rather than temporary behavioral adjustments, then these patterns are likely to persist even as duration of use increases, implying more sustained shifts in food purchasing behavior and associated impacts on the food industry. While our cross-sectional design does not allow us to distinguish between these mechanisms or track within-person changes over time, examining differences across duration-of-use groups remains informative. Specifically, it provides a way to document heterogeneity across GLP-1 users at different stages of use, which is important to interpreting mixed evidence in the existing literature and to understanding how observed consumption patterns may vary across segments of users.
A related and novel insight from this study is the relatively higher probability of meal skipping among GLP-1 users. This finding is consistent with the appetite suppression effects associated with GLP-1 medications and highlights potential adjustments along the “extensive margin” of food consumption. That is, not only may GLP-1 users desire smaller meals, but fewer meals may also be consumed. This pattern may help explain growing industry interest in high-protein snacks and smaller product sizes that align with appetite suppression while maintaining consumer engagement. More broadly, the results emphasize the value of analyzing food choice at the meal level, which captures both outlet decisions across distinct meal occasions and consumption participation, and provides a richer framework for understanding how health-related innovations influence food consumption behavior.
In addition to meal location choices, we document slight differences in preferences for protein inclusion across outlets between GLP-1 users and non-users. While non-users consistently prefer protein inclusion relative to consuming no protein, GLP-1 users exhibit weaker or less consistent preferences for pork and seafood in certain settings. Beef and chicken are consistently among the most preferred protein sources across all outlets and consumer groups, and alternative proteins also rank relatively highly in FAH settings. A notable exception arises in FAH Retail, where GLP-1 users do not exhibit a statistically significant preference for pork or seafood relative to no protein inclusion.
For food retailers and foodservice decision makers, these findings imply that protein-focused menu items and home meals emphasizing the sources of protein we identify as consistently preferred among GLP-1 users (i.e., beef and chicken across outlets, and alternative proteins in FAH settings) may better align with these consumers’ preferences. Further, menu design and product creation or reformulation targeting these protein sources may be an avenue for capturing the higher protein valuations of GLP-1 users documented by Bina et al. (Reference Bina, Tonsor and Richards2026). However, the observed heterogeneity across duration of GLP-1 use cautions against uniform strategies. Segmenting approaches that recognize differences between newer and longer-term GLP-1 users may be more effective than broad, permanent changes to product assortments or menus.
As with all research, this effort comes with its limitations. First, we leverage a long-running record of GLP-1 use, food outlet choices, and protein consumption provided by the MDM survey project at the expense of not observing why a respondent uses GLP-1 medications. External estimates as of July 2024 indicate that, in aggregate, roughly the same share of GLP-1 adopters use the medications for the purpose of treating diabetes as who use the medications strictly for weight management (Hristakeva et al., Reference Hristakeva, Liaukonyte and Feler2026). However, weight-focused users are more commonly under the age of 55 years and with an annual household income of at least $80,000, which suggests that the MDM-derived GLP-1-using sample (which trends younger and higher income; see Table 1) may be primarily weight-focused, especially the shorter-term users (i.e., between one and six months). Regardless, since we cannot ascertain the reason why GLP-1 medications are adopted among the MDM participants, our results reflect an aggregation of preferences among GLP-1 users and describe cross-sectional differences in food outlet and protein choices across users irrespective of use motivation.
Second, in using the MDM data, price information is not available, and thus, economic measures such as willingness-to-pay cannot be informed. However, related work notes that as long as individuals face similar relative prices across outlets, utility estimates remain reliable (Taylor and Villas-Boas, Reference Taylor and Villas-Boas2016). Additionally, protein preferences reflect an aggregation across broad animal source categories, thus masking potential finer distinctions in preferences at the product level. Further research is encouraged to evaluate potential relationships between GLP-1 use and product-level food choices made across outlets.
Expanding on this point, the MDM prior-day recall is structured around primary meals (i.e., breakfast, lunch, and dinner) and does not explicitly capture between-meal snacking or the consumption of dedicated nutrition products such as protein powders or bars. Snacking may be relevant in the context of GLP-1 use and dietary recommendations (Mehrtash et al., Reference Mehrtash, Dushay and Manson2025), and increased reliance on snacking (particularly protein-focused snacks or supplements) may partially substitute for primary meals and contribute to the higher observed rate of meal skipping among GLP-1 users. However, these occasions are less directly tied to the outlet choices that are the focus of this study, as they may not always involve a discrete decision among alternative food outlets in the same way as primary meals. Similarly, protein supplements are not explicitly identified within the MDM instrument and are therefore not separately categorized within the “alternative protein” grouping. This omission of protein supplementation is again not central to our objective of modeling outlet choices across primary meals, though we acknowledge that these issues are increasingly important in the context of GLP-1-related purchasing behavior and warrant consideration in future research.
Last, we emphasize that GLP-1 use in this study is treated as a segmentation variable rather than a causal determinant of food choice. Individuals who adopt GLP-1 medications differ from non-users in both observable and unobservable characteristics that also influence food outlet and protein choices, and our results are therefore descriptive of differences across groups rather than causal effects. While this approach is appropriate for documenting choice patterns relevant to industry decision makers, future research may implement designs that more directly assess causal and dynamic relationships. In particular, panel data that track individuals before and after GLP-1 adoption, or quasi-experimental and experimental strategies that isolate exogenous variation in GLP-1 use, could provide additional insight into how GLP-1 medications influence food purchasing behavior over time.
Despite these limitations, the results provide a timely analysis of how meal sourcing and protein preferences differ across GLP-1 use status and reported duration of use, and thus which food establishments and protein sectors are most impacted. As GLP-1 medications become more prevalent, these findings contribute to a clearer understanding of how food purchasing and consumption patterns vary across segments of the population. While future research using longitudinal data or experimental designs is needed to assess causal mechanisms and dynamic responses, the patterns documented here offer a useful empirical benchmark for researchers and industry decision makers seeking to contextualize ongoing changes in U.S. food markets.
Supplementary material
The supplementary material for this article can be found at https://doi.org/10.1017/aae.2026.10049.
Data availability statement
Data used in the study is publicly available through KState Research and Extension. Code is available from the authors upon request.
Financial support
This research received no specific grant from any funding agency, commercial, or not-for-profit sectors.
Competing interests
Justin D. Bina and Glynn T. Tonsor declare none.


 Open access

