
5.1 IntroductionFootnote 1
Land-based passenger mobility, which is the focus of this chapter, has several special characteristics. First, it is not one system, but multiple systems, which can be distinguished by transport modes and technologies (such as trains, trams, cars, bicycles, and buses) and ownership, including public transport (bus, train, trams) and private transport (cars, bicycles, motorcycles). The various transport modes are associated with specific socio-technical systems that have their own technologies, industries, markets, and user practices. Automobility, bus, and bicycle-systems partly overlap because of shared road infrastructure use (Figure 5.1). Railways and trams have their own dedicated infrastructures.
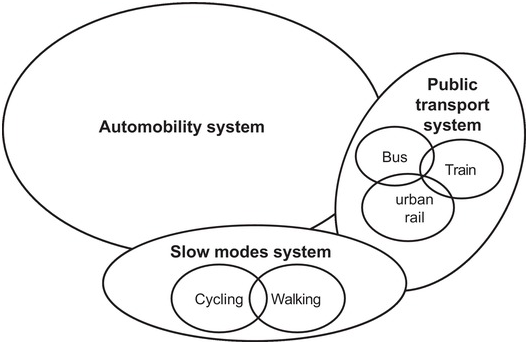
Figure 5.1 Schematic representation of different land-based passenger mobility systems
Second, although multiple systems co-exist, the automobility system is, by far, the largest in England (and most other Western countries), both in terms of passenger kilometres and number of trips (Table 5.1). Rail, bus, and cycling systems are much smaller but have a high degree of stability in underlying actor coalitions, institutionalised rules, and social practices. They should therefore be seen as subaltern systems rather than as niche-innovations (Geels, Reference Geels2012).
Table 5.1. Mode share of trips in passenger kilometres and number of trips in England in 2019 (DfT, 2020a: 2)
| Transport mode | % of passenger kilometres | % of number of trips |
|---|---|---|
| Car/van (driver + passenger) | 77 | 61 |
| Rail | 10 | 2 |
| Bus | 4 | 5 |
| Bicycle | 1 | 2 |
| Walk | 3 | 26 |
| Other (e.g., tram, subway) | 5 | 4 |
Third, the post-war mobility explosion (Figure 5.3) fundamentally transformed society by enabling increasing geographical and spatial dispersion, which deeply embedded cars in social practices. Whereas many families had traditionally lived in the same city or neighbourhood, the post-war mobility explosion enabled friends and families to live further apart, often in different cities. People’s homes also became more spatially separated from where they worked, went to school, shopped, enjoyed leisure activities, and went on holidays. The increasing spatial separation was not only enabled by cars but also made people more dependent on cars to sustain daily life practices, thus creating deep social, spatial, and cultural lock-ins (Urry, Reference Urry2004).
Fourth, land-based passenger mobility systems are infrastructure heavy. Although mobility systems are organised around artefacts (such as cars, trains, buses, bicycles), their use depends on the presence of roads, railways, tunnels, and bridges as well as fuel infrastructures. Infrastructures are thus deeply entwined with the use of artefacts, which gives mobility systems a different architecture than in the electricity system, where grid infrastructures are located between production and use.
Figure 5.2, which schematically portrays the automobility system, illustrates this inter-penetration of road (and fuel) infrastructures and use.

Figure 5.2 Schematic representation of the material elements and flows in the automobility system
Fifth, the spatial spread and density of infrastructures and mobility systems varies substantially. Road infrastructures are spatially very extensive, ranging from a backbone of high-speed motorways to very dispersed minor roads. This enables car drivers to go almost everywhere and reach any human settlement. Although buses (mostly) use the same roads as cars, bus transport services are less evenly spread, having higher frequency in high-density areas for commercial reasons. Rural and sparsely settled regions are therefore not well covered by bus systems, which thus increases car dependency of people living there. Rail systems and services also focus on mobility between high-density locations such as cities, which thus creates gaps in spatial coverage. As a slow transport mode, cycling is mostly used for local, especially urban, transport.
Sixth, automobility is an energy-intensive system, generating greenhouse gas (GHG) emissions directly (through driving cars) and indirectly (because manufacturing cars involves large amounts of energy and metals, while road building uses large amounts of concrete and asphalt). Bus, rail, and cycling systems generate fewer GHG emissions per passenger-kilometre, which is why modal shifts from cars to other transport modes represent one climate mitigation option (although some of the considerations above imply that such modal shifts are not equally feasible for all people everywhere in the country).
The automobility system expanded very rapidly after the Second World War, when people increasingly bought private cars which they used to cover larger distances (Figure 5.3). Overall passenger mobility quadrupled from 218 billion passenger-kilometres in 1952 to 873 billion passenger-kilometres in 2019, while Great Britain’s population increased by 32% in the same period (from 49.05 million to 64.90 million).

Figure 5.3 Domestic passenger mobility (in billion passenger-kilometres) by transport mode, 1952–2019 in Great Britain
In 2020 and 2021, the COVID-19 pandemic strongly affected the use of transport modes (Figure 5.4), because three national lockdowns (March–June 2020, November–December 2020, and January 2021–March 2021) restricted people’s mobility. The shocks were mostly temporary for passenger car use, which rebounded to pre-pandemic levels when restrictions were lifted. Railway and bus travel experienced deeper declines during the lockdowns and rebounded less strongly after re-openings. Bicycle travel, which is discussed in Section 5.5, increased strongly during the first lockdown in 2020 but has since declined.

Figure 5.4 Daily use of transport modes (cars, railways, bus) in Great Britain between March 2020 and July 2021 (excluding the Christmas 2020 break); figures are percentages of an equivalent day or week
Because of our interest in climate mitigation, this chapter focuses on land-based passenger transport modes (passenger cars, buses, railways, cycling), which in 2019 accounted for the majority (59%) of direct, domestic transport-related GHG emissions in the UK (Figure 5.5). Heavy goods and light duty vehicles both accounted for 16% of GHG emissions in 2019. Domestic shipping generated 4.5% of emissions and domestic civil aviation for 1%. The focus on domestic GHG emissions means that international emissions (from aviation and shipping) are not included in our analysis. By 2017, however, these had become quite significant: international aviation generated 35 MtCO2 (roughly 29% of domestic transport-related GHG emissions) and international shipping 7.8 MtCO2 (about 6% of domestic GHG emissions).

Figure 5.5 UK domestic transport-related greenhouse gas emissions 1990–2019, in MtCO2e
Figure 5.5 shows longitudinal trends in total domestic transport-related GHG emissions. Between 1990 and 2007, these emissions gradually increased from 128.1 to 137.5 million tons CO2-equivalent (MtCO2e). Following the financial-economic crisis, emissions decreased by 12.7% to 120 MtCO2e between 2007 and 2013. As economic activity picked up again, emissions increased between 2013 and 2017 to 126.1 MtCO2e. Emissions then decreased somewhat to 122.2 MtCO2e in 2019, and declined by 29% in 2020 because of the COVID-related lockdowns (CCC, 2021). Because this unprecedented decline is likely to be temporary, ‘we can expect a significant rebound in transport emissions’ in 2021 (CCC, 2021: 19). For that reason, our analysis of structural emission trends and underlying drivers goes up to 2019 and excludes 2020. For actors, policies, and some techno-economic developments such as sales, we do, however, include COVID-19 in our analysis.
From their 2007 peak, total domestic transport-related GHG emissions decreased by 11% to 2019. Developments varied for different transport modes.
Emissions from passenger cars, which is the single largest category, decreased by 12% between 2007 and 2019 (from 77.1 MtCO2e to 67.7 MtCO2e). This is a significant decrease considering that passenger car mobility increased by 10% in the same period (Figure 5.3).
Railway emissions remained unchanged between 2007 and 2019 (at 2 MtCO2e), while emissions from domestic aviation decreased (from 2.4 to 1.4 MtCO2e) in the same period.
Emissions from bus/coaches also decreased in the 2007–2019 period (from 4.8 to 3.1 MtCO2e), which is partly due to a 20% decrease in bus passenger mobility in this period (Figure 5.3).
GHG emissions from light duty road freight transport increased by 15% between 1990 and 2019 (from 16.8 MtCO2e to 19.2 MtCO2e), at least partly due to an increase in online shopping and home delivery. Emissions from heavy freight decreased by about 7% in the same period. Because of this chapter’s focus on passenger mobility, these freight-related developments are not further discussed.
Passenger mobility from cars, railways, and buses was 11% higher in 2019 (854 billion passenger-kilometres) than in 2007 (771 billion passenger-kilometres). Nevertheless, combined GHG-emissions from these modes decreased by 14%, from 83.3 MtCO2e in 2007 to 71.8 MtCO2e in 2019 (Figure 5.5). This chapter aims to assess the underlying change processes that caused this reduction, while also analysing other relevant socio-technical developments in passenger mobility systems.
To that end, Sections 5.2, 5.3, 5.4, and 5.5 respectively investigate the main developments in automobility, rail, bus, and cycling systems. For each system, we first analyse techno-economic developments and then actors and institutions.
Section 5.6 analyses six niche-innovations, which are not only seen as having considerable carbon reduction potential but also represent different transition pathways, aimed at changing different parts of mobility systems. Electric vehicles and biofuels are two technological niche-innovations that aim to reduce GHG emissions from cars and buses. Tele-working is a niche-innovation that aims to reduce mobility by removing the need to commute to work. Car sharing and intermodal transport (including smart cards and Mobility-as-a-Service) are two niche-innovations that aim to reduce car ownership and increase intermodal travel. And self-driving personal cars promise to radically alter mobility, reduce accidents, enhance traffic flow efficiency, and thus reduce GHG emissions. The six niche-analyses are also divided into techno-economic developments and actors and institutions, which are, however, more fluid and less articulated than for regimes.
Section 5.7 provides interpretive assessments of low-carbon transition and degrees and kinds of whole system reconfiguration.
5.2 The Auto-Mobility System
5.2.1 Techno-Economic Developments
The automobility system is a large and stable system, centred on a primary artefact: the internal combustion engine (ICE) car. The system’s functioning also relies on a wide-ranging configuration of material components and infrastructures such as a complex roads network (which includes both roads and traffic management and signalling), petrol and diesel distribution, car manufacturing plants, and maintenance and repair facilities (Figure 5.2).This large material configuration is deeply embedded in the physical environment, particularly in urban settings where the car has co-evolved with the building and lay-out of cities and conurbations. These interactions between the automobility system and the built environment are a source of material lock-in but also sites where changes can be negotiated (e.g., traffic regulation, repurposing of roads).
ICE cars are complicated artefacts, requiring the assembly of many components, including vehicles frames (chassis), engines, steering wheels, brakes, glazing, and increasingly elaborate interiors and electronics. The car industry has therefore developed significant logistical innovations, oriented towards the assembly of heterogeneous components in highly automated facilities, relying on extensive networks of specialised suppliers, and the optimisation of component shipping (‘just in time’) to minimise idle stocks.
The automobility system expanded rapidly after the Second World War, as people bought more automobiles and passenger car mobility exploded (Figure 5.3). Growth slowed in the 1990s. Car mobility decreased by 2% between 2007 and 2013 because of high oil prices and the financial-economic crisis and subsequent recession. But between 2014 and 2019, passenger kilometres by cars, vans, and taxis bounced back and increased to a level that was 10% higher than in 2007.
The increase of passenger car mobility has been enabled (and driven) by expanding road infrastructures. The network of minor roads, which distributes traffic to urban and regional localities at relatively low speeds, gradually increased from 250,001 km in 1947 to 346,404 km in 2019 (Figure 5.6). To facilitate traffic flows at very high speeds over long distances, motorways were constructed as a new type of road in the late 1950s, reaching 3,742 km in 2019. The network of major roads, which includes motorways and trunk roads (which are both maintained by national highway agencies) and principal roads (which are maintained by local authorities), increased from 44,591 km in 1947 to 51,191 km in 2019. The different types of roads thus have different functions (local, medium- or long-distance traffic) and are maintained by different kinds of actors. The majority of total motor vehicle traffic (62% in 2019) is accommodated by major roads, including motorways, where cars travel at high speed and high density (Figure 5.7).

Figure 5.6 Length of different road types (in kilometres) in Great Britain, 1923–2019: Motorways on left-hand axis, all major and minor roads on right-hand axis

Figure 5.7 Motor vehicle traffic (vehicle miles) by road class in Great Britain, 1993–2019
Annual car sales have increased rapidly since the 1950s (Figure 5.8), but experienced recurring fluctuations due to macro-economic developments such as recessions and oil price changes (Figure 5.9). The 2007/8 financial crisis (and subsequent recession and austerity politics) and high oil prices depressed car sales until 2012. Sales increased again until 2016, when economic uncertainties following the Brexit referendum caused a new decline since 2017. Car sales plummeted by 28% in 2020 due to COVID-lockdowns.

Figure 5.8 Annual car sales (new registrations) of private and light goods vehicles in Great Britain, 1954–2020, in thousands

Figure 5.9 Crude oil price from 1978 to 2020, in 2020 constant dollars per barrel
The reverberations of the 2015 ‘Diesel-gate’ scandal (in which automakers were found to have cheated emission tests for many years) led to a particularly strong decline in diesel car sales (Figure 5.10). The sales of ‘other’ cars (which mostly include electric vehicles), which will be further discussed in Section 5.6.1, has gradually increased over the past decade, reaching 21% of all sales in 2020 (Figure 5.10).

Figure 5.10 Annual car sales (new registrations) of petrol, diesel, and ‘other’ cars in Great Britain, in thousands, 2001–2020
Real car purchase prices have decreased over time, while running costs (maintenance, fuel, insurance, taxes) have substantially increased (Figure 5.11). Total motoring costs have increased more slowly than the cost of living, however, which means that car travel has become relatively more attractive in the past two decades. Total motoring costs have also relatively increased less than bus and train fares, which rose faster than RPI (Figure 5.11).

Figure 5.11 Relative cost developments 1997–2019 (1997=100) various motoring costs, bus and rail fares, and cost of living (Retail Price Index)
The total passenger car fleet has grown steadily since the 1950s, and in the last two decades experienced a relative shift from petrol to diesel cars (Figure 5.12) until Diesel-gate reversed this trend. ‘Other’ cars (mostly electric vehicles) represented 3.4% of the fleet in 2020.

Figure 5.12 Passenger car fleet (total number of licensed vehicles) in Great Britain by fuel type 1994–2020 in thousands
Two gradual developments contributed to CO2 emission reductions in the car fleet. First, the relative consumer demand shift from petrol to diesel cars (Figure 5.10) helped to reduce emissions, because diesel cars are more fuel-efficient (but more polluting). Second, fuel efficiency performance of new diesel and petrol cars has improved substantially in the last 20 years due to many incremental innovations (Figure 5.13). An important caveat with these fuel efficiency numbers is that automakers have increasingly ‘gamed’ laboratory tests, leading to discrepancies of 30–40% with real-world driving conditions (CCC, 2015; Fontaras et al., Reference Fontaras, Zacharof and Ciuffo2017).

Figure 5.13 Sales-weightedFootnote 2 average new car fuel consumption in Great Britain, 1997–2019, in litres per 100 km
Two other developments first blunted and then partly reversed these fuel efficiency gains. First, people increasingly bought heavier cars with lower fuel efficiency. The percentage of heavy SUVs (Sports Utility Vehicles) in passenger car sales increased from 6.6% in 2009 to 13.5% in 2015 and then jumped to 21.2% in 2018 (UKERC, Reference Turnheim and Sovacool2019). Second, in response to the 2015 Diesel-gate revelations, people shifted from diesel to petrol cars, which are less fuel-efficient.
5.2.2 Actors
Firms: The car industry operates at a global scale, with multinational companies managing manufacturing plants in many countries. Six foreign-owned volume car manufacturers (Jaguar Land Rover, Nissan, Mini, Toyota, Honda, Vauxhall) have manufacturing plants in the UK, which produced 1.3 million cars in 2019 for both domestic and export markets, generating £79 billion turnover and £15.3 billion gross value added. Exported cars were worth $42 billion, accounting for 13% of the UK’s total export goods (SMMT, Reference Smith, Sochor and Karlsson2020). Although the UK ranks only 16th in global car manufacturing (SMMT, Reference Smith, Sochor and Karlsson2020), its car industry is still relatively important for the country. Around 180,000 people are directly employed in car manufacturing, while 860,000 employees work in the wider automotive industry, which also includes component suppliers, car dealerships, and petrol stations (SMMT, Reference Smith, Sochor and Karlsson2020). The industry’s economic clout gives it substantial lobbying power with the UK government (Shaw and Docherty, Reference Shaw and Docherty2014).
UK car manufacturing steadily increased after the 2007/8 financial crisis but decreased markedly after the 2016 Brexit referendum (Figure 5.14), which created deep uncertainties for UK-based automakers, who are deeply entwined with Europe for imports and just-in-time deliveries of components as well as for exports (since the EU accounts for more than half of UK car exports). Automakers therefore worried about the risk of a ‘no deal’ Brexit and the imposition of trade tariffs of 10% or more, which would have threatened the long-term competitiveness of UK-based manufacturing plants. Investments in new projects and UK plant upgrades, which are normally around £2.5 billion per year, decreased to around £590 million in 2017 and 2018, as global car companies delayed or diverted spending (Campbell and Inagaki, Reference Campbell and Inagaki2021). Ford and Honda decided to close UK manufacturing plants as part of a wider global restructuring move. Although the 2020 Brexit deal removed the tariff risk, Toyota and Vauxhall’s new owner Stellantis, formed by a merger in 2021 of Fiat Chrysler and PSA, are still reviewing their options for future investments and closures. Both companies operate vehicle plants in mainland Europe, which they may decide to expand. Car manufacturing plummeted by 29% in 2020 due to the COVID-19 pandemic (Figure 5.14), which led to plant shutdowns and reduced production in response to shrinking demand.

Figure 5.14 Passenger cars produced in the UK in millions, 2003–2020
Operating in a global environment, automakers face several problems that are more important to them than climate change (Geels, Reference Geels2012; SMMT, Reference Smith, Sochor and Karlsson2020): 1) survival in cut-throat competition, 2) under-utilisation of factories and cost pressures, 3) market saturation in developed countries, 4) declining passenger car sales and manufacturing output since 2017 in the UK (Figures 5.8 and 5.12) and globally, which erodes profitability (Miller, Reference Miller2019); the COVID-19 pandemic further exacerbated these sales problems in 2020.
In response to these pressures, automakers have focused on cost-savings, mergers and collaborations, factory efficiency improvements, sales in emerging economies, and continuous incremental product innovation (in engines, safety devices, air-conditioning, occupant comfort, and entertainment). The combination of earlier ICT devices (such as on-board electronics, anti-lock braking, real-time information technologies, and navigation technologies) with improved sensing devices and faster computers has given rise to high expectations about driverless cars, which are discussed in Section 5.6.6.
Automakers also face climate change pressures and have therefore incrementally improved internal combustion engines (with variable valve timing, direct fuel injection), leading to fuel efficiency improvements (Figure 5.13). Automakers have also dedicated efforts towards developing alternative fuel cars (e.g., electric, hybrid, and plug-in hybrid vehicles). Automakers initially pursued these new technologies reluctantly because of uncertainties and to protect their sunk investments (Penna and Geels, Reference Penna and Geels2015). Since 2015, however, most automakers have seriously committed to strategic reorientation activities (Bohnsack et al., Reference Bohnsack, Kolk, Pinkse and Bidmon2020).
The large investments in electric vehicles, driverless cars, and ventures into car sharing (further discussed in Section 5.6.4) are financially challenging for automakers, whose profits have been squeezed by declining passenger car sales since 2017. An article in The Economist (19 January 2019), titled ‘The big freeze: Carmakers scramble to prepare for a chilly future’, summarised the challenge as follows: ‘Even if coping with these [economic] problems were not enough, carmakers also need to make big investments in electric cars, autonomous vehicles and “mobility” services, such as car-sharing and ride-hailing.’
Users: Cars are deeply embedded in everyday life and used for many different purposes, for example, commuting to work, shopping, leisure, social visits, escort of other people (e.g., children), business, and personal business (Sheller, Reference Sheller, Geels, Kemp, Dudley and Lyons2012).Footnote 3 Commuting and leisure account for most passenger-kilometres, although average travel distance for these purposes has decreased somewhat since 2002 (Figure 5.15). Car use decreased sharply in response to COVID-lockdowns in 2020 and 2021 (Figure 5.4) but also rebounded quickly when restrictions were lifted, because many people depend on cars to support many daily life practices.

Figure 5.15 Average distance travelled by car/van for different purposes (miles per person per year, England), 2002–2019
Since the mid-1980s, the percentage of households without cars has steadily decreased, while double car ownership has increased (Figure 5.16). Nevertheless, average per capita passenger car mobility decreased by about 9% between 2002 and 2011, but then increased somewhat (Figure 5.17). In 2019, however, per capita passenger car mobility was still 3% below 2002, providing some support for the ‘peak car’ hypothesis (Metz, Reference Metz2010; Millard-Ball and Schipper, Reference Millard-Ball and Schipper2011).

Figure 5.16 Household car availability as percentage of the population in England, 1985–2019

Figure 5.17 Average per capita passenger travel by cars and light vans in Great Britain, 1971–2019 (kilometres per capita per year)
There is ongoing debate in the literature about the underlying causes for this phenomenon, with some scholars (e.g., Goodwin and van Dender, Reference Goodwin and van Dender2013; Metz, Reference Metz2013; Newman and Kenworthy, Reference Newman and Kenworthy2011; Wadud and Baierl, Reference Wadud and Baierl2017) emphasising social, cultural, and demographic factors such as changes in lifestyle and cultural attitudes, aging of the population, and younger generations showing less interest in cars. Other scholars, however, emphasise economic factors such as rising fuel costs, lower incomes due to the financial-economic crisis, and changing tax rules for company car use (especially increased taxation on fuel provided for private use) (Bastian et al., Reference Bastian, Börjesson and Eliasson2017, Reference Bastian, Börjesson and Eliasson2016; RAC, 2012).
Although people frequently complain about congestion and rising motor running costs, most of them like the act of driving (Sheller, Reference Sheller2004) and the associated ‘feelings of liberation and empowerment’ (Shaw and Docherty, Reference Shaw and Docherty2014: 75). Many consumers also see cars as the most practical transport mode (in terms of speed, convenience, carrying capacity), except in large cities such as London, where car passenger mobility has been declining since the late 1990s (RAC, 2012), because of increasing congestion, parking problems, and costs. The London congestion charge, introduced in 2003, made automobile use in the city centre increasingly expensive as the charge gradually increased from £5 in 2003 to £8 in 2005, to £10 in 2011, to £11.50 in 2014, and £15 in 2020. Between 2002 and 2018, passenger car and van use in London declined by 35–40%, while underground, surface rail, and cycling increased over the same period, suggesting a substantial modal shift is under way (Figure 5.18).

Figure 5.18 Indexed transport modes in London, 2002–2018 (in terms of distance)
Table 5.2 further reinforces the specificities of London’s passenger mobility system, where public transport (bus, tube, rail) is used much more for commuting purposes than in the rest of the country. Strikingly, 22% of London’s commuting trips involve multiple transport modes, which suggests the presence of an effective intermodal mobility system.
Table 5.2. Commuting trips in different areas by mode or multimode in percentage (short walks excluded): England, 2012–2016 (data from DfT (2018))
| All areas | London | Urban areas | Rural areas | |
|---|---|---|---|---|
| Car/van | 69 | 36 | 75 | 90 |
| Bus | 7.5 | 13 | 6.7 | 1 |
| Tube/London Rail | 2.5 | 11 | 0.2 | 0.1 |
| Rail | 2.3 | 7.1 | 1.4 | 0.3 |
| Walk | 5.4 | 4.7 | 6.2 | 1.2 |
| Bicycle | 4.3 | 4 | 4.5 | 2.5 |
| Taxi | 0.7 | 0.5 | 0.9 | 0.2 |
| Other | 1.3 | 1.7 | 1.3 | 2 |
| Multi-mode | 7 | 22 | 3.8 | 2.5 |
When buying a new car, most consumers find conventional criteria (e.g., price, car size, reliability, comfort, safety, running costs, appearance, engine performance, image) more important than climate change mitigation (Geels, Reference Geels2012). Increased adoption of SUVs, for instance, is driven by appreciation of safety, comfort, size, and reliability (UKERC, Reference Turnheim and Sovacool2019).
Among young people, however, the prevalence of cars and driver’s licenses has decreased since the 1990s (DfT, 2017). These trends led to speculations about changing cultural attitudes about cars among young people (McDonald, Reference McDonald2015). Recent studies, however, suggest these trends may be more related to higher fuel costs, youth unemployment, and a tendency for millennials to delay adult life stage decisions such as having children or buying a house (Delbosc, Reference Delbosc2016; Garikapati et al., Reference Garikapati, Pendyala, Morris and Mokhtarian2016). Quantitative analyses of several large European datasets between 2014 and 2018 found that young people (‘Millennials’) do own and use cars less often than post-war Baby Boomers, but that the difference is diminishing as improving economic conditions have led Millennials to buy and use more cars (Colli, Reference Colli2020).
Policymakers: A prime consideration of UK transport policymakers has long been to stimulate economic growth by facilitating the smooth flow of goods and people. From the 1960s to the 1990s, the so-called predict and provide policy paradigm (Goulden et al., Reference Goulden, Ryley and Dingwall2014) therefore aimed to provide enough road capacity to match forecast increases in car and freight traffic. This resulted in the construction of an extensive road network (Figure 5.6). The promotion of UK-based car manufacturing has been another policy priority in recent decades, aimed at supporting jobs and economic growth (Wolmar, Reference Wolmar2016).
UK transport policy has also aimed to address several negative externalities of car traffic such as congestion, traffic accidents, air pollution, and climate change (Geels, Reference Geels2012). In the 1990s, the predict-and-provide paradigm ran out of steam, as policymakers realised that the construction of more roads stimulated the increase of road traffic, which exacerbated congestion and other problems (Owens, Reference Owens1995). The Labour government’s (1997–2010) New Deal for Transport: Better for Everyone White Paper (1998) explicitly abandoned ‘predict and provide’ as unsustainable and instead introduced new principles. One new principle was traffic management, which aimed to improve the flow of vehicles on existing roads using speed limitations, priority lanes, roundabouts, and ICT devices (e.g., video cameras, communication technologies, electronic signalling devices, computer networks) to monitor and influence traffic (Geels, Reference Geels2007b). Another new principle was demand management, which aimed to reduce the amount of road traffic by changing travel habits and promoting alternative modes. Plans were made to stimulate and better align public transport modes, captured by new concepts such as ‘integrated transport’ and ‘sustainable transport’.
Although these plans suggest that transport policy became less ‘pro-car’, road building did not stop. In fact, between 2000 and 2019, the motorway infrastructure was lengthened by 275 km or 8% (Figure 5.6). Policy plans also encountered opposition. The Labour government’s plans to increase fuel duties more rapidly, for instance, encountered fuel protests and road blockades in 2000, which threatened to paralyse the country. This, in turn, led to an institutionalised fear not to go against what the public wants and to the postponement of the ambitious policy plans in the 1998 New Deal for Transport. Explicit efforts to shape travel habits and stimulate modal shifts (from cars to other transport modes) were gradually dropped and increasingly replaced by a focus on technological improvements (in cars, roads, railways, busses), leaving it to consumers to choose the options they preferred. Although policymakers did stimulate public transport (to some extent), ‘successive administrations have backed away from doing anything that they thought would be construed as overtly “anti-car”’ (Shaw and Docherty, Reference Shaw and Docherty2014: 175).
The continuing importance of cars was also visible in responses to the financial-economic crisis, which led policymakers to not only support financial institutions but also the car industry. To prop up demand, policymakers introduced scrappage schemes that provided £2,000 rebates for replacing old vehicles with new ones. They also invested in new road building, signalling a return of ‘predict and provide’ (Goulden et al., Reference Goulden, Ryley and Dingwall2014). In 2014, the government announced a £15 billion roadbuilding programme. The 2020 Spending Review further invested £27 billion through a five-year Road Investment Strategy aimed at building 4,000 miles of new strategic roads and motorways.
Austerity policies after the 2007/8 financial crisis also led to major reductions in government funding for local authorities, which are responsible for parking policy, local traffic plans, and for maintaining minor and principal roads, which make up the bulk (87%) of the total road infrastructure (Figure 5.6). Reduced local infrastructure spending resulted in deteriorating conditions of local roads (Wolmar, Reference Wolmar2016).
Climate change has climbed rapidly on transport policy agendas since the late 2000s. Although public transport, cycling, biofuels, and other options received some (fluctuating) support, the policy emphasis overwhelmingly came to focus on electric vehicles (further discussed in this chapter). The focus on the ‘greening of cars’ came from both European and UK policymakers. European policymakers introduced CO2 emission performance standards for new cars in 2009, which were subsequently tightened in 2014 and 2019. And UK transport policymakers introduced a raft of policies to stimulate electric vehicles (further discussed later), aiming to both address climate change and stimulate domestic vehicle manufacturing (Mazur et al., Reference Mazur, Contestabile, Offer and Brandon2015; Skeete, Reference Skea, van Diemen, Hannon, Gazis and Rhodes2019).
In the context of Diesel-gate and climate change debates, the government announced plans in 2017 to phase-out petrol and diesel cars by 2040. In February 2020, the phase-out date was brought forward to 2035 and in November 2020 to 2030. This phase-out policy will create mass markets for electric vehicles. Although the stimulus and phase-out policies thus became increasingly interventionist and disruptive in some ways, they also signalled that cars would remain central in future low-carbon transitions and UK transport policy.
This continued commitment to cars was reinforced by the government’s Road to Zero report (DfT, 2018b) that almost exclusively focused on road transport and electric vehicles, which were explicitly linked to industrial strategy (Brand et al., Reference Brand, Anable, Ketsopoulou and Watson2020). Partly in response to criticisms of this narrow focus, the Department for Transport launched a consultation paper in March 2020 (DfT, 2020a), which announced intentions to develop the ‘first comprehensive action plan’ (p. 3) for decarbonising the whole transport system. In July 2021, the government published the resulting new strategy, the Transport Decarbonisation Plan (DfT, 2021a), which indeed addresses all transport modes and freight. The strategic vision also strikes a new tone because two of its six strategic priorities emphasise modal shift towards public and active transport (in line with the new bus, rail, and cycling strategies announced in 2020 and 2021, which are discussed later) and place-based solutions focused on local transport systems, which have remained marginal in UK transport policy for the past two decades. The other priorities, however, continue to focus on low-carbon technologies for passenger vehicles, freight transport, aviation, and shipping, and aim to position the UK as a ‘hub for green transport technology and innovation’ (p. 40). Electric vehicles remain a core plank of the strategy, with the government planning to consult on the introduction of a Zero Emissions Vehicle mandate (which would impose sales targets on automakers) and phase-out plans for small and heavy diesel trucks by 2035 and 2040, respectively.
Although the new discursive emphasis on modal shift and place-based solutions is interesting and welcome, the plan did not announce new money for these options compared to earlier statements in February 2020, which are further discussed later. The plan’s ambivalence is also clear in the Ministerial foreword, which on the one hand says that ‘we must make public transport, cycling and walking the natural first choice’ (p. 6), but on the other hand states that the plan is ‘not about stopping people doing things: it’s about doing the same things differently. … We will still drive on improved roads, but increasingly in zero emission cars’ (p. 4). So, while the strategic vision is full of good intentions, it remains unclear if there will be sufficient policies to achieve the stated goals.
Wider Publics: Concerns about air pollution, the countryside, and the quality of urban space led to strong anti-car and anti-road narratives and protests in the 1980s and 1990s (Roberts and Geels, Reference Roberts and Geels2018), which succeeded in halting the road-building programme announced in the 1989 White Paper Roads for Prosperity. But in wider public debates, cars remained culturally associated with positive values such as freedom, individuality, and success (Sheller, Reference Sheller, Geels, Kemp, Dudley and Lyons2012), although there appear to be generational differences, with young adults showing more varied attitudes (Colli, Reference Colli2020; McDonald, Reference McDonald2015).
Public debates also remain concerned with congestion and fuel prices, which create pressures on policymakers to address these issues. Climate change has become an important issue in public debates about transport, but discourses focus more on electric vehicles than on reduced car use or ownership (Bergman et al., Reference Bergman, Schwanen and Sovacool2017). Local air pollution, which is responsible for between 28,000 and 36,000 premature deaths in the UK each year (PHE, 2019), has also risen high on public agendas, because many UK cities breached air pollution standards for many years. The 2015 Diesel-gate scandal caused public outrage and anger, because cheating automakers clearly privileged car sales over air pollution and public health considerations. Negative public debates not only contributed to declining diesel car sales but also prepared the ground for later phase-out policies of diesel and petrol cars.
5.2.3 Policies and Governance
Policies
Many formal rules and regulations shape automobility and road transport, including traffic rules, drivers’ licenses, road taxes, excise duties, road infrastructure design and construction rules, parking rules, and vehicle standards (on emissions, safety, noise, recycling, materials). Regulations and policies with regard to climate change have gradually strengthened over time, initially stimulating incremental changes (such as engine efficiency improvements), but increasingly also stimulating more radical technical changes (e.g., electric vehicles).
The UK government introduced CO2-banding in its Vehicle Excise Duty in 2001, which reduced vehicle sales taxes for fuel-efficient cars. This stimulated the adoption of diesel cars (Figure 5.10). In 2015, however, the new Conservative government replaced this CO2-banding with a flat-rate annual fee, starting in 2017. The unintended consequence of diesel car diffusion was an increase in local air pollution (NOx, particulate matter), which has remained a topic of heated public health debates since 2016, leading to decreasing diesel car sales (Figure 5.10) and phase-out regulations.
In 2009, the European Commission introduced new car CO2-regulations of 130 g/km for 2015 fleet average company sales. These regulations accelerated fuel efficiency improvements (Figure 5.11). In 2009, the European Commission also introduced the Renewable Energy Directive, which stipulated that 10% of transport energy should come from renewable sources by 2020, which stimulated bio-fuel deployment (further discussed in Section 5.6.2). In 2014, the CO2-emission target was tightened to 95 g/km in 2020/21. In 2019, the European Commission not only confirmed that automakers had to meet this target for the average of all their sales but also added stiff fines for companies that would miss the target, namely €95 (£83) for every gram they are over the limit, multiplied by the number of cars sold that year. As a transitional arrangement, the highest-polluting 5% of new cars registered in 2020 are excluded for the 2021 calculation of fines over the previous year. For 2021, however, all major carmakers are expected to miss their emissions targets, which may lead to €20 billion fines in 2022 (which are likely to be especially large for Volkswagen and PSA). To lower their fleet average emissions, automakers are therefore rushing to market new electric vehicles, or even pool emission numbers with companies such as Tesla (Jolly, Reference Jolly2020a).
UK policymakers also introduced policies to stimulate electric vehicles (further discussed in Section 5.6.1). In 2009, they created the Office for Low Emission Vehicles (OLEV), which disbursed £400 million of government funding between 2011 and 2015 on R&D, consumer subsidies, and recharging infrastructure. Between 2015 and 2020, a further £500 million was spent on supporting ultra-low emission vehicles (ULEVs), which emit less than 75 gCO2/km, that is, electric vehicles and plug-in hybrids. The 2030 phase-out policy of diesel and petrol cars is another policy to support ULEV markets.
London’s policymakers introduced a congestion charge in 2003, which aimed to reduce traffic flows, air pollution, and noise pollution in the central London area. In 2017, London also introduced a toxicity charge in response to increasing air pollution concerns in central London. The £10 charge applies to older and more polluting cars and vans that do not meet Euro 4 standards. In 2019 this charge was replaced by the Ultra-Low Emission Zone (ULEZ), which in Central London charges fees to pre-2006 petrol cars and vans and pre-2015 diesel cars and vans.
Governance Style
Beyond specific regulations and policy instruments, the UK transport governance style has several characteristics. One characteristic is that the Department for Transport ranks relatively low in the wider political and departmental pecking order, which means that transport-related issues rarely receive high priority: ‘Transport is rarely seen as a particularly important are of concern in relation to other policy matters’ (Shaw and Docherty, Reference Shaw and Docherty2014: 8). Consequently, transport has not received long-term sustained funding, as Shaw and Docherty (Reference Shaw and Docherty2014: 4) note: ‘In four decades up to early 2000s, the UK spend on average 40% less as a proportion of GDP on its infrastructure each year than other leading countries in Europe.’ Combined with the UK ‘tendency of muddling through’ (Shaw and Docherty, Reference Shaw and Docherty2014: 6), the result is that UK transport has fallen behind leading European countries in the resilience and reliability of core infrastructure, comfort, and ease of using public transport, and the aesthetics of urban space.
Another characteristic is that UK transport governance ‘is highly centralized, with very little power at the local level’ (Wolmar, Reference Wolmar2016: 106). Although local policymakers have become increasingly concerned about ‘quality of life’ issues such as air pollution, congestion, noise, and parking, their policy responses are constrained by their financial and regulatory dependence on Westminster. London is an exception because it has substantial policy discretion and because Transport for London (TfL) received dedicated funding from the Government (until 2018) and the Greater London authority.
A third characteristic is an increasing policy focus on technology and infrastructure projects rather than travel behaviour change or spatial planning. Successive transport ministers preferred ‘large-scale road and (now) rail projects’ over ‘decidedly unsexy but very important local schemes’ (Shaw and Docherty, Reference Shaw and Docherty2014: 103). Wolmar (Reference Wolmar2016: 80) links this focus to the widespread use of cost-benefit analysis in transport decision-making and the emphasis in these analyses on time savings made by the users of new infrastructure: ‘This tends to favour bigger schemes as the benefits can be presented as very large, and also results in ignoring schemes that deliver other benefits than time savings’, such as traffic calming, safety, and environmental issues. The 2021 Transport Decarbonisation Plan (DfT, 2021a) and the new bus, rail, and cycling strategies, which are further discussed later, deviate somewhat from this characteristic because they introduced a new emphasis on modal shift, behaviour change, and local solutions besides the ongoing technological focus.
A fourth characteristic is that UK transport governance is relatively light touch and market-based, leaving it to consumers to choose their transport mode and vehicle (perhaps incentivised with some market-based instruments). Exceptions were the more interventionist 1998 New Deal for Transport plan (which was only limitedly implemented) and the recent phase-out policies of diesel and petrol cars. The 2021 Transport Decarbonisation Plan and the new bus and cycling strategies are also more interventionist because they hope to shift people from cars to public and active transport modes. The scope for change may be limited, however, by structural and cultural lock-in mechanisms that have created car dependence in many places: ‘Decades of transport policies favouring road transport and the associated, established car culture mean that for many journeys people have little practical choice, or at least perceive that they have little practical choice, other than to drive to where they want to go’ (Shaw and Docherty, Reference Shaw and Docherty2014: 176).
5.3 The Railway System
5.3.1 Techno-Economic Developments
The railway system consists of extensive, costly infrastructures, which enable trains to travel uninterrupted between cities and villages, where stations enable passengers to enter and exit. Rail infrastructures include both trunk lines for long-distance, high-speed travel between major cities, and local networks with regional services that stop frequently. While trunk lines are electrified, many UK local networks still operate diesel trains. Railway signalling is a system used to direct railway traffic and prevent collisions.
Rail infrastructure length has decreased substantially since the Second World War, with particularly steep reductions following the 1963 Beeching plans, which by 1968 had reduced tracks by 7,000 km (Figure 5.19) and halved British Rail’s supply of rolling stock and number of railway stations (Roberts and Geels, Reference Turnheim, Asquith and Geels2019). Only a third of UK railways are electrified, which is low compared to France (52%), Germany (58%), and Italy (71%). This is the result of the ‘slow and piecemeal way in which successive governments chose to electrify the rail network’ (Shaw and Docherty, Reference Shaw and Docherty2014: 109).

Figure 5.19 Length of railway infrastructure and electrified routes (in kilometres) in Great Britain, 1946–1919
Rail use declined slightly in the post-war decades, increased somewhat in the 1980s, and has more than doubled since the mid-1990s (Figure 5.20), despite rail fares increasing faster than the retail price index (Figure 5.11). Increased rail travel caused overcrowding in trains and congestion on the rail network, which led to increasing infrastructure investment. Many infrastructure projects focused on rail improvements in/out/across London, for example, Thameslink, Crossrail, high-speed railways to Europe (since 2007), and a second high-speed railway to Manchester and Leeds (called ‘HS2’). These new projects (slightly) increased rail length after 2012. Services between other UK cities have remained less developed and are where ‘the shortcomings of integrated network planning are most obvious’ (Haywood, Reference Haywood2007: 210).

Figure 5.20 Passenger kilometres by rail, Great Britain, 1952–2019, in billion kilometres
Rail travel collapsed due to COVID-lockdowns, reaching levels as low as 5% of normal use in April 2020 (Figure 5.4). Since then, rail travel has recovered slowly, but in July 2021 was still 50% below pre-pandemic levels.
5.3.2 Actors
Firms: British Rail, which was a vertically integrated state monopoly overseeing rail network development, maintenance, and operations, was privatised in 1994–1997. This created a complex network of actors, including: a) Train Operating Companies (TOCs) that operate 16 railway franchises for specific routes, b) rolling stock operating companies that lease trains to TOCs, c) Network Rail, which owns, maintains, and operates the railway infrastructure, d) the Office of Rail Regulation that oversees the industry, and e) the Department for Transport (DfT), which awards and sets general conditions for the railway franchises. Climate change is of limited importance to most of the industry actors, whose strategies mostly focus on financial gaming of the complex franchise and lease system, by privatising gains and collectivising costs.
TOCs compete for franchises, which they operate to optimise profits. TOCs earn income through: a) passenger revenues, which increased from £4.6 billion in 2000 to 10.2 billion in 2019 (through increased fares and passenger journeys), b) other train-related income (e.g., catering in trains and stations), which was $1.2 billion in 2019, and c) direct government payments (through franchise awards and performance grants), which were £1.2 billion in 2019 (ORR, 2020); these government payments were negative between 2011 and 2017 (because of the way franchises were structured), but turned positive again in 2018 and 2019 (see also Figure 5.22). TOCs lease trains from rolling stock operating companies, pay ‘track access charges’ to Network Rail for the use of rail infrastructure, and have several other operating expenditures, which have historically been lower than total income, allowing TOCs to make net profits of about 2–3% of revenue. But since they do not invest in trains or tracks, TOCs extract these profits at very low risk, leading to returns-on-capital that can be as high as 120% (Bowman et al., Reference Bowman, Folkman, Froud, Johal, Law and Leaver2013).
TOCs also benefit from large indirect subsidies in the form of relatively low track access charges (which is a political decision), which are not enough to cover the investments by Network Rail in track maintenance and expansion, and these have therefore been paid through a mixture of government subsidy and debt accumulation, as we describe next.
The publicly owned Network Rail organisation became responsible for railway infrastructure when Railtrack (which was created after privatisation) went bankrupt in 2002. Because privately owned Railtrack made limited investments in track and signalling infrastructure, Network Rail had to address this backlog while also expanding and upgrading railways to accommodate growing rail traffic. Despite increasing rail traffic, TOC payments for infrastructure use decreased from £2.2 billion in 2008 to £1.6 billion in 2012 (Bowman et al., Reference Bowman, Folkman, Froud, Johal, Law and Leaver2013). Although ‘track access charges’ increased again from £1.6 billion in 2015 to £2.5 billion in 2019 (ORR, 2020), TOC payments continued to fall short of Network Rail investments. Government payments to Network Rail have increased substantially over time, from £1.7 billion in 2002 to £7.1 billion in 2019 (see Figure 5.22). Additionally, Network Rail has borrowed money from the financial markets to finance rail infrastructure investments. By 2012, this had resulted in cumulative debt of £30 billion (Bowman et al., Reference Bowman, Folkman, Froud, Johal, Law and Leaver2013), which by 2019 had ballooned further to £52 billion (ORR, 2020). This money thus forms an indirect subsidy to TOCs, which (with political consent) have managed to socialise infrastructure costs.
The COVID-related decline in passenger travel and fare incomes created major financial problems for the railway companies, which led policymakers to suspend the franchise model and provide emergency support to railway companies to prevent bankruptcy.
Users: Rail use increased despite soaring rail ticket prices, which increased by 102% between 1997 and 2014, making UK rail fares among the highest in Europe. People use trains for various purposes. Although leisure is the single largest end-use category, commuting and business-related travel together accounted for more than half of all railway passenger kilometres (51%) in 2019 (Figure 5.21).

Figure 5.21 Average distance travelled by railways for different purposes (miles per person per year, England), 2002–2019
Rail travel is dominated by the ‘London effect’: almost two-thirds of all rail journeys started or ended in London (DfT, 2019a). The most important explanation for increased rail travel growth is the socio-economic boom in Greater London and the South East, which stimulated more train travel in/out of London.
About half of the new rail travellers are drawn from the group of regular car users. Growth in rail use has thus led to some modal shift, which has been largest for ‘men living outside London but travelling into London regularly for work-related purposes’ (RAC, 2012: 84). Although there is ongoing debate about underlying causes of increased rail travel, proximate reasons are: a) rising London house prices forcing people to live elsewhere and commute to work, b) reduced company car use (related to fuel taxation changes), c) the London congestion charge and other car-hindering measures (RAC, 2012).
Railway usage decreased by 95% in April 2020 during the first national lockdown and has only slowly recovered since then (Figure 5.4), owing to ongoing COVID restrictions (such as the 2 metre distance rule) and health concerns that made people more reluctant to travel with others in confined spaces. It remains to be seen if this is a structural trend that will negatively impact public transport.
Policymakers: Policymakers privatised the railways with the stated aims of improving service quality, increasing competition and cost-efficiency, reducing public subsidies, encouraging investment, and improving environmental performance (Haubrich, Reference Haubrich2001). Reality turned out differently, and aims have not been met with regard to service quality, cost-efficiency, and private investment (Haubrich, Reference Haubrich2001; Jupe, Reference Jupe2013). Despite promises to the contrary, public subsidies also increased substantially (Figure 5.22), especially for Network Rail, which imply indirect subsidies to TOCs, who thus pay too little for the use of railway infrastructure.

Figure 5.22 Government support to the rail industry, 1985–2019 in £million
To accommodate the growth in rail travel and address emerging problems, policymakers have substantially supported rail infrastructure expansion since the early 2000s (Figure 5.22). These investments have focused more on large-scale, eye-catching projects (such as HS2, Crossrail) than on improvements in existing tracks or the signalling infrastructure (Wolmar, Reference Wolmar2016).
The various railway problems were investigated in the 2006 Eddington Review, the 2011 McNulty Review, and the 2013 Brown Review. The McNulty Review, for instance, criticised the lack of efficiency improvement, which created a 40% gap with European comparators. The review also found that the ‘causes of GB rail’s excessively high costs are many and complex’, including ‘fragmentation of structures and interfaces, roles of government and industry, ineffective and misaligned incentives, a franchising system that does not encourage cost efficiency sufficiently, management approaches that fall short of best practice, and a railway culture which is not conducive to partnerships and continuous improvement approaches’ (p. 5).
Despite the critical reviews and public debates, policymakers did not show much appetite to substantially change institutional framework conditions (Jupe, Reference Jupe2013). Although Labour politicians repeatedly criticised existing arrangements and advocated railway renationalisation in the past 10 years, their proposals had limited direct effects because they were not in government. But the criticisms did have indirect effects in keeping problematic railway arrangements in the spotlight and shaping the discourse. The COVID-19 shock, which substantially disrupted the railway industry, then provided the conditions for Conservative politicians to introduce major institutional changes, which are further discussed later.
Wider Publics: Public debates about railways are mostly negative, focusing on overcrowding, delays, high train fares, and public subsidies (Taylor and Sloman, Reference Taylor and Sloman2013). Although debates on the European continent often emphasise the public-good role of railways in providing mobility access for people without cars, this argument has been far less salient in UK debates in recent decades, where railways are mostly framed as a private enterprise (Roberts and Geels, Reference Roberts and Geels2018). There have, nevertheless, been ongoing critical debates about the dysfunctionalities of privatisation and liberalisation of the railways, which created the conditions for substantial institutional change (i.e., the Great British Railways reforms) when the COVID-pandemic disrupted the railway industry.
Public debate has focused on new infrastructure projects, which policymakers portray as economically necessary. Opponents, however, questioned the wisdom of large investments for HS2 (estimated at more than £100 billion) and criticised negative effects on the countryside. The COVID-pandemic reignited these debates because potential alterations in commuting and business travel erode the HS2 business case, leading the National Infrastructure Commission (NIC, 2020) to suggest that HS2 infrastructures beyond Birmingham should be ‘reviewed’ and potentially not go ahead.
5.3.3 Policies and Governance
Railway governance has been very London-centric and focused on large-scale projects (e.g., Crossrail, Thameslink, HS2) rather than on whole system improvement, including technical issues such as railway electrification and signalling. Instead of improving bottlenecks in existing railways, policy attention has mostly focused on new high-speed lines. But according to Wolmar (Reference Wolmar2016: 88), ‘HS2 is a political project pushed through as a grand projet by politicians for reasons that do not stand up to political scrutiny. In effect, it is transport policy on a whim.’ Although railway polices made some piecemeal improvements, there is a ‘failure to follow through on an overarching vision for developing the railways’ (Shaw and Docherty, Reference Shaw and Docherty2014: 106).
Privatisation of British Rail in the 1990s was a major institutional change that under-delivered on the promises that were made in advance. Although the effects of privatisation were disappointing, successive governments were unwilling to substantially adjust the institutional framework, despite providing increasingly large subsidies (Figure 5.22). Repeated criticisms by the Labour opposition contributed to the erosion of the taken-for-granted legitimacy of existing institutional frameworks. In response to the COVID-pandemic, the government first provided substantial financial support to the railway companies, amounting to £12 billion in the first post-lockdown year (DfT, 2021b: 6), to prevent bankruptcy and ensure some continued service provision through the Emergency Measures Agreements (from March to September 2020) and the Emergency Recovery Management Agreements (from September 2020 to March 2022).
In May 2021, the government then introduced substantial institutional reform that aimed to simplify arrangements by creating a new arm’s length public body, Great British Railways (GBR), which from 2023 ‘will own the infrastructure, receive the fare revenue, run and plan the network and set most fares and timetables’ (DfT, 2021b: 7). GBR will also contract with train companies to operate trains to the timetable and fares it specifies. Train companies are expected to compete for the contracts, which will incentivise them on punctuality and efficiency rather than revenue raising (as in the franchise model). Although the government says it is committed to grow the railways, the institutional reforms also clearly aim to ‘secure significant efficiencies’ (p. 8) and reduce public subsidies because ‘the current sums being paid to operate and maintain the railways are not sustainable’ (p. 7). Many of the details are still to be decided, so it remains to be seen what the effects of these reforms will be.
5.4 The Bus System
5.4.1 Techno-Economic Developments
Buses share many road infrastructures with cars and cyclists, although some cities have started to introduce segregated bus lanes on some roads. Bus services are thus more flexible than (fixed) railways but do follow particular routes, which in many cities are determined by private bus companies. Some stops along routes are merely indicated by signs, whereas others also have shelters that protect waiting passengers from the weather. Although timetables indicate bus frequencies and arrival times, traffic congestion and other contingencies frequently cause delays, which create uncertainties for waiting passengers. Bus stops can be fitted with real-time passenger information displays that reduce these uncertainties by more reliably indicating estimated times of arrival. Buses mostly provide short- to medium-distance services within cities, although coaches also offer long-distance services between cities, and are often cheaper than trains.
Bus use is in long-term decline, with total bus passenger kilometres declining by 22% between 2010 and 2019 (Figure 5.3). In London, however, the number of bus journeys has increased substantially since 1995, accounting for about half of English bus passenger journeys in 2019 (Figure 5.23). Bus travel has become more expensive with fares rising faster than the retail price index, and faster than rail fares (Figure 5.11). The COVID-19 pandemic reduced bus travel by almost 90% in April 2020, which subsequently only partly rebounded to about 60% of pre-pandemic levels by July 2021 (Figure 5.4).

Figure 5.23 Number of English passenger journeys (in millions) on local buses, 1982–2019
The great majority of buses in Great Britain (85%) still use diesel fuel (Table 5.3). Diesel-electric hybrid buses, which are 20–30% more fuel efficient, have also found some use, but mostly in London and far less in the rest of the country. Electric and gas-based buses are still relatively rare. Electric buses are mostly used in London, although a few city regions (e.g., Nottinghamshire, North Yorkshire, Greater Manchester) also experienced some deployment.Footnote 5
Table 5.3. Percentage of fuel consumption in buses operated by local bus companies in 2019/2020 (constructed using data from Department of Transport Statistics; Bus Statistics; Table BUS0609)
| London | England | England outside London | Scotland | Wales | Great Britain | |
|---|---|---|---|---|---|---|
| Electric (not hybrid) | 4 | 2 | 1 | 1 | 0 | 1 |
| Diesel-hybrid | 40 | 14 | 3 | 6 | 0 | 12 |
| Methane, bio-methane | 0 | 1 | 2 | 0 | 0 | 1 |
| Diesel | 56 | 84 | 95 | 94 | 100 | 85 |
5.4.2 Actors
Firms: The bus industry (except in London, and a few other places, including Nottingham and Reading) was deregulated in 1986, and subsequently privatised, which initially resulted in a range of small companies, but subsequent take-overs created an oligopoly (Langridge and Sealey, Reference Langridge and Sealey2000), dominated by five bus groups (First, Go-Ahead, Stagecoach, Arriva, National Express). The bus market is locally organised, with companies competing for specified tenders.
Privatisation allowed bus companies to decide on their routes, fares, and timetables. The promise was that increased competition between bus companies would result in improved services, lower fares, and increased bus use (Cowie, Reference Cowie2002). The results have been exactly the opposite: bus use has decreased, except in London (which did not privatise bus services); fares have increased faster than the retail price index (Figure 5.11); and service quality has decreased (Stradling et al., Reference Strachan, Cowell, Ellis, Sherry-Brennan and Toke2007). Bus companies mostly compete on costs, paying only moderate attention to innovation and quality improvement.
Despite being privatised, the bus industry is heavily subsidised. Decreases in public support, from 49% of total revenue in 2009 to 41% in 2019 (Figure 5.24), reinforced the industry’s cost focus at the expense of other considerations. Although air pollution and climate change are not core considerations, bus companies have used government subsidies to gradually adopt hybrid and electric buses (especially in London). The COVID-pandemic substantially disrupted the bus industry, leading to emergency government support.

Figure 5.24 Operating revenue (in £millions at current prices) for local bus services in England, 2004–2019, through passenger fare receipts and (three forms of) government support
Users: Buses are the most frequently used and most accessible mode of public transport (McTigue et al., Reference McTigue, Monios and Rye2018). Bus use is primarily local. Most trips are between one and five miles. Buses are essential for people without cars, accounting for over 60% of all public transport trips. Bus use is most prevalent among lower income families, students, the young, and elderly people (DfT, 2014). People aged over 60 received concessionary bus travel passes in 2001 to enhance their access to mobility services. Local bus use is primarily for shopping, education, leisure activities, and commuting (DfT, 2017). Bus use has been declining, especially outside London, because of rising fares and declining service frequency and punctuality. Decline was further accelerated by the COVID pandemic and only partially rebounded (Figure 5.4), owing to lingering health concerns among the elderly and shifts to online teaching for students, which both may lead to long-term structural shifts.
Policymakers: Policymaking for bus transport has been fragmented since deregulation and privatisation, with national policymakers setting regulatory frameworks and controlling financial purse strings, and local authorities implementing policies and contract tendering. In response to the negative effects of privatisation, policymakers have tried since the late 1990s to improve coordination, innovation, and service quality in the fragmented bus industry. Despite various new policies, which are further discussed later, the problems have not been solved. One reason is that national funding for buses has decreased since the financial crisis, especially for bus operator grants and public transport support to local authorities (Figure 5.24).
Another reason is that local transport planning is hindered by limited policy discretion and dependence on national funding sources (Marsden et al., Reference Marsden, Ferreira, Bache, Flinders and Bartle2014). Local transport policymaking is also hampered by several barriers: shortage of skilled staff, limited political support from city councils, lack of funding, and insufficient strategic alignment between objectives and resources (McTigue et al., Reference McTigue, Monios and Rye2018).
A third reason is that local councils have ‘insufficient political will to improve bus infrastructure where it involves reallocating road space away from cars, little desire to upset their local bus companies by interfering with their existing operations and a lack of in-house expertise capable of actually fashioning and managing a fully integrated transport network’ (Shaw and Docherty, Reference Shaw and Docherty2014: 90).
London, which privatised but not deregulated its bus services, is an exception. Bus use in London has expanded significantly since the early 2000s (Figure 5.23) for several reasons. First, successive mayors (Livingstone, Johnson) made buses a policy priority. Second, bus services remained regulated by Transport for London, which sets high standards in its bus tenders. Third, substantial financial support of around £600 million/year was made available to expand and improve London’s bus system (Shaw and Docherty, Reference Shaw and Docherty2014).
Wider Publics: The public image of buses is poor. They have become viewed as a ‘last resort’ means of transport (Shaw and Docherty, Reference Shaw and Docherty2014). Public debates are mostly about negative issues such as rising fares and low service quality (Knowles and Abrantes, Reference Knowles, Abrantes, Docherty and Shaw2008; Stradling et al., Reference Strachan, Cowell, Ellis, Sherry-Brennan and Toke2007). There is no consensus about how to improve bus services (Currie and Wallis, Reference Currie and Wallis2008). It is surprising that air pollution problems have not led to stronger debates about dirty diesel buses, although this has begun to change in the last few years.
5.4.3 Policies and Governance
The negative unintended consequences of bus privatisation and deregulation gave rise to several policy initiatives. The 2000 Transport Act allowed local authorities to introduce ‘quality partnerships’ to stimulate innovation. In this partnership, local transport authorities would agree to improve bus stop infrastructure (e.g., raised kerbs, shelters, real-time passenger information), if bus companies invested in new vehicles and driver customer care training (White, Reference White2010). These partnerships had limited success, however.
The 2008 Local Transport Act aimed to facilitate collaboration between operators and local authorities to co-ordinate ticketing and timetabling. The 2011 Local Transport White Paper further aimed to enhance the ‘whole journey experience’ and promoted integrated ‘smart’ ticketing. These national policies had limited effects (except for London), because they ‘failed to compensate for the fragmentation installed in the horizontal level by the bus deregulation’ (Sørensen and Gudmundsson, Reference Sørensen and Gudmundsson2010: 14–15).
To address local air pollution and climate change, national policymakers also tried to stimulate the uptake of hybrid and electric buses via the Green Bus Fund (£90m between 2009 and 2015) and the Low Emission Bus Scheme (£41m between 2015 and 2017), which have delivered over 1,600 buses in service. Wider diffusion was hampered, however, by the stop-start dynamic of national funding sources and changing priorities (McTigue et al., Reference McTigue, Monios and Rye2018). The Ultra-Low Emission Bus Scheme (£48million) aimed to drive further uptake between 2018 and 2021.
In response to the pandemic, policymakers introduced the COVID-19 Bus Service Support Grant (CBSSG), which provided about £1.4 billion support funding between March 2020 and July 2021.Footnote 6 This grant enabled bus companies outside London to provide service levels of up to 100% of pre-pandemic levels, which supported people relying on bus services, including many key workers. From September 2021, however, the government intends to reduce recovery funding from £27 million per week to about £8 million per week, which may substantially affect bus companies if travel patterns have not substantially increased.
Before the pandemic, in February 2020, the Johnson administration already announced a £5 billion bus and cycling fund to stimulate both transport modes, although it reportedly also aimed to stave off criticisms of the £100 billion HS2 go-ahead decision (Stewart and Walker, Reference Steward2020). These plans were maintained and elaborated during the pandemic, which highlighted the importance of local transport and structural reform, culminating in the National Bus Strategy for England, launched in March 2021 (DfT, 2021c). Using £3 billion of funding over five years it aims to reform and improve bus services outside London and reverse their decades-long decline. Specific goals include: a) the introduction of simple, cheap flat fares (which enable multiple trips in one day), b) multi-modal tickets that can be paid with a contactless card, c) more frequent and reliable services, d) high service standards and improved digital information, e) new priority lanes for buses, and f) the introduction of about 4,000 electric buses (representing about 10% of the bus fleet). To achieve these goals, the National Bus Strategy also introduced the option of Enhanced Partnerships between Local Transport Authorities (LTAs) and bus companies, which give LTAs more influence over timetables, multi-operator ticketing, and bus services improvements, and made access to the additional £3 billion funding conditional on LTAs and bus companies implementing Enhanced Partnerships by April 2022.
For much of the studied period, the bus governance style had several characteristics that hampered policy effectiveness. First, buses had relatively low political priority, despite their importance for particular social groups. For many years, policymakers have given less attention (and resources) to buses than to trains or cars, because buses are less about big infrastructure projects and thus less eye-catching (Wolmar, Reference Wolmar2016). Second, governance is fragmented between national and local levels. Although local authorities are expected to develop Local Transport Plans, they have limited legislative or financial powers to enable strategic policymaking (McTigue et al., Reference McTigue, Monios and Rye2018). Third, national bus funding has not only diminished since 2009 but also frequently changed direction in terms of priorities, which further complicates local strategic policymaking. Because of these three characteristics, bus policymaking and implementation has been piecemeal, fragmented, and relatively ineffective in addressing persistent problems. Aiming for ambitious reform, the recent National Bus Strategy has increased the political priority of and funding for buses but remains a rather top-down policy. Its future success will therefore depend on local uptake and implementation and on the degree to which users will return to buses.
5.5 The Cycling System
5.5.1 Techno-Economic Developments
Basic bicycle technology has long stabilised, although innovations continue to be made, for example, folding bikes and electric bicycles. The average price of new UK bicycles was £427 in 2016 (Newson and Sloman, Reference Newson and Sloman2018). Sales of new bicycles fluctuated between 3 and 3.6 million per year between 2003 and 2016 (Conebi, 2017).
UK cyclists mostly share road infrastructures with cars, vans, buses, and lorries. Only a few UK cities (e.g., London, Brighton) have infrastructures with separate cycling lanes, although other cities have recently begun to follow suit.
The post-war transition towards cars was accompanied by a steep decline in British cycling from 23 billion passenger-kilometres in 1952 to 6 billion in 2019 (Figure 5.25). This represented a reduction from 11% of all passenger kilometres travelled in 1952 to 0.7% in 2019. Since the mid-2000s, British cycling has been on an upward trend, but it remains a very small regime with stabilised rules and practices, carried by relatively small social networks. UK cycling is low by EU standards (Pucher and Buehler, Reference Pucher and Buehler2008), accounting for less than 1% of travel distance and 2% of trips (Table 5.1). The pandemic was an external shock that triggered a relatively rapid 46% increase in cycling in 2020 (DfT, 2021d), with particularly large expansion during and immediately after the first lockdown (Figure 5.26).

Figure 5.25 Passenger kilometres by pedal bicycles, Great Britain, 1952–2019, in billion kilometres

Figure 5.26 Daily use of bicycles in Great Britain between March 2020 and July 2021; figures are percentages of an equivalent day or week
5.5.2 Actors
Firms: UK companies produce only a small quantity of bicycles, about 80,000 per year. The largest UK company is Brompton, which produces folding bikes. Most bicycles are imported from the Far East, principally Vietnam, Cambodia, China, and India. Bicycle sales account for about half of the total value of the bicycle retail market with the other half derived from sales of accessories, clothing, tyres, repairs, and maintenance (Newson and Sloman, Reference Newson and Sloman2018).
Users: Cycling remains a marginal activity in the UK, perceived by most people as good for recreation or commuting daredevils but not for many other purposes. Bicycle use concentrates in cities with favourable conditions (e.g., London, Cambridge, Oxford, Brighton). In London, cycling has seen the fastest relative growth of all transport modes (Figure 5.18), especially for commuting purposes (Aldred and Jungnickel, Reference Aldred and Jungnickel2014). Between 2001 and 2018, cycle flows across central London increased by 340% (Figure 5.27). Nevertheless, cycling still only accounted for 1.5% of all passenger-kilometres in London in 2018.

Figure 5.27 Trend in cycle flows (in thousand cycles per day) across central cordon, 1977–2018
The majority (62%) of London’s cyclists are male, 38% female. Most of London’s cyclists are young urban professionals: 32% are from the 25–34 age group, 27% from the 35–44 age group, and 16% and 15% respectively from the 16–24 and 45–54 age groups (TfL, 2015). The main motivations for London’s cyclists are increased fitness, and travel time and money savings. The main deterrents mentioned by non-cyclists are safety concerns, bad weather, health reasons, lacking accessibility, and limited confidence (De Boer and Caprotti, Reference De Boer and Caprotti2017).
The COVID-19 shock created opportunities for cyclists because the first lockdown in particular substantially reduced car traffic (Figure 5.4). On some days during and after the first lockdown cycling was more than 300% above pre-pandemic levels (Figure 5.26), as people cycled for their daily exercise on quiet roads. As lockdowns were lifted and car traffic returned to pre-pandemic levels (Figure 5.4), cycling also returned to pre-2020 levels in most places (Figure 5.26), which suggests that the cycling increase may not be a long-term structural trend. Some cities such as Manchester, however, report that cycling in July 2021 was still 20% above pre-pandemic levels (Laker, Reference Laker2021).
Policymakers: Cycling policy was non-existent before the 1990s. The 1996 National Cycling Strategy was followed in 2000 by the 10-Year Transport Plan, which aimed to triple cycling trips in a decade. This goal was not reached, however, and cycling trips actually decreased in the subsequent decade. Reasons for this policy failure are the following: a) limited political will to systematically invest in cycle networks with separate lanes, b) perception of cycling as peripheral in transport policy, c) absence of specialised expertise in most local authorities, d) misalignment between national and local cycling policies, e) public perceptions of cycling as dangerous (Aldred, Reference Aldred2012; Pooley et al., Reference Pooley, Horton, Scheldeman, Tight, Jones and Chisholm2011).
There has been some national funding for local cycle lanes and parking facilities (via the Local Sustainable Transport Fund and Cycle City Ambition Grants), but the stop-start dynamics of these schemes resulted in ad-hoc schemes rather than the building of interlinked cycling infrastructures. London has been an exception, because Mayor Boris Johnson (2008–2016) actively supported cycle hiring schemes and the development of London’s Cycle Network. Several other cities (e.g., Cardiff, Newcastle, Bristol, Edinburgh, Leeds, Manchester) have also begun cycle infrastructure construction.
The COVID-19 shock, which disrupted most transport modes but boosted cycling, provided a window of opportunity for national policies and local initiatives to further support cycling. In May 2020, the Johnson government introduced a £250 million emergency active travel fund, which aimed to help city councils to reallocate road space to cyclists and pedestrians by creating dedicated cycle paths, pop-up bike lanes (using cones or flexible wands), and cycle and bus-only corridors.
In July 2020, the government introduced a new cycling strategy, which advanced the bold vision of a ‘travel revolution in our streets, towns and communities’ with ‘half of all journeys in towns and cities being cycled or walked by 2030’ (DfT, 2020b: 12). The vision, which was reportedly pushed by Johnson himself (Laker, Reference Laker2020), was accompanied by 33 specific commitments for active travel and £2 billion funding over a five-year period to enable local councils to make on-the-ground changes. This top-down push resulted in many local initiatives so that by July 2021 sixty miles of new segregated cycle lanes on main roads have been constructed in London and forty miles in other cities, including active ones such as Manchester and Leicester (DfT, 2021e). But many other councils (including Liverpool, Brighton, Surrey, Kensington and Chelsea, Ealing, Wandsworth, South Gloucestershire, Trafford, Portsmouth) initially created (temporary) cycle lanes and low-traffic neighbourhoods but then later removed them in response to protests from car drivers, local residents, and other interest groups (Walker, Reference Walker2021).
Frustrated about these local implementation problems, transport minister Heaton-Harris on 30 July 2021 wrote a letter to all local authorities with transport responsibilities, urging them to give active travel schemes a chance to bed in and warning them that they could lose future central government funding if they removed these schemes without sufficient evidence.Footnote 7 These tensions suggest that the success of the ambitious top-down cycling strategy is uncertain, depending not only on political struggles between national and local policymakers but also on social acceptance processes in cities and towns, which are likely to vary in terms of the actors involved and stakeholder consultation and governance processes.
Wider Publics: In most British towns ‘cycling is not seen as normal’ (Pooley et al., Reference Pooley, Horton, Scheldeman, Tight, Jones and Chisholm2011: 1604). Many people perceive cycling as dangerous, because of the lack of dedicated cycle lanes. Bicycle accidents receive much attention in the media, which contributes to negative perceptions, despite impressive safety improvements since 1970. But although the fatality rate of cyclists (per billion passenger miles) decreased by 43% between 2006 and 2019 (DfT, 2020c), cycling is still fairly dangerous compared to other transport modes, with relatively high rates of casualties (deaths and injuries) and fatalities (deaths) (Table 5.4). People also tend to perceive cyclists as risk-takers and ‘not like me’, which is reinforced by the wearing of materials such as lycra and high-visibility clothing (De Boer and Caprotti, Reference De Boer and Caprotti2017).
Table 5.4. Casualty and fatality rates per billion passenger miles by road user type in Great Britain (DfT, 2020c: 10)
| Casualty rate | Fatality rate | |
|---|---|---|
| Pedestrian | 1,640 | 35.4 |
| Cyclists | 4,891 | 29.0 |
| Motorcyclists | 5,051 | 104.6 |
| Car drivers | 195 | 1.6 |
| Bus passengers | 141 | 0.6 |
Nevertheless, public perceptions have improved in recent years due to positive storylines that frame cycling as good for the environment (e.g., climate change, local air pollution) and for health (as a form of exercise that may help mitigate increasing obesity problems).
5.5.3 Policies and Governance
Cycling has low policy priority and thus has long been marginalised. UK transport governance is fragmented between national and local levels. The national government published a cycling strategy in 1996 and a walking and cycling action plan in 2004 but did not follow up with sustained implementation activities. Cycling strategies thus remained little more than aspirations, leading to a pattern of over-promising and under-delivering.
One reasonably effective policy was the Cycle to Work scheme, introduced in 1999 and amended but maintained since then, which supported workers’ bicycle purchases with tax exemptions and company-provided employee benefits. In 2016, about 150,000 bicycles were bought using this scheme (Conebi, 2017).
There has been some national funding for local cycling schemes and infrastructures, but this has remained ad-hoc and fragmented. ‘Outside of London there is little sense of policy coherence and the amount of money available tends to be small. … The problem is that, at the national level at least, successive governments have failed to demonstrate the leadership necessary to raise the profile of walking and cycling above its current moribund state’ (Shaw and Docherty, Reference Shaw and Docherty2014: 70–71).
The exception has been London, where Mayor Boris Johnson introduced a comprehensive bicycle hiring scheme in 2010, modelled on the successful Lyon and Paris systems. And in 2012, he committed to spend £913 million over a nine-year period to improve cycling infrastructures. ‘The one city to benefit from considerable cycling investment has been London, where a massive increase in cycle use, stimulated from the grassroots largely by young people commuting to the central zone, has almost forced local politicians to respond’ (Wolmar, Reference Wolmar2016: 99).
The government’s new 2020 cycling strategy, introduced in response to the COVID-pandemic, aims to replicate London’s relative success across other cities, using £2 billion funding over five-years to support local cycling infrastructure initiatives. Additionally, the government published an updated Cycle Infrastructure Design Guidance in July 2020 to provide technical design advice, issued new statutory Network Management Duty guidance that advises local authorities on reallocating road space to encourage cycling and walking, and published a Local Transport Footnote Note 1/20 with detailed design guidance for safe high-quality cycling infrastructure. The government also announced the creation of a new body for cycling and walking (Active Travel England), which from Autumn 2021 will oversee funding applications and inspect finished schemes.
While these new initiatives represent attempts at more active and interventionist governance for cycling, its top-down style and emphasis on financial carrots and sticks, combined with technical advice, may insufficiently address social acceptance problems that could scupper its success.
5.6 Niche-Innovations
This section analyses six niche-innovations, which have considerable carbon-reduction potential. Electric vehicles and biofuels are about the greening of cars. Tele-working, car-sharing, and ride-hailing are about technology-enabled changes in mobility practices. Intermodal transport innovations such as smart cards and mobility services create new linkages between transport modes. And self-driving cars are about changes in technology and behaviour, with potential transformative effects on how the automobility system functions. For each niche-innovation, we analyse techno-economic and socio-political developments.
5.6.1 Electric Cars
Techno-Economic Developments
Electric vehicles are modular innovations that substitute the internal combustion engine (ICE) with an electric motor and battery but leave many other parts of automobility systems unchanged. They do, however, require a new battery recharging infrastructure, and may also benefit from lighter car bodies (e.g., by replacing steel with composite materials).
There are different kinds of electric vehicles with varying technical and environmental characteristics. Battery-electric vehicles (BEVs) only use batteries and electric motors, as just described, which is a simpler configuration than ICE-vehicles as it removes the need for components such as crank shafts, pistons, and transmission. Hybrid-electric vehicles (HEVs) are more complex configurations involving both an ICE and electric motor, which can operate in serial mode (with a small ICE powering a battery that feeds the electric motor) or parallel mode (in which ICE and electric motor can both drive the wheels) to optimise fuel efficiency. A plug-in hybrid electric vehicle (PHEV) primarily uses its electric motor and battery, which can be charged from the grid, but switches to an ICE when the battery runs out of power. BEVs and PHEVs qualify as Ultra Low Emission Vehicles (ULEV) in the UK, because they emit less than 75 g of CO2/km and can operate in zero-emission mode for at least 10 miles.Footnote 8
Sales of different kinds of electric cars have steadily increased over the past two decades, cumulatively reaching 20.8% of all passenger car sales in 2020 due to increased electric vehicle sales (Figure 5.28) and decreased overall sales (Figure 5.10). HEV sales reached 163,700 in 2020, representing 10.1% of the UK market. Annual BEV and PHEV sales respectively increased to 106,700 and 66,600 in 2020 (Figure 5.28), representing 6.6% and 4.1% of the market. In 2020, HEVs, PHEVs, and BEVs accounted for respectively 2.1%, 0.6%, and 0.6% of the total car fleet (based on data from DfT’s Vehicle Statistics dataset, Table VEH0203).

Figure 5.28 Annual electric car sales (new vehicle registrations) in Great Britain in thousands, 2001–2020
While HEVs reduce CO2-emissions by about 25% compared to ICE vehicles (Kay et al., Reference Kay, Hill and Newman2013), BEVs and PHEVs promise deeper reductions (depending on the degree of electricity decarbonisation). Electric car purchase prices are still substantially higher than for comparable conventional cars: about £8,000–16,000 extra for BEVs, £7,000 for PHEV, £2,400 for HEVs (Kay et al., Reference Kay, Hill and Newman2013; Nilsson and Nykvist, Reference Nilsson and Nykvist2016). While a new Volkswagen Golf cost about £20,280 in 2020, the unsubsidised electric version (ID-3) cost around £29,990 (Jolly, Reference Jolly2020b). Electric vehicle purchase subsidies, discussed later, reduce but do not close the price gap.
Battery costs particularly push up electric vehicle prices, but power electronics and electric motors also contribute. The price of Li-ion battery packs has decreased by almost 90% between 2010 and 2020 (Figure 5.29), owing to learning-by-doing and scale economies. Once battery pack prices fall below $100/kWh, which is expected to happen between 2023 (BNEF, 2020) and 2025 (Nykvist et al., Reference Nykvist, Sprei and Nilsson2019), BEVs will become cost-competitive with conventional cars. But successful competition also requires improvements in other performance parameters: BEV-ranges should double to 300–500 km (which requires battery capacity of 50–100 kWh), while charging times should be reduced to 10–15 minutes.

An electric charging infrastructure is gradually being built in the UK, consisting of both public chargers (in communities, at supermarkets, along motorways) and private chargers at people’s homes. The number of public electric vehicle charging devices has increased five-fold since 2015, reaching 18,265 in July 2020. The number of rapid public charging devices grew more slowly, reaching 3,206 in 2020 (Figure 5.30). Rapid chargers (which operate at 50–100kW) can recharge average electric vehicles from empty to 80% full in about 30 minutes. Slow chargers at home (operating at 3–7kW) take between 5 and 10 hours, depending on the car’s battery size.

Figure 5.30 Number of public electric vehicle charging devices in the UK
The geographical distribution of charging devices is uneven, which means that long-distance trips require careful planning. London has the greatest number and highest density (Table 5.5). Scotland also has relatively high density. Many other parts of the country have fewer and lower density charging devices. Densities are higher in cities such as Manchester, Milton Keynes, or the Midlands (SMMT, 2016). Further electric vehicle diffusion will require more rapid charge points and greater geographical coverage. Another problem that needs to be addressed is the lack of standardisation of public charging devices, which presently exist in a variety of sockets, power ratings, and payment methods.
Table 5.5. Geographical distribution of public electric vehicle charging devices in July 2020 (data from Statistics at DfT; Electric Vehicle Charging Device Statistics; Table ECVD 01)
| Total devices | Devices per 100,000 of population | |
|---|---|---|
| London | 5,151 | 57 |
| Scotland | 1,910 | 35 |
| North East | 812 | 30 |
| South East | 2,478 | 27 |
| South West | 1,416 | 25 |
| Wales | 648 | 21 |
| East Midlands | 962 | 20 |
| North West | 1,476 | 20 |
| East of England | 1,119 | 18 |
| West Midlands | 1,030 | 17 |
| Yorkshire and the Humber | 951 | 17 |
| Northern Ireland | 312 | 16 |
Actors and Policies
The gradually accelerating diffusion of electric vehicles has co-evolved with car company strategies. Early developments were driven by diversifying incumbent automakers such as Toyota, which introduced the Toyota Prius (HEV) in the late 1990s, and new entrants such as Tesla, which in 2006 introduced the high-end Tesla Roadster that positively changed the public perception of BEVs (Penna and Geels, Reference Penna and Geels2015).
Since then, perceptions and strategic orientations of global automakers towards electric vehicles have changed from reluctant engagement to a strategic innovation race (Bohnsack et al., Reference Bohnsack, Kolk, Pinkse and Bidmon2020). Between 2006 and 2009, many automakers perceived electric vehicles (EVs) as a necessary evil they had to engage with (in the form of R&D, prototypes, and concept cars), partly to keep up with new entrants (e.g., Tesla) and first mover incumbents (e.g., Toyota, Mitsubishi, Nissan, and General Motors), and partly in response to increasing climate change concerns from policymakers and the wider public. Between 2010 and 2015, more incumbent car companies began to diversify towards EVs. Although industry perceptions of EVs became more positive, full commitment was delayed by doubts about whether EVs were developed for sustainability or commercial reasons (Bohnsack et al., Reference Bohnsack, Kolk, Pinkse and Bidmon2020). After 2015, this perceived dilemma mostly disappeared because increasing sales and tightening climate regulations convinced the industry that EV diffusion was driven by both sustainability and commercial reasons. Between 2016 and 2018, global automakers indicated their new strategic commitment with ambitious electric vehicle targets (Table 5.6), which were gradually increased in subsequent years. An indication of investors’ future expectations is that by January 2021, Tesla’s market valuation of $800bn was higher than the combined value of Toyota, Volkswagen, Daimler, General Motors, and Hyundai (The Economist, 23 January 2021).
Table 5.6. Examples of car manufacturers’ commitments on electrification (CCC, 2018: 167)
| Manufacturer | Timing | Commitment |
|---|---|---|
| Nissan | 2025 | BEVs 50% of sales in Japan and Europe |
| Mercedes | 2025 | BEVs 15–25% of sales |
| Volkswagen | 2025 | EVs 25% of sales |
| Porsche | 2030 | EVs 100% of sales |
| Toyota | 2030 | EVs and conventional hybrids 50% of sales |
| Volvo | 2030 | EVs and conventional hybrids 50% of sales |
| Honda | 2030 | BEVs, PHEVs, and hydrogen 15% of sales |
The reorientation to electric vehicles is demanding for automakers and their supply chains. Car companies are investing large sums to build new factories and acquire new technical skills, which also leads to new collaborations. Additionally, a new supply sector is being created to produce enough batteries and electric motors for the expected electric vehicle boom.
The purchase costs of electric vehicles are still higher than for normal cars, even with subsidies. Early adopters therefore tend to be mostly middle-aged, male, well-educated, affluent urbanites with pro-environmental attitudes, a desire to save money on fuel costs, and an active interest in new technology (Nilsson and Nykvist, Reference Nilsson and Nykvist2016). While it is sometimes claimed that consumers have ‘range anxiety’ regarding BEVs (fear of being stranded with empty batteries), research suggests that most users develop new skills and competencies to deal with this (Ryghaug and Toftaker, Reference Ryghaug and Toftaker2014). Increases in BEV ranges and charging points also increasingly alleviate this concern. HEVs and PHEVs have fewer range problems, because they can drive on normal fuels when their shorter electric-drive range (30–90 km) is exhausted.
UK policymakers have increasingly supported electric vehicles since the late 2000s, when biofuels encountered problems and electric vehicle expectations increased again. New organisations were created to support innovation and coordination between upstream actors. The Office for Low Emission Vehicles (OLEV) was created in 2009 to coordinate interactions between automakers, policymakers, and research organisations. The Automotive Council was created in 2009 to coordinate automakers and suppliers to develop an industrial strategy and roadmap. The Advanced Propulsion Centre was created in 2013 to position the UK as a global leader in low-emission powertrain research and development. To support this ambition, the government and automotive industry agreed to both invest £500 million, totalling £1 billion over 10 years (Skeete, Reference Skea, van Diemen, Hannon, Gazis and Rhodes2019).
From 2011 to 2015, OLEV disbursed £400 million government funds to support R&D projects, build recharging infrastructure (via the Plugged-in Places scheme), and provide consumer adoption incentives for ULEVs. The government has allocated another £500 million for the 2015–2020 period to develop the ULEV market via a range of initiatives under the Go Ultra Low brand.
Various policies aim to stimulate electric vehicle adoption. In 2011, policymakers introduced the Plug-in Car grant, which paid 25% of BEVs and PHEVs up to £5,000. In 2018, this grant was cut to £3,500 for battery electric vehicles and removed for plug-in hybrid vehicles. In March 2020, the grant was further reduced to £3,000, followed by another reduction (to £2,500) in March 2021 (Jolly, Reference Jolly2021a). BEVs were also exempted from the Fuel Duty, Company Car Tax, and Vehicle Excise Duty.Footnote 9 In 2014, the government also introduced the Electric Vehicle Homecharge Scheme, which covered up to 75% of the installation costs of domestic recharging devices for BEVs or PHEVs, capped at a maximum grant of £900. The maximum cap was revised to £500 in 2018 and £350 in 2020 (OLEV, 2020). The typical cost of a home charger point in 2020 was around £800.
The government’s phase-out plans of petrol and diesel cars, first announced in 2017 and sharpened in 2020, also support electric vehicles by creating mass markets. From 2030, all new vehicle sales will be hybrid or pure electric. By 2035, only pure electric vehicles will be sold. These phase-out policies not only aim to create mass markets for electric vehicles but also to signal to car companies that the UK is a good place to build new manufacturing plants.
The government’s Clean Growth Strategy (BEIS, 2017a) also aimed to attract automakers to the UK for investing and building electric vehicle manufacturing plants. Results have been mixed because Brexit created trade-related uncertainties and complications and because other countries with similar aims may appear more attractive to automakers (Campbell et al., Reference Campbell, Pfeifer and Pooler2019). Tesla explored opening a new Gigafactory (for batteries and cars) in the UK, but in 2019 Brexit concerns made it opt for Germany instead. In 2017, Toyota invested 240 million into modernising its Derby car plant to produce the third generation Auris (a hybrid electric vehicle), but in 2020 announced that it would postpone further UK electric vehicle investments until 2027 (Jolly, Reference Jolly2020c). Jaguar Land Rover committed to building electric vehicle and battery manufacturing plants in the UK, and in 2021 announced that its Jaguar brand would only come as an electric vehicle by 2025 (Jolly, Reference Jolly2021b). BMW decided that it would assemble the electric Mini in the UK but use batteries shipped from Germany (Campbell et al., Reference Campbell, Pfeifer and Pooler2019). Nissan announced in July 2021 that it would invest £1 billion in an electric battery plant and electric car manufacturing in Sunderland. Also in July 2021, Vauxhall’s new owner Stellantis announced it would invest £100 million in its Ellesmere Port plant to build electric vans. Both of these investment decisions were facilitated by generous government subsidies, reportedly £100 million for Nissan and £30 million for Stellantis (Ambrose and Vinter, Reference Ambrose and Vinter2021).
5.6.2 Biofuels
Techno-Economic Developments
Biofuels are produced from biomass feedstocks, which can be grown specifically for processing into fuel or are waste products. The two main biofuel forms are biodiesel and bioethanol, which can be blended relatively easily with conventional fuels.Footnote 10 Although biofuels can be produced from many feedstocks and through many processes, it is common to distinguish three different generations (RAE, 2017):
First generation biofuels are produced from food or animal feed crops such as sugar cane, sugar beet, corn, and wheat (for bioethanol) or palm oil, soybean oil, and rapeseed oil (for biodiesel).
Second generation biofuels are produced from non-food related feedstocks, including dedicated lignocellulosic energy crops (such as Miscanthus or switchgrass), organic waste (e.g., agricultural residues, wood wastes), and other waste materials (e.g., used cooking oil and municipal solid waste).
Third generation biofuels are produced from microalgae (RAE, 2017).
Biofuel use in the UK increased between 2004 and 2010, then stagnated, and increased again after 2017 (Figure 5.31), reaching 4.5% of road transport fuel (in real terms) in 2019 (Figure 5.32). This is relatively low by European and international standards (RAE, 2017). A 2011 revision of European rules allowed double counting for sustainable biofuels, which led to increasing divergence between real and reported transport biofuel use (Figure 5.32).

Figure 5.31 Biofuel use in UK transport 2004–2019 (excluding aviation), in million tons oil equivalent

Figure 5.32 Real and adjusted percentage of biofuels in road transport fuel use, 2005–2019
These new European rules triggered a substantial shift from first to second generation biofuels based on waste feedstocks, which qualified for double certification. Inputs for biodiesel shifted from soy and rapeseed towards used cooking oil, which by 2019 accounted for the great majority (79%) of biodiesel. Inputs for bioethanol shifted from sugar cane to corn, which by 2019 accounted for 43% of bioethanol (DfT, 2020d). The technologies for processing these inputs are well-known. Processing technologies for lignocellulosic biomass and algae are still under development, and not commercially used in the UK.
In 2019, the large majority (89%) of biomass feedstock was imported, mainly from China (especially cooking oil), United States, Spain, and France (DfT, 2020d). Biofuels are more expensive than fossil fuels, which is why diffusion has been stimulated by public policies.
Actors and Policies
The 2003 European Biofuels Directive stipulated that member states should replace 5.75% of all transport fossil fuels with biofuels by 2010. To implement this Directive, the UK introduced the Renewable Transport Fuel Obligation (RTFO) in 2005, which stipulated increasing biofuel targets that large transport fuel suppliers (like BP, Shell, Esso) had to meet: 2.5% in 2008/9, 3.75% in 2009/10, and 5% in 2010/11. The RFTO also created a trading system, in which biofuel suppliers could apply for Renewable Transport Fuel Certificates (RTFCs). Obligated fuel suppliers are required to acquire RTFCs in proportion to the volume of fossil fuel they supply (RAE, 2017). Until 2012, policymakers also stimulated biofuels with a 20 pence per litre fuel tax (duty) exemption.
In the absence of domestic biofuel production capacity, UK fuel suppliers initially imported biofuels, especially from Brazil and the United States. Domestic bio-refining capacity was gradually developed, with the first biofuel production plant opening in 2005. By 2013, there were 11 large-scale and more than 60 small-scale factories (Ecofys, 2014), with over 1,500 million litres annual production capacity, not all of which was used, owing to rule changes that restricted demand.
These rule changes related to a controversy over the negative environmental consequences of rapidly increasing first generation biofuels. Around 2007, UK environmental NGOs launched vocal protests against biofuels, because of unintended negative effects, including CO2 emissions from indirect land-use change and competition with food production. In response, the UK government implemented the Gallagher Review, which in 2008 recommended a precautionary approach and pull-back from original targets (Harvey and Pilgrim, Reference Harvey and Pilgrim2013). The government accepted the recommendations and, in 2009, down-scaled the RTFO-targets to 3.25% for 2009/10, 3.5% for 2010/11, 4% for 2011/12, 4.5% for 2012/13, and 4.75% for 2013.
The biofuel controversy also affected European policies. The 2009 European Renewable Energy Directive (RED) not only set new targets for 10% renewable transport fuels by 2020 but also introduced stronger sustainability criteria such as an increase of life-cycle CO2 savings from 35% in 2011 to 50% in 2017. To stimulate a shift from first to second generation biofuels, the RED also allowed double counting of more sustainable biofuels such as wastes, residues, and non-food cellulosic material.
The lower than expected market demand and changing UK biofuel feedstocks created challenges for the UK’s emerging biofuel manufacturing industry, leading to some factory closures (Ecofys, 2014). Smaller producers also struggled to sell RTFCs directly to obligated fuel suppliers and handle complex certification procedures (RAE, 2017). Consequently, the industry was increasingly dominated by large-scale operators.
After keeping the RFTO target at 4.75% for several years, UK policymakers introduced an upward increasing trajectory for the target to 7.25% in 2018, 8.50% in 2019, 9.75% in 2020, and further gradual increases until 12.40% in 2032. These policy changes, which boosted road transport biofuel use in 2018 and 2019 (Figures 5.31 and 5.32), also aim to further reduce first generation crop-based biofuels and stimulate advanced waste-based biofuels. So, despite an increasing policy focus on electric vehicles, discussed previously, there is also a new push for biofuels, aimed not only at passenger cars but also at aviation and freight transport, which are strategic but hard to decarbonise sectors. As part of its 2020 Transport Decarbonisation Plan, the government also decided to support four new biofuel plants. Two of these will be funded from the £20 million Future Fuels for Flight and Freight Competition and two from the £25m Advanced Biofuels Demonstration Competition.
5.6.3 Tele-work
Techno-Economic Developments
The emergence of an information society gave rise to the idea that tele-working (i.e., ‘working at home’ with the use of computers, internet, and other information and communication technologies) could reduce the need to commute to the office and back (Fu et al., Reference Fu, Kelly, Clinch and King2012). The number of home-workers has gradually increased from 1.9 million in 1992 to 4.3 million in 2019, amounting to 13% of the UK workforce (Figure 5.33). The percentage of employees ‘working at home’ almost doubled from 2.6% to 5% in this period. ‘Working from home’, which refers to workers such as farmers, salespeople, or construction workers who use their home as a base but work in different places, increased from 4.7 to 8.1%.

Figure 5.33 Percentage of working population working ‘at home’ and ‘from home’, 1992–2020
In April 2020, the first national lockdown caused the ‘working at home’ percentage to increase to 46.6% of the working population.Footnote 11 When lockdown restrictions were relaxed, many people returned to work, which is why the ‘working at home’ percentage for the whole of 2020 is only 8.5% (Figure 5.33).
Actors and Policies
Tele-working is a new social practice within the wider work regime, which is facilitated by mobile phones, laptops, and the Internet. Tele-working is particularly feasible for various kinds of knowledge workers who process data and information. Until 2020, the growth in ‘working at home’ has indeed come mostly from occupational categories with highly skilled roles in the economy, such as managers or senior officials, professionals, associate professionals, and skilled technical occupations (Figure 5.34). During the pandemic, it was also those highly skilled groups that were able to substantially shift their work activities online, while most occupational groups (except administrative and secretarial jobs) were far less able to do so.

Figure 5.34 Major occupational groups (from ONS categorisation) in the ‘working at home’ category, 2012–2020
Changes in organisational practices, increased use of video- and tele-conferencing, and the ability to create dedicated office space in their homes also enabled highly skilled occupational groups to keep ‘working at home’ (at least partly) once lockdown restrictions were lifted. Although these processes are still unfolding, it is likely that increased ‘working at home’ will represent a long-term structural change for these occupational groups.
Even before the COVID-pandemic, the effects of tele-working on mobility were not straightforward, because of the diversity in people’s motivations (Haddad et al., Reference Haddad, Lyons and Chatterjee2009). Some people tele-worked a few hours in the morning, to avoid the rush hour, or in the evening, after a day in the office (Alexander et al., Reference Alexander, Dijst and Ettema2010), neither of which reduces the amount of travel. They also worked on their laptop while they travelled on public transport modes (Felstead, Reference Felstead2012). Homeworkers also made some additional daytime journeys (e.g., visiting friends) to compensate for a lack of social interaction. So, the relative importance of mobility substituting and inducing effects of tele-working is an ongoing debate in transport studies (Cohen-Blankshtain and Rotem-Mindali, Reference Cohen-Blankshtain and Rotem-Mindali2016).
It is clear, however, that work temporalities have become more flexible than the standard 9-to-6 template (Alexander et al., Reference Alexander, Dijst and Ettema2010) and that the gradual increase in tele-working aligns with this trend. There has been no dedicated UK policy to stimulate tele-working. Before the pandemic, few employees wanted to work from home for most of the time, because the office was still seen to offer a range of benefits such as social contact, visibility, and influence on organisational politics (Fu et al., Reference Fu, Kelly, Clinch and King2012). In the UK and Ireland, tele-work in the 2010s ‘remained a marginal work practice for several reasons … lack of legitimacy due to the absence of regulation, the ad-hoc arrangements that have ensued, the lack of support from management, the absence of training or direction, the dominance of the existing regimes of automobility and traditional ways of working’ (Hynes, Reference Hynes2016: 25). So, while work regimes were becoming more fluid and spatially diverse, shifts towards tele-working were relatively gradual.
The pandemic clearly was an exogenous landscape shock that boosted the diffusion of the tele-working niche, which had gradually developed and stabilised in preceding years. Tele-working’s long-term effects on mobility are not yet clear, and also depend on how structural its mass adoption will be, which is likely to vary between occupational groups. Effects on automobility, which has rebounded to pre-pandemic levels (Figure 5.4), are not yet observable. As video- and tele-conferencing have become more widely accepted, it is also possible that tele-working will reduce business travel via airplanes or trains. Since business travel is the third largest category (accounting for 17%) of rail travel (Figure 5.21), this would have implications for railway investments, including HS2, as noted in Section 5.3.2.
5.6.4 Car Sharing, Ride Hailing, and Ridesharing
Techno-Economic Developments
The use of smartphones, Global Positioning Systems (GPS), computers, internet platforms, and other digital technologies stimulated the emergence and expansion of multiple transport-related social and business model innovations in the last decade.
Car sharing schemes (or car clubs) are short-term, membership-based car rentals booked online in advance. Users pay an (relatively low) annual membership fee and a fee depending on the duration of use. They collect the booked vehicle from a designated car parking space (‘back-to-base scheme’) or locate it in a circumscribed area using a smartphone app (‘free-floating schemes’).
Ride-hailing services are provided by digital platforms (e.g., Uber) that connect licensed taxis or Private Hire Vehicles with passengers in real-time, often within minutes. Unlike traditional taxi operators, these platforms do not own taxi fleets but provide booking, payment, and rating services. For users, ride-hailing services are like taxis, except the digital platform makes their use more seamless and convenient.
Ridesharing (or carpooling) services are provided by digital platforms (e.g., BlaBlaCar or UberPool) that connect potential riders with drivers going in the same direction, enabling them to share costs. These platforms charge a use fee.
Recent platforms (e.g., Hiyacar) offer peer-to-peer (P2P) car rental services, enabling individual car owners to rent out their cars.
These new mobility options have grown rapidly in the last decade, especially in London, but they still constitute a small niche in the wider mobility system. Although UK car sharing organisations had 290,645 members in 2018, they only had 3,963 vehicles (Table 5.7), which is marginal compared to the 32 million UK car fleet (Figure 5.12). Membership growth in London (which accounted for 84% of members in 2018) has been impressive since 2010, but the number of vehicles has hovered around 2,500 (Figure 5.35).
Table 5.7. Number of car club members and cars in 2018 (constructed using data from Steer Davies Gleave (2019a, 2019b, 2019c))
| London | England & Wales | Scotland | UK total | |
|---|---|---|---|---|
| Car club members | 245,000 | 25,773 | 19,872 | 290,645 |
| Car club cars | 2,636 | 783 | 544 | 3,963 |

Figure 5.35 Number of members (left-hand axis) and number of cars (right-hand axis) in London car sharing clubs, 2010–2018
Ride-hailing has also increased substantially in recent years, especially in large cities where higher passenger densities enable this business model to compete with traditional taxis. The number of Private Hire Vehicles (PHVs) in London, for instance, increased by 78% since 2008, up to 87,745 in 2018, while the number of PHV drivers almost doubled in this period (Figure 5.36) to 106,650 in 2018. Uber, which launched in 2012 in London, has been a major driver of this growth, resulting in about 45,000 Uber-related London-based drivers in 2018. Ride-hailing is competing with traditional taxi’s (Cramer and Krueger, Reference Cramer and Krueger2016), which in London declined by 10% between 2008 and 2018 (Figure 5.36).

Figure 5.36 Number of licensed London taxis and private hire vehicles (PHVs) and drivers, 2008–2018
Reliable numbers for platform-mediated ridesharing and P2P car rental services are hard to find. Despite growth in recent years, their contribution in wider mobility provision is, so far, likely to be very small.
Actors and Policies
Although car sharing initially emerged as community person-to-person grassroots initiatives (Ornetzeder and Rohracher, Reference Ornetzeder and Rohracher2013), subsequent diffusion took the form of commercial ventures based on new business models. UK car sharing organisations purchase the vehicles, arrange insurance, and negotiate with local authorities about parking spaces. These negotiations have been challenging in London, which is by far the largest car sharing market, because they involved separate interactions with 32 boroughs. A range of companies provide car sharing services in London and elsewhere. Although start-up companies (e.g., Greenwheels, Co-wheels) pioneered UK car sharing, the business has become dominated by organisations linked to incumbent car rental and automotive firms, for example, Zipcar (Avis Group), DriveNow (BMW), E-Car Club (Europcar), Enterprise Car Club (Enterprise Rent-A-Car), Bluecity (Bolloré group, which ended Bluecity in 2020), and Car2Go (Daimler, quit London in 2014). Several companies have failed, however, indicating tough competition and value extraction challenges in a relatively small market.
Although car club membership has grown rapidly, actual use of shared vehicles is limited, as indicated by relatively small car fleets (Table 5.7, Figure 5.35). The reason is that most members use car clubs as an infrequent back-up option. In 2015/16, 44% of members never used a car club vehicle in the past year; 36% used vehicles between 1–5 times per year; only 5% of members made more than 20 car club trips a year (Steer Davies Gleave, 2016). The user segment is also quite specific, consisting mostly of highly educated, young professionals (between 25–35 years old) without children living in inner London boroughs (Akyelken et al., Reference Akyelken, Banister and Givoni2018). It remains to be seen if the appeal of car sharing will broaden in the future beyond this specific segment and if customers will use shared vehicles more than a few times per year.
London policymakers have welcomed car sharing and helped to create the Car Club Coalition in 2014 to facilitate interactions among companies, Transport for London (TfL), and London’s councils. But because car sharing is perceived as a private sector initiative, local policymakers have, so far, refrained from stimulating it over other transport modes (e.g., by offering shared vehicles reduced parking fees or exemptions from the London congestion charge). Akyelken et al. (Reference Akyelken, Banister and Givoni2018: 11) therefore conclude that policymakers have ‘not yet formed a clear vision or a strategy to benefit from the opportunities of car sharing’.
Ride-hailing platforms have grown rapidly in recent years because they offer a more convenient, real-time service that also tends to be cheaper than traditional taxis. App-based ride-hailing is particularly popular with younger people living in inner London, who most frequently use it to travel to or from a night out and to or from airports (TfL, 2019). Although Uber is London’s largest ride-hailing platform, others have emerged in recent years (e.g., Wheely, Hail, Bolt, Kabbee, GetTaxi). Uber has faced challenges from traditional taxi-drivers and has, since 2017, been involved in licensing struggles with Transport for London (TfL) over its business model, which does not include health insurance, sick pay, or accident and injury protection for drivers, whom Uber sees as independent entrepreneurs rather than employees. Although Uber made operational changes, legal struggles continued for several years, creating complications and uncertainties that led to some decline in Uber-related drivers (Figure 5.36). In September 2020, courts granted Uber a new license. But in February 2021, the UK Supreme Court ruled that Uber drivers should be treated as workers and receive minimum wages and paid holidays (Butler, Reference Butler2021), which is likely to substantially affect Uber’s financial business model.
Although new platform mobility services such as car sharing or Mobility-as-a-Service (which is discussed later) hold potential, they have, so far, not been transformative due to their small-scale, narrow user segment, and ambiguous position between public and private transport regimes. They presently fill and exploit gaps between these regimes, but it remains uncertain if they will trigger wider reconfigurations: ‘The current wave of lean platforms are largely interstitial and ephemeral, rather than transformative, realized in the gaps between the scale of central city walking and that of region-serving commute infrastructure’ (Stehlin et al., 2020: 1263).
5.6.5 Intermodal Transport
Techno-Economic Developments
Innovations to stimulate intermodal transport, which refers to the use of two or more transport modes in the same journey, can take many forms, but generally aim to create new linkages between transport modes that facilitate easy transfer. Well-established options such as park-and-ride facilities are car parking lots with good public transport connections. They can enable car drivers to park at the edge of cities and use public transport to travel to city centres. Likewise, kiss-and-ride parking spots enable car drivers to easily drop friends or relatives off at public transport modes.
Intermodal ticketing or smartcards (which use a microchip to store, process, and write data) is a more recent innovation, which can be used to pay electronically for different public transport modes, thus contributing to a seamless intermodal travel experience. Smartcards can also accelerate payment, especially in buses where current cash payments delay travel.
Smartcards, which are credit-card sized cards, diffused substantially from less than 50,000 in the 1990s to more than 3.7 billion public transport journeys in 2013 (Slavin, Reference Skjølsvold and Coenen2014). Most smartcard journeys are made in London, where the Oyster card became the dominant fare medium, until contactless credit cards took over. Outside London, only 700 million smartcard journeys were made in 2013 (Slavin, Reference Skjølsvold and Coenen2014).
Mobility-as-a-Service (MaaS) is a more recent technical and commercial package that integrates different mobility services (e.g., public transport, car sharing, bike sharing, taxi) using a single digital platform that provides intermodal journey planning, booking, payment, and real-time information (Kamargianni et al., Reference Kamargianni, Li, Matyas and Schafer2016). Members can use MaaS either as Pay-as-You-Go or buy advance mobility packages to suit their travel needs. The promise of smooth and efficient intermodal mobility services has generated policy and academic enthusiasm, because of the hope that MaaS may enable a shift away from ownership and use of private cars (Finnish Transport Agency, 2015; Shaheen and Chan, Reference Shaheen and Chan2016; Transport Systems Catapult, 2016). Although MaaS systems have been trialled since the mid-2010s in a few dozen, mostly European, cities (e.g., Stockholm, Amsterdam, Birmingham, Helsinki, Basel, Vienna), ‘the cases of MaaS are, thus far, few as well as limited in terms of numbers of users’ (Smith et al., Reference Smith, Stirling and Berkhout2020: 163). ‘The performed pilots have thus far been small-scale. Moreover, very few of the services have been systematically evaluated’ (Smith and Hensher, Reference Smith, Stirling and Berkhout2020: 54). UK demonstration projects are taking place in Scotland and Birmingham to explore technological dimensions of MaaS (e.g., smartcard payment mechanisms, online booking systems), social acceptance, and business models (Government Office for Science, 2018).
Actors and Policies
The 1998 UK Transport White Paper expressed an interest in the benefits of smartcards for transport. In 1999, the Integrated Transport Smartcard Organisation (ITSO) was created to develop interoperable standards and stimulate uptake. Diffusion proceeded more slowly than anticipated, because of technical challenges, difficult negotiations between a wide range of actors (ICT companies, data-processing firms, financial organisations, transport operators, local transport authorities), and the time it took to persuade actors to join smartcard schemes (AECOM, 2011; Blythe, Reference Blythe2004). Developments progressed fastest in London where Transport for London had governance capabilities and greater financial resources. The Oyster Card was launched in 2003 as a £1.2 billion private finance initiative scheme (Blythe, Reference Blythe2004). Developments in other UK cities have largely been piecemeal.
A 2009 national government document developed a national smartcard vision: ‘The Government’s vision is for smart and integrated ticketing across public transport in England, with the ITSO specification allowing for seamless travel, potentially across the country, using the same smartcard’ (DfT, 2009: 3). Its strategy was to first establish ITSO-compliant smartcards in the nine largest urban areas (by 2015) and then link these ‘urban islands’ of local ticketing schemes with corridors of intercity transport. Local Transport Authorities were meant to drive local smartcard implementation, acting as coordinating bodies between transport operators and other organisations. By 2013, however, the government recognised the scale of the task and the difficulties involved, in particular the need for ‘new business processes and commercial agreements. These may be complex and difficult to negotiate’ (DfT, 2013: 27). Although some cities (e.g., Manchester) have since introduced smartcards, other integrated payment options such as smartphones and contactless credit cards are now more dominant.
The concept of Mobility-as-a-Service (MaaS) started in Finland and Sweden in the early 2010s, supported by innovation agencies, transport ministries, city transport agencies, and IT companies, with the aim of developing new digital products and services (Pangbourne et al., Reference Pangbourne, Mladenovic, Stead and Milakis2020). The concept then spread to other countries such as the Netherlands, Germany, and the UK, accompanied by visions that promised multiple benefits such as enhanced freedom and choice for citizens (i.e., the availability of multiple travel modes), increased comfort and convenience for citizens (i.e., door-to-door mobility services), optimised network flows and higher efficiency for transport authorities (i.e., better utilisation of public and private transport assets), improved sustainability for city authorities (e.g., less congestion, less emissions), and new business opportunities (Pangbourne et al., Reference Pangbourne, Mladenovic, Stead and Milakis2020). Long-term visions suggested that people might shift from privately owned cars to MaaS-type systems, enabling them to seamlessly, quickly, and efficiently use multiple transport modes, perhaps even including automated vehicles, to travel to their destinations (Sperling, Reference Levinthal2018).
Optimistic MaaS visions were disseminated in the UK by the think tank CIVITAS (2016) and the Transport Systems Catapult (2016), whose report was commissioned by the Department for Transport (DfT). MaaS Scotland, a network of 75 public and private sector organisations, was formed in 2017 to facilitate discussions between public and private stakeholders such as digital platform providers, IT and telecom companies, public transport providers, car sharing and ride-hailing companies, and national and local policymakers. MaaS Scotland started its first pilot projects in early 2020 (https://maas-scotland.com/).
Another pilot project was launched in 2017 by Birmingham’s public transport authority, which used the Whim smartphone app (from the Finnish start-up Maas Global) to combine public transport, taxis, and rental cars. Multiple public and private stakeholders were involved in the project (Table 5.8), leading to complex negotiations to address issues such as specific roles, mandates, business models, data-sharing, and risk and profit sharing (Hirschhorn et al., Reference Hirschhorn, Paulsson, Sorensen and Veeneman2019). Users could initially choose from three packages with different prices (Table 5.8). The project struggled to recruit participants, however, and in 2019 removed the monthly packages, reverting to pay-as-you-go only (Pangbourne et al., Reference Pangbourne, Mladenovic, Stead and Milakis2020). Evaluations of Finnish and Swedish projects also indicated that users often struggled to understand and appreciate the subscription model, in which they would buy mobility services in advance (Karlsson et al., Reference Karlsson, Mukhtar-Landgren, Smith, Koglin, Kronsell and Lund2020).
Table 5.8. Range of MaaS packages in Birmingham and the West Midlands region (Pangbourne et al., Reference Pangbourne, Mladenovic, Stead and Milakis2020: 41)
| Pay-as-you-go (PAYG) | Basic (£99/month) | Unlimited (£349/month) | |
|---|---|---|---|
| Buses, trams, and trains within West Midlands county (National Express West Midlands; Transport for West Midlands) | PAYG | Unlimited | Unlimited |
| Taxi 3-mile radius (Gett) | PAYG | PPR (per person round trip) | Unlimited |
| Car (Enterprise) | PAYG | Max £49 per day | Unlimited |
| Bikeshare (nextbike) | Coming soon | Coming soon | Coming soon |
The Department for Transport monitored the project but was not directly involved. Although DfT has positive orientations, it is presently still an open question ‘whether and how the UK will regulate MaaS’ (Hirschhorn et al., Reference Hirschhorn, Paulsson, Sorensen and Veeneman2019: 184). A research report commissioned by the UK Government Office for Science (2018) acknowledged the potential for a MaaS-related transport paradigm shift, but also noted that ‘MaaS does not yet have a major presence in either the research arena or in society more generally’ (p. 14). There are also uncertainties about consumer interest and economic viability of MaaS, especially outside dense city centres where public transport and car sharing are less frequent and available (Pangbourne et al., Reference Pangbourne, Mladenovic, Stead and Milakis2020). Two high-profile international failures (Kutsuplus in Helsinki, Bridj in the United States) underline that the MaaS business case may be more challenging than the optimistic visions about an imminent paradigm shift suggest.
5.6.6 Self-driving Personal Cars
Techno-Economic Developments
There have been several waves of attention and R&D programmes about automated and self-driving cars (in the 1930s, 1960s, and 1980s), which failed to materialise (Geels and Smit, Reference Geels and Smit2000). Since the 2010s, progress in information and communication technologies has led to another wave of attention as well as many collaborative R&D and real-world demonstration projects. The reason for this renewed enthusiasm is that proponents of self-driving personal cars envisage many potential benefits such as the following (Parkhurst and Lyons, Reference Parkhurst and Lyons2018): a) elimination of vehicle collisions (and associated deaths and mutilations), b) smoothed traffic flow and greater effective road capacity, c) using travel time for other (economically productive) activities in the vehicle, d) reduced energy use and greenhouse gas emissions (because of smoother rides), and e) enhanced mobility for those unable to drive themselves (e.g., impaired people and elderly). Deeper transformations are possible if self-driving cars align with car sharing and mobility services, leading to a future in which people do not own and drive their own cars, but instead use phone apps to smoothly access shared automated vehicles (Sperling, Reference Levinthal2018).
Efforts to monetise potential benefits have generated high numbers. The McKinsey Global Institute (2013) estimated that potential global economic benefits could range between $0.2 and 1.9 trillion by 2025 with an uptake of 5–20%. Assuming a 90% penetration rate, Fagnant and Kockelman (Reference Fagnant and Kockelman2015) suggest that net direct benefits could be $196 billion per year for the United States, mainly due to reduced collision and congestion costs. Arbib and Sebat (Reference Arbib and Sebat2017) estimate global productivity gains from better used travel time alone at $1 trillion by 2030. Combined with technical progress, these optimistic benefit estimates generated high enthusiasm in the 2010s, which will be discussed further here.
There are different technological levels of vehicle automation (Table 5.9), but only higher levels (4 and 5) qualify as driverless or self-driving cars. Some digital technologies with level 1 or 2 functionalities (e.g., parking assistance, lane centring, cruise control) are already used in higher-end personal vehicles. Fully automated self-driving vehicles also already exist in specific application domains, for example, underground metro-lines and trucks in open-cast mining operations.
Table 5.9. Five levels of driving automation specified by Society of Automotive Engineers (SAE, 2016)
| L0: Driver only | Driver in complete control |
| L1: Assisted (‘hands on’) | Driver in charge, but some small steering or acceleration tasks can be performed by the car without human intervention (e.g., lane centring, parking assistance) |
| L2: Semi-automation (‘hands off’) | The system controls steering, acceleration, and breaking in relatively simple, specific circumstances. Adaptive cruise control, for instance, can maintain speed and safe distance to other vehicles in motorway driving. |
| L3: Conditional automation (‘eyes off’) | The system steers, accelerates, and brakes under specified conditions (e.g., traffic jam chauffeur); driver must take over, when the system indicates. |
| L4: High automation (‘mind off’) | The system has full control in situations deemed suitable by driver (e.g., urban driving) |
| L5: Full automation (‘steering wheel optional’) | The autonomous system drives the vehicle under all circumstances; no human driver needed. |
Deployment of self-driving personal cars in cities or on highways is more complicated, however, because these environments are more dynamic and unpredictable. To monitor these environments, essential technologies include cameras (to recognise and ‘read’ traffic signs, traffic lights, road lanes, etc.), laser sensors such as lidar (which measure distances to objects by sending laser light and measuring the returning reflection), radar sensors (which send out and receive radio waves that bounce off objects), and ultra-sonic sensors (which measure distance using ultrasonic waves) (Mora et al., Reference Mora, Wu and Panori2020). To assess the car’s location within environments, important technologies include GPS, digital road maps, cloud servers, and big-data-based vehicular networks (Soteropoulos et al., Reference Soteropoulos, Berger and Ciari2019; Sperling, Reference Levinthal2018). To interpret and process incoming information, driverless cars also need ultra-fast computers and multiple software packages to build models, interpret patterns, assess possible outcomes of actions (e.g., braking, steering, accelerating), and make decisions about the best course of action. These packages include Artificial Intelligence (AI) and machine-learning algorithms that enable computer systems to gain experience and learn from mistakes.
Although technical developments in many areas have been fast, ‘most of the research is [still] experimental in nature’ (Mora et al., Reference Mora, Wu and Panori2020: 12). There are also real-world demonstration projects such as Google’s Waymo autonomous vehicle, which by January 2020 had driven more than twenty million miles on public US roads. Increasing real-world experience indicates that self-driving cars perform reasonably well in stable environments, but may struggle in bad weather (e.g., rain, snow), when pedestrians, dogs or plastic bags make sudden movements, or when traffic signs are less visible (e.g., owing to graffiti, mud, or snow). Accidents, including fatal ones such as a 2016 crash with Tesla Autopilot technology (Stilgoe, Reference Stiglitz, Stern, Duan, Edenhofer, Giraud and Heal2018), led engineers and researchers to increasingly focus on safety and reliability issues.
Technical challenges for high safety and reliability performance relate to sensors, which need to become more accurate, and software packages, which need to improve their ability to interpret information and make the right decisions in any possible scenario (Faisal et al., Reference Faisal, Yigitcanlar, Kamruzzaman and Currie2019). A recent edition of The Economist’s Technology Quarterly on ‘Artificial intelligence and its limits’ (13 June 2020) noted that engineers are beginning to doubt if current AI and machine-learning technologies are able to achieve this level of reliability for self-driving cars:
Many of the grandest claims made about AI have once again failed to become reality, and confidence is wavering as researchers start to wonder whether the technology has hit a wall. Self-driving cars have become more capable, but remain perpetually on the cusp of being safe enough to deploy on everyday streets. … Machine-learning systems are not ‘intelligent’ in the way that most people understand the term. They are powerful pattern-recognition tools, but lack many cognitive abilities that biological brains take for granted. They struggle with reasoning and generalising from the rules they discover. … Without another breakthrough, these drawbacks put fundamental limits on what AI can and cannot do. Self-driving cars, which must navigate an ever-changing world, are already delayed, and may never arrive at all.
Costs are difficult to assess in this early development stage. Google’s self-driving cars presently cost more than $150,000, with the lidar laser system being particularly expensive at $70,000 (Wolmar, Reference Wolmar2018). Scale economies and learning-by-doing will drive costs down, but it is uncertain by how much. Volvo’s CEO estimates that full autopilots may cost $10,000 by the early 2020s, which would restrict initial introduction to premium vehicles (Fagella, Reference Fagella2020).
Actors and Policies
Established automakers and ICT firms as well as research groups, consultancies, and specialised suppliers are crucial actors in developing self-driving cars. Large amounts of money have been spent on R&D, collaborative projects, mergers, and acquisitions (Fagella, Reference Fagella2020). In 2016, General Motors spent $581 million to acquire Cruise Automation as well as $500 million to buy 9% shares of Lyft as part of its strategy to first introduce autonomous vehicles in the ride-hailing market niche. In 2017, Ford invested $1 billion into start-up Argo AI, and £15 million into creating an Autonomous Vehicle Research Centre at Carnegie Mellon University. In 2015, Toyota invested $1 billion in the Toyota Research Institute to develop robotics and AI technology. In 2016, Volvo entered into a $300 million joint venture with Uber to develop autonomous vehicles. Tesla and Google have developed their own autonomous vehicles (Autopilot and Waymo). Microsoft has collaborated with car companies such as Renault-Nissan (Fagella, Reference Fagella2020).
Self-driving cars have experienced a hype–disappointment cycle, in which product champions initially made optimistic promises to attract attention, funding, and partners, which then subsequently do not materialise as quickly as predicted, owing to technological or other setbacks (van Lente et al., Reference van Lente, Spitters and Peine2013). Sperling (Reference Levinthal2018: 91) identified 2015/16 as the starting point of the hype-cycle, because this is ‘when the business and popular press began overflowing with adulation and enthusiasm’. In 2015, Tesla’s CEO predicted the arrival of ‘complete autonomy’ by 2018. GM’s 2016 acquisition of Cruise was accompanied by promises to commercially launch self-driving cars in San Francisco by 2019. In 2017, Ford’s CEO announced plans to introduce Level 4 automated vehicles by 2021. CEO’s of Volvo, Fiat-Chrysler, and Toyota also envisaged that self-driving cars would be commercially available by 2021 (Fagella, Reference Fagella2020).
By 2019, however, Ford’s CEO acknowledged that ‘We overestimated the arrival of autonomous vehicles’, adding that initial applications will be in targeted niches: ‘Its applications will be narrow, what we call geo-fenced, because the problem is so complex’ (cited in Fagella (Reference Fagella2020)). Other companies, except Tesla, have similarly downscaled expectations, because of serious technical challenges to achieve the high safety and reliability standards associated with introducing new cars (Topham, Reference Topham2021).Footnote 12
Important actors in UK driverless car developments are research groups (e.g., Bristol Robotics Group, Mobile Robotics Group at the University of Oxford), university spin-offs and start-up companies (e.g., Conigital, Oxbotica, GoBotix), incumbent ICT and engineering companies (e.g., Telefonica, Thales, BAE Systems, ARUP, RDM Group, Bosch), and existing car companies (e.g., Jaguar Land Rover, Ford, Tata Motors, Williams) (Hopkins and Schwanen, Reference Hopkins and Schwanen2018).
The UK government has also been highly supportive of driverless vehicle technology, which it saw as having ‘the potential to be a real game changer on the UK’s roads, […] delivering major benefits for road safety, social inclusion, emissions and congestion’ (DfT, 2015a: 5). The government would like the UK to capture parts of the global market for self-driving cars, which could be as large as £907 billion by 2035 according to a UK Transport Systems Catapult estimate (TSC, 2017). It therefore aims to position the UK as ‘a world leading centre for vehicle research and technology’ (DfT, 2015b: 5), which it hopes will attract investment in UK-based driverless car development.
To stimulate these driverless car developments, the government allocated £19 million funding in 2015 to real-world trials in Bristol, Greenwich, Coventry, and Milton Keynes (Hopkins and Schwanen, Reference Hopkins and Schwanen2018). In 2016, 2017, and 2018, it provided further funding (£21m, £31m, and 51m respectively) for research, development, and demonstration projects in three rounds of Connected and Autonomous Vehicle (CAV) competitions, which helped to create new partnerships between companies, universities, local authorities, and technical consultancies.
The government also developed Codes of Practice for real-world testing in 2015 and 2019 (DfT, 2019b, 2015b) and created the Centre for Connected and Autonomous Vehicles in 2015 within the Department for Transport to oversee and coordinate technical developments, invest in innovation, and bring together expertise from across the public, private, and academic sectors. The government also developed supportive legislation such as the 2018 Automated and Electric Vehicles Bill, which proposed that accidents with self-driving cars should be addressed by adjusting insurance frameworks rather than through product liability frameworks (which would hold manufacturers responsible). More than other countries, UK policymakers have also started to discuss cyber-security issues, particularly data theft, hacking, and resilience to foreign attack (Mladenović et al., Reference Mladenović, Stead, Milakis, Pangbourne and Givoni2020).
Governance discussions are dominated by experts and specialists and do not include civil society groups or wider publics (Hopkins and Schwanen, Reference Hopkins and Schwanen2018). Policymakers and experts deterministically present self-driving car developments as positive and inevitable rather than as something that can be discussed with wider stakeholders in terms of desirability and potential negative side-effects. A report from the House of Lords Science and Technology Select Committee (2017) is one of the few policy documents that raises critical questions, emphasising deep uncertainties about the potential impacts of driverless cars: ‘There is little hard evidence to substantiate the potential benefits and disadvantages of CAVs because most of them are at prototype or testing stage. Furthermore, as with any new technology or advancement, there may be unforeseen benefits or disadvantages that have not yet presented themselves’ (p. 6). It also concludes that the government has focused too much on upstream R&D and dedicated ‘inadequate effort on thinking about deployment … and the main social and behavioural questions relating to CAV’ (p. 6).
Deployment issues have, however, been investigated by social scientists, who suggest that social and environmental impacts will vary widely, depending on vehicle operating profiles (e.g., will they be shared, hailed, or operated individually), settlement patterns (e.g., will people decide to live further away when automated vehicles drive them to work), and travel choices (e.g., will automated vehicles make public transport more efficient or will people shift from public transport to self-driving cars). Wadud et al. (Reference Wade, Hitchings and Shipworth2016: 1) suggest that ‘automation might plausibly reduce road transport GHG emissions and energy use by nearly half – or nearly double them – depending on which effects come to dominate’. Based on a comprehensive review of modelling studies, Soteropoulos et al. (Reference Soteropoulos, Berger and Ciari2019: 29) conclude that automated vehicles (AVs)
are mostly found to increase vehicle miles travelled and reduce public transport and slow modes share. This particularly applies to private AVs, which are also leading to a more dispersed urban growth pattern. Shared automated vehicle fleets, conversely, could have positive impacts, including reducing the overall number of vehicles and parking spaces.
Depending on user behaviour and wider knock-on effects (on public transport and residential patterns), self-driving cars may thus increase rather than decrease traffic.
Self-driving vehicles may also threaten the jobs of drivers of heavy goods vehicles, buses, coaches, taxis, and private-hire vehicles, which in the UK amounts to about 1.6 million people (Wolmar, Reference Wolmar2018).
Safety benefits are also uncertain. First, it is technologically challenging to develop 100% reliable, fail-safe automated systems, as noted at the beginning of the section. Engineers can see technological options that could bring driverless cars to 96–97% of this goal but assess that the final 3–4% will be exponentially harder to achieve (Turley, Reference Turley2019). Reliable fail-safe CAVs may thus require further technical breakthroughs, as noted previously. Second, a fully reliable and functional system may still be vulnerable to hacking, which would provide intruders with control over thousands of vehicles. Sperling (Reference Levinthal2018: 103) suggests that ‘the industry is years away from solving the cyber security problem’. Third, safety benefits will be modest until all cars are fully automated, because ‘mixing driverless and non-driverless cars will have uncertain safety benefits’ (Sperling, Reference Levinthal2018: 99). Fourth, liability issues in case of accidents are challenging to address, because responsibilities for well-functioning self-driving cars are distributed between manufacturers, software providers, owners, city councils (who have responsibilities for traffic signs or road paint), and regulators who set standards (Wolmar, Reference Wolmar2018).
In sum, powerful private and political actors are committed to developing self-driving cars. The technology is, however, still in early developmental phases and faces substantial techno-economic and socio-political challenges. Early high expectations about the technology’s imminent real-world deployment are being replaced by more balanced understandings of challenges and timescales: ‘Under almost any scenario, it will take many decades for the full transition to driverless cars to be realized’ (Sperling, Reference Levinthal2018: 100). The positive and negative effects of this transition are potentially large and open-ended, and dependent on manifold actions and choices. While this creates deep uncertainties, it also means that self-driving car developments are not autonomous, but can still be shaped by actors, including policymakers.
5.7 Low-Carbon Transition through Whole System Reconfiguration
Pulling together information from the system and niche-innovation descriptions, this section first analyses low-carbon whole system reconfiguration through the three lenses (techno-economic, actors, institutions) and then addresses speed, scope, and depth of change.
5.7.1 Low-Carbon Innovations Driving GHG Emission Reductions
GHG emissions from the land-based passenger mobility system (which includes cars, railways, buses, bicycles) decreased by 14% between 2007 and 2019, despite an 11% increase in total passenger-kilometres in the same period. While this does not yet represent a decisive low-carbon transition, it does show that relevant reconfigurations are underway in the passenger mobility system. Based on the analysis in preceding sections, we conclude that the GHG emission reductions resulted from multiple landscape, system, and niche developments.
The financial-economic crisis (and subsequent recession) and high oil prices were two landscape pressures that decreased socio-economic activities in the 2008–2013 period, which, in turn, decreased passenger mobility demand by cars and associated fuel use by 2%. Both these landscape pressures weakened after 2013, boosting car mobility (Figure 5.3).
GHG emissions were also reduced by incremental engine innovations that improved the fuel efficiency of new petrol cars by 25% and new diesel cars by 27% in the 2007–2016 period (Figure 5.13). One qualifier is that emission performance numbers refer to laboratory test results, which can deviate substantially (up to 30–40%) from real-world driving performance. Another qualifier is that the fuel efficiency improvements refer to new cars. A precise assessment of their contributions to emission reductions thus also requires information about vintages of the whole car fleet, which is beyond the chapter’s scope.
Another climate-relevant incremental change in the automobility system was the gradual shift towards more fuel-efficient diesel cars after 2001, when the government introduced CO2-banding in its Vehicle Excise Duty. This trend was reversed by the 2016 Diesel-gate scandal, which triggered major decreases in diesel car sales.
A climate-relevant incremental change in the railway system was gradual expansion, as railway passenger-kilometres increased by 46%, from 57 billion in 2007 to 83 billion in 2019 (Figure 5.3). Some of this passenger expansion resulted from a moderate modal shift from cars to trains, especially for commuting in and out of London, as discussed in Section 5.3.2.
The expansion of cycling (in some cities) is beneficial for health, air quality, and congestion, but has not contributed much to CO2-reduction because it is such a small system. Despite substantial expansion in some cities, including London, cycling’s contribution to overall passenger mobility increased only from 0.5% of passenger-kilometres in 2007 to 0.7% in 2019 (Figure 5.3). Although cycling receives much attention in public media and academic sustainability articles, it is likely to remain of marginal relevance for climate mitigation. Even a doubling of cycling, which would be a challenge in the UK, will have limited climate mitigation effects.
One niche-innovation that contributed to GHG emission reductions was biofuels, which increased from 0.8% of fuel blends in 2007 to 4.3% in 2019 (Figure 5.32).
Other climate-relevant niche-innovations were electric vehicles (HEVs, BEVs, PHEVs), which increased from 0.3% of the passenger car fleet in 2007 to 3.3% in 2020 (Section 5.6.1), and 20.8% of new car sales.
A third niche-innovation, tele-working at home, increased from 2.7% of the working population in 2007 to 5.1% in 2019 (and jumped to 8.5% in 2020). The influences on GHG emissions are uncertain, however, because tele-working has both mobility substituting and inducing effects, as discussed in Section 5.6.3.
The emission reduction effects of driverless cars, car sharing, and mobility services have been small, because these niches are still marginal, except for ride-hailing, as discussed in Sections 5.6.4, 5.6.5, and 5.6.6.
This summary clearly demonstrates that GHG emission reductions between 2007 and 2019 resulted from multiple exogenous landscape influences, system developments (incremental improvements and relative size changes), and niche-innovations that together reconfigured the passenger mobility system.
5.7.2 Techno-Economic Reconfiguration
To further interpret mobility systems reconfiguration, we use Summary Table 5.10, which positions the various innovations and changes in the techno-economic mapping framework that we developed in Section 2.2.1. Combining this table with the dynamic analyses in the previous sections, we identify the following pattern. Incremental innovations in system modules (e.g., engine improvements, shift from petrol to diesel cars, motorway and railway extension) were prominent in the early period and also remained relevant in later periods.
Table 5.10. Mapping system reconfiguration opportunities in the UK passenger mobility system
| Core elements | |||||
|---|---|---|---|---|---|
| Linkages (coupling) between system components | Reinforced | Substituted | |||
| Unchanged | Modular incrementalism - Efficiency innovation in internal combustion engines - Shift from petrol to diesel cars (2001–2016) - Motorway extension - Railway extension, better signalling | Modular substitution | |||
| System–system switching: Limited modal shift (from cars to other modes) | Niche-system hybridisation: Biofuels, HEV, PHEV | Niche-system replacement: BEV, ride-hailing, tele-working | |||
| Changed | Architectural stretching - High-speed rail | Architectural reshaping - Mobility-as-a-Service, car sharing - Driverless cars - Intermodal transport | |||
During the last 5–10 years, they have increasingly been complemented, however, with modular substitutions, which replace system components but do not require deeper changes in the system architecture. These modular substitutions took different forms. First, some limited system-to-system switching occurred due to a small modal shift from automobility to railways. Second, substantial hybridisation occurred within the automobility system, due to biofuel blending (which increased markedly since 2017), hybrid-electric vehicles, and plug-in hybrid-electric vehicles (which use both electric motors and combustion engines). Third, substantial niche-to-system component replacement is underway in the form of battery-electric vehicles and ride-hailing (which increasingly substitutes traditional taxis). Tele-working can also be seen as providing (partial) niche-to-system replacement, although this niche-innovation is less about changing a technical component and more about reducing the demand for a certain kind of mobility purpose (commuting to work), which indirectly affects the (auto)mobility system.
There has also been some architectural stretching in the last 5–10 years, particularly in the form of big railway projects such as high-speed railways, the strategic relevance of which is still under debate, as discussed in Section 5.3.3.
There are also seeds for deeper architectural reshaping, but the associated innovations have remained relatively small and have uncertain growth paths. Car sharing and Mobility-as-a-Service could deeply reconfigure mobility systems if they would lead to a shift from private to collective car ownership or to a service model. Presently, however, both innovations are marginal and mostly an occasional add-on to existing mobility practices for particular user groups (see Section 5.6.4).
Driverless cars could also deeply transform existing transport systems, both in terms of functionality (with people trusting computers to do essential driving tasks) and performance (e.g., less accidents, better time use, smoother ride). When combined with sharing or ride-hailing, future mobility systems could even consist of robo-taxis driving around continuously in search of customers. Such high-tech visions are unlikely to materialise any time soon, however, given the technological, social, and legal barriers driverless cars face (discussed in Section 5.6.6).
Intermodal transport innovations can also reshape system architectures, particularly at the local level, by creating new linkages between transport modes. There are examples of such deeper system reconfiguration in London, and to a lesser extent in smaller cities such as Bristol, Brighton, and Oxford (Schwanen, Reference Schwanen2015). In London, many radical niche-innovations (electric car schemes, car sharing, bike-sharing, intermodal ticketing) have come to fruition, and existing systems have changed significantly through the expansion of bus services, new train schemes, and construction of dedicated bicycle infrastructures. The alignment of systems has resulted in an effective intermodal transport system (Table 5.2) and a pronounced modal shift, with car use declining by 35–40% between 2002 and 2018 (Figure 5.18). Apart from London and some small cities, such deep reconfigurations are, however, rare in the UK.
Although there are multiple system reconfiguration options, modular substitution is currently the dominant pathway, especially in the form of a transition towards electric vehicles and, somewhat less, towards biofuels, which have also received a new policy impetus in recent years.
In the past five years, electric vehicles have received increasing support from policymakers, automakers, consumers, and wider publics (as discussed in Section 5.6.1). Electric vehicle sales (HEV, PHEV, BEV) have rapidly increased in recent years, reaching 20.8% of the passenger car market in 2020. While automakers still defended internal combustion engine vehicles in the early 2010s (Bohnsack et al., Reference Bohnsack, Kolk, Pinkse and Bidmon2020; Penna and Geels, Reference Penna and Geels2015), they have in the past few years begun to seriously reorient towards electric vehicles.
Critics rightly argue that an electric vehicle transition still maintains the centrality of the automobility system and private passenger cars (Bergman et al., Reference Bergman, Schwanen and Sovacool2017; Holden et al., Reference Holden, Banister, Gössling, Gilpin and Linnerud2020), and in that sense is not as deep a reconfiguration as some of the architectural reshaping options because it leaves most elements unchanged. Electric vehicles may also not be sufficient to reach deep decarbonisation targets (Milovanoff et al., Reference Milovanoff, Posen and MacLean2020).
On the other hand, the focus on electric vehicles is understandable considering that cars are deeply locked-in (economically, culturally, socially, technologically), and accounted for 85% of all passenger-kilometres in 2019 (Figure 5.3). It is thus very likely that cars will remain the dominant transport mode in the next 10–20 years, and perhaps even longer, particularly for mid- to long-range travel. In most parts of the UK, except in some large cities, alternative transport is infeasible or insufficiently developed to enable a substantial modal shift. Furthermore, the majority of total motor vehicle traffic (62%) in 2019 was on major, interlocal roads (Figure 5.7). Most of the associated journeys simply cannot be replaced by cycling, mobility services, or local integrated transport systems. So, if passenger cars are likely to remain dominant in the next 10–20 years, it does make sense to stimulate a shift towards electric vehicles.
This obviously does not mean that deeper reconfiguration options should not also be pursued. In fact, we agree that policymakers should give more support to these options (Holden et al., Reference Holden, Banister, Gössling, Gilpin and Linnerud2020). But we do suggest that it is rather unlikely in the medium- and probably long-term that everyone will give up cars, start cycling, use public transport, or use sharing and mobility service options.
A final conclusion is that the technology-oriented focus on modular substitution options tends to come at the expense of systemic improvement efforts. The creation (and standardisation) of public battery-recharging, for instance, lags behind the development and purchase of electric vehicles. Basic infrastructure issues (such as local road maintenance, pothole filling, parking, traffic-calming schemes) similarly receive little attention. And railway electrification or signalling improvements, which could help reduce delays, also receive relatively little attention, compared to big rail schemes such as HS2.
5.7.3 Actor Reconfiguration
Focussing on actors and social networks, we conclude that there has been substantial flux and increasing reconfiguration due to the appearance of new actors and changes in the views, interests, and strategies of existing actors, particularly in the automobility system.
New actors have especially appeared with regard to technology development and mobility supply options, as the following summary indicates:
In car manufacturing, Tesla has been a successful new entrant, whose high-end electric vehicles boosted market demand and created competitive pressure on incumbent automakers to reorient towards EVs.
New public and private organisations (such as the Office for Low Emission Vehicles, the Automotive Council, and the Advanced Propulsion Centre) have been created to facilitate coordination and collaboration in the development and manufacturing of electric vehicles, leading to a new innovation system.
A new biofuel manufacturing industry has emerged in the UK to process (mostly) imported biomass feedstocks and supply biofuel to mainstream fuel providers.
Ride-hailing companies (such as Uber) are successful new entrants, whose rapid, convenient, and cheap mobility services have disrupted the taxi market and are generating new options for multimodality in urban settings.
Car- and bike-sharing organisations have appeared as new actors providing new mobility services. The uptake has, so far, remained relatively small, focused on a narrow user segment (e.g., highly educated, tech-savvy, young people in big cities). Initial start-up companies have increasingly been replaced by the entry of incumbent automakers and car rental companies.
Mobility-as-a-Service (MaaS) providers are new organisations that use platform-based business models to provide new intermodal mobility services. Many participants in these new organisations are incumbent actors (e.g., taxis, public transport). The uptake is still very small and the business model fragile.
Incumbent IT companies such as Google, Microsoft, and Apple have moved into the automotive sector, focusing especially on driverless cars, often in collaboration with existing automakers. New R&D organisations and university spinoffs are also working on this new technology, which is in an early developmental stage but supported by highly positive expectations.
Reconfiguration of existing actors and social groups occurred through changes in interpretations, interests, and strategies in response to new (technological and economic) opportunities and (environmental and social) problems. These incumbent actor reconfigurations include the following:
Incumbent automakers have very substantially changed their views and strategies about (various forms of) electric vehicles, in response to increasing consumer demand, CO2 regulations and phase-out targets, public debates, and competitive pressures. Their reorientation towards electric vehicles is generating tremendous turbulence and flux in the automobile industry because it requires major investments and changes in factories, supply chains, and technological capabilities.
Incumbent automakers have also started to explore driverless cars, investing billions of dollars globally in research and technological development. And they have moved into car sharing and ride-hailing ventures to learn about new business models and the mobility services market.
The large investments for these reorientations and diversifications are financially challenging for automakers, whose profits are under pressure from declining passenger car sales in the UK and globally since 2017.
The preferences, views, and mobility practices of some consumers were also changing before the pandemic, mostly through diversification processes leading to increasing fragmentation of mobility practices. Driver’s licenses and car ownership were becoming less prevalent among young people, compared to previous generations, but there is an ongoing debate about the relative importance of cultural reasons (e.g., changing attitudes towards cars) and economic reasons (e.g., increasing car operating costs and lower post-recession incomes).
Young people in large cities such as London partially shifted towards ride-hailing, car sharing, and cycling, but it is not yet clear if these new mobility practices are long-lasting or if they change when people marry, buy houses, and have children.
More people were taking trains, leading to some modal shift. Most of the rail travel growth came from journeys in relation to leisure, business, and commuting (Figure 5.21). The latter two purposes accounted for 51% of rail travel in 2019.
Another change has been the increased purchase of electric vehicles (which accounted for 20.8% of passenger car sales in 2020). Despite purchase subsidies, electric vehicles are still more expensive than normal cars. Early adopters were mostly middle-aged, affluent urbanites with an interest in new technology and environmental issues, but other social groups also increasingly buy electric vehicles.
Although the aforementioned changes are highly relevant, we should not forget, however, that most consumers still showed strong attachments to cars. The percentage of households with two or more cars has gradually increased since the early 2010s (Figure 5.16). Passenger-kilometres by cars remained at 85% of total passenger mobility between 2007 and 2019. And the percentage of Sports Utility Vehicles in passenger car sales increased from 6.6% in 2009 to 21.2% in 2018. So, although the various new mobility behaviours are important and underpin various technical innovations and industry reorientations, a major cultural and behavioural revolution does not yet appear to be underway.
The COVID-pandemic was an exogenous shock that substantially affected consumer preferences and user practices, although it remains to be seen which changes will be long-lasting and structural. Car travel was heavily affected by lockdowns but has rebounded to pre-pandemic levels (Figure 5.4). Rail and bus travel decreased even further during lockdowns but subsequently rebounded to only 50% and 60% of pre-pandemic levels, respectively, owing to lingering health concerns, which suggests that a shift away from public transport may be longer lasting. Cycling increased drastically during and immediately after the first lockdown but seems to have returned to pre-pandemic levels in 2021 (Figure 5.26) in most though not all cities. Tele-working increased substantially in 2020 (Figure 5.33), especially for highly skilled professional workers (Figure 5.34), for whom some of the behaviour changes are likely to be structural, with potential consequences for commuting and business travel (via railways or air).
The pandemic also affected the perceptions and practices of policymakers, who not only provided emergency support funding for railways and buses but also used the disruption to introduced substantial reforms and new policy initiatives for railways, buses and cycling.
The four subsequent tables more systematically summarise and interpret degrees of actor reconfiguration in the four systems. The two columns in the tables address both the main actor changes that support low-carbon transitions and the lock-in mechanisms and competing issues that constrain their engagement with low-carbon transitions.
Table 5.11 shows that actor reconfiguration in the automobility system has been large for automakers and policymakers, and medium for consumers and wider publics. All actors also face medium or large lock-in mechanisms or competing issues that constrain the speed of their reorientation. Tables 5.12, 5.13, and 5.14 show that actor reconfigurations in the railway, bus, and cycling systems have been small or medium, while lock-in mechanisms and competing issues have been high or medium. Changes in actors’ views, interests, strategies, and capabilities have thus been more limited in these three systems.
Table 5.11. Changes and lock-ins for actors in the automobility system
| Actor changes supporting low-carbon transition | Actor lock-ins and competing issues constraining low-carbon transition | |
|---|---|---|
| Carmakers | LARGE - Shifting from internal combustion engines to electric vehicles (EV) - Also exploring car sharing, mobility services, and driverless cars | MEDIUM - Protect sunk investments in car manufacturing (e.g., capabilities, factories) - Immediate economic pressures (e.g., declining markets and profitability, under-utilisation of factories) more important than climate change - Deal with post-Brexit trade problems |
| Policymakers | LARGE - Increasing climate mitigation pressure from local, national, and European policymakers, but mostly with technological focus (especially EVs) - Increasing car-restrictive measures in urban areas (e.g., rising parking fees, one-way roads, reduced city centre access) | MEDIUM - Other non-climate issues also prioritised at national level (e.g., support domestic car industry, congestion, safety), leading to a £27 billion road building programme (2020–2025) - Local policymakers concerned about parking, air pollution, congestion, but have limited policy and financial scope for action |
| Users | MEDIUM - Increasing EV purchase and ride-hailing in big cities - Young people less likely to own cars | LARGE - Ongoing attachment to cars, leading more cars per household - Traditional purchase criteria (e.g., price, size, reliability, comfort, safety, appearance, brand) more important for most consumers than climate mitigation, leading to more SUV sales |
| Civil society organisations, public debate | MEDIUM - More public debate about climate change, air pollution, and cars - Public debate portrays electric vehicles as the central climate solution | MEDIUM-LARGE - Cars remain associated with positive values (e.g., freedom, success, excitement) - Other issues (e.g., fuel prices, congestion, road conditions, air pollution) more prominent in public debates than climate change |
Table 5.12. Changes and lock-ins for actors in the railway system
| Actor changes supporting low-carbon transition | Actor lock-ins and competing issues constraining low-carbon transition | |
|---|---|---|
| Train operating companies (TOC) | SMALL - Climate change not a major consideration - Nevertheless, rail expansion is positive for climate mitigation | MEDIUM-LARGE - Other issues (e.g., financial profitability, punctuality, overcrowding) more important than climate change |
| Policymakers | SMALL-MEDIUM - Policymakers have supported railway expansion but abandoned explicit modal shift policies - Railway investments mostly focused on large-scale, London-centric projects rather than whole system improvement (e.g., electrification, signalling) - Large COVID-related emergency support prevented TOC bankruptcies | MEDIUM-LARGE - Prolonged reluctance to change institutional frameworks until the COVID-pandemic provided the conditions for substantial reform and the creation of Great British Railways from 2023 - No overarching policy vision beyond accommodating railway growth |
| Users | SMALL-MEDIUM - Increased railway travel, mostly for economic purposes (commuting, business) and leisure | MEDIUM - Many people depend on railways to travel in and out of London (which accounts for majority of rail journeys), for which they have limited alternatives - High fares and delays frustrate users - Large COVID-related decrease in rail travel, and lingering health-related fears to travel with others in confined space. |
| Civil society organisations, public debate | SMALL - Limited public debate about railways and climate mitigation, beyond occasional mention of modal shift | MEDIUM - Other issues (e.g., rising train fares, overcrowding, delays, and public subsidies) more important than climate change - Criticisms of privatised railway arrangements created context for COVID-related institutional reform. |
Table 5.13. Changes and lock-ins for actors in the bus system
| Actor changes supporting low-carbon transition | Actor lock-ins and competing issues constraining low-carbon transition | |
|---|---|---|
| Bus companies | SMALL - Climate change not a major consideration - Some subsidised purchase of hybrid-electric buses in London | MEDIUM-LARGE - In declining markets, bus companies mostly compete on costs - Other issues (e.g., quality improvement, better bus stops with electronic information) receive more attention than climate mitigation |
| Policymakers | SMALL-MEDIUM - Some policy support for hybrid and electric buses - Stop-start dynamics and changing priorities of funding schemes lead to piecemeal and fragmented improvement - The 2021 National Bus Strategy aims to reform and improve bus services and reverse decades-long decline | MEDIUM-LARGE - Fragmented bus governance (between national and local levels) - Other issues (mitigating decline, maintaining some service provision, stimulating some innovation) more important than climate change |
| Users | SMALL - Climate mitigation unimportant consideration for most bus users | LARGE - Some social groups (low-income families, students, elderly) dependent on bus services - Bus use is declining in most of country, except London - Increasing prices and low quality frustrate bus users (potentially leading to downward spirals) |
| Civil society organisations, public debate | SMALL - Little public debate about buses as climate solution | LARGE - Negative public image of buses - Other issues (e.g., rising fares, low service quality, air pollution) more pertinent than climate change |
Table 5.14. Changes and lock-ins for actors in the cycling system
| Actor changes supporting low-carbon transition | Actor lock-ins and competing issues constraining low-carbon transition | |
|---|---|---|
| Bicycle manufacturers and shops | SMALL - Majority of UK bikes are imported - UK bicycle shops sell bikes and accessories, but limitedly engage with climate change | WEAK - Limited manufacturing lock-ins |
| Policymakers | SMALL-MEDIUM - Active policy support in London and a few other cities - Ambitious but top-down 2020 cycling strategy aims to increase cycling infrastructure and use | MEDIUM-LARGE - Ad-hoc and fragmented national bicycle governance with low priority level (prior to 2020) |
| Users | MEDIUM - Increased uptake by some social groups in large cities (mainly young urban professionals) - Cycling boost due to pandemic lockdowns in 2020, but limited evidence of structural effect - Increased fitness, travel time, and money savings more important motivations than climate change | LARGE - Most citizens uninterested in cycling |
| Civil society organisations, public debate | SMALL - Cycling not seen as ‘normal’ | LARGE - Cycling widely perceived as dangerous and unappealing |
5.7.4 Policy Reconfiguration
Formal Policies
The unfolding low-carbon reconfiguration has been supported by different kinds of policy instruments. Some innovations and transport systems received more policy support than others, which helps explain uneven developmental patterns.
Electric vehicles have been particularly well-supported with public finance for R&D and technology development, subsidies for consumer purchase, and investment in recharging infrastructure. Policymakers also created a dedicated organisation (the Office for Low Emission Vehicles), which strengthened the innovation system by stimulating interactions and collaborations between upstream actors. Tightening European emission regulations and a UK phase-out policy for diesel and petrol cars also stimulated development and demand for electric vehicles.
Driverless cars also received substantial and increasing support, mainly through subsidised research, development, and demonstration (RD&D) projects as well as emerging regulations.
Biofuels have received some domestic RD&D support but were mainly driven by EU and UK bio-blending targets, which were substantially increased in recent years.
The railway system was mainly supported through large-scale infrastructure investment and increasing operational support for Network Rail. In response to the COVID-pandemic, the government not only provided about £12 billion emergency support but also in May 2021 introduced substantial institutional reforms that from 2023 will create a new arm’s length public body (Great British Railways) in charge of rail infrastructure, fares, timetables, and contracting with train companies to provide operational services. These reforms aim to simplify organisational arrangement and responsibilities, improve efficiency, decrease the need for public subsidies, and further grow rail networks and travel.
The bus system has been supported with small and decreasing bus service operator grants (Figure 5.24), some HEV adoption subsidies, and bus travel passes for the elderly. In response to the pandemic, the government not only provided about £1.4 billion emergency support but also in March 2021 introduced a National Bus Strategy for England, which aims to reverse the decades-long decline of bus travel outside London and revitalise bus use in cities and towns. The strategy proposes institutional reforms that give Local Transport Authorities more influence over timetables, fares, and service quality, and provides £3 billion funding over five years to introduce changes such as bus priority lanes, 4,000 new electric buses, contactless intermodal payment systems, and improved digital information.
Limited policy support has been given to cycling (except in a few cities), tele-working, car sharing, and mobility services. These are typically options with a substantial behavioural change component, which suggests that UK transport policy has focused more on technology than on mobility practices. The new active travel strategy, introduced in July 2020, represents a substantial policy shift because it aims to boost walking and cycling in cities and towns and provides £2 billion funding over a five-year period to enable local councils to make on-the-ground changes such as dedicated cycle lanes and low-traffic neighbourhoods. While this strategy and funding led to many local initiatives, numerous councils also removed or downscaled them in response to protests and social acceptance problems, which means the strategy’s success is not guaranteed.
Governance Style
Neoliberalism has long been the dominant guiding principle in UK transport policy, leading to ‘the encouragement of competition, privatization and a light touch from government’ (Wolmar, Reference Wolmar2016: 106–107). Neoliberalism affected public and private transport systems differently. In the bus and railway systems, it underpinned privatisation and liberalisation policies, which fragmented industry structures and led firms to focus on cost-competition. Neoliberal notions resonated well with the individualism and freedom associated with private cars, although significant regulations and public investments imply that the automobility system does not operate as a ‘free market’.
The increasing emphasis on free markets and consumer choice also led to the decline of explicit modal shift and behaviour change policy. Although the 1998 New Deal for Transport plan had ambitious and interventionist goals in this regard, the 1997–2010 Labour government gradually
abandoned the idea that transport policy could be about intervening to change the share of mobility accommodated by each mode. Towards the end of its term of office, Labour’s policy had become one of ‘modal agnosticism’. … The narrative shift from promoting ‘sustainable’ transport, to ‘integrated’ transport and then ‘choice’ can be readily discerned in Labour’s copious transport policy statements from 1997 to 2010.
The very recent active travel strategy (2020) intends to signal a new direction, because it aims to boost cycling and walking so that these transport modes account for half of all journeys in towns and cities by 2030. Although this top-down strategy represents a transformative push, it remains to be seen to what degree it will drive change or form another instance of ‘overpromising and underdelivering’.
Attempts at more interventionist governance are also visible regarding railways and buses, but since the new 2021 plans and strategies focus more on vision than on implementation detail, the transformative effects are difficult to assess. Regarding electric vehicles, policymakers have more demonstrably adopted an increasingly interventionist governance style in the last few years, introducing a raft of market-shaping policies such as purchase subsidies, recharging infrastructure investment, tightening emission regulations, and a phase-out policy of diesel and petrol cars. This shift towards an interventionist governance style stems from the alignment of transport, climate, and industrial policy considerations, which aim to help the UK car industry in its repositioning in a global innovation race.
One stable characteristic of the UK transport governance style has long been the focus on technologies (e.g., electric vehicles, driverless cars, biofuels) and infrastructure. This technological focus was further strengthened by increasing alignments between transport policy, industrial policy, and climate policy, which led policymakers to prioritise those solutions that not only address transport and climate problems but also have the potential to galvanise new industries, jobs, and economic growth. With regard to infrastructure, policymakers have focused more on new large-scale road and rail projects than on less eye-catching bottleneck or ‘whole system’ improvements, such as railway electrification or better signalling, or local schemes, such as ‘junction safety improvements for pedestrians and cyclists, repairing local pavements, building cycle paths and implementing traffic-calming schemes’ (Wolmar, Reference Wolmar2016: 103). If the recent active travel strategy succeeds in the coming years, it would represent a substantial shift that would complement the (ongoing) technological strategies with more behavioural and locally oriented policies.
Another characteristic is a preference for financial incentives, which leave decisions to the market, over more interventionist policies. ‘Politicians are surprisingly wary of doing things that they judge might be unpopular with the public, and this has had massive implications on the direction of British transport policy, especially in the last two decades’ (Shaw and Docherty, Reference Shaw and Docherty2014: 8). Since some of the recent bus and cycling policies aim to change people’s travel practices, it remains to be seen how policymakers will respond to public protests, which are beginning to emerge in places.
A third characteristic is the fragmentation between national and local jurisdictions, which has hampered local transport policies for buses, cycling, road maintenance, and local transport schemes. Wolmar (Reference Wolmar2016: 107) describes British transport policy as ‘highly centralized, with very little power at the local level’. Marsden et al. (Reference Marsden, Ferreira, Bache, Flinders and Bartle2014: 630) note that: ‘The local authorities have no legislative powers and remain highly dependent on national government for resources for new projects (capital) and funding ongoing activities (revenue). … Our interviews with local government stakeholders frequently turned to the hollowing out of technical capacity and of reductions in core financial resources’. Schwanen (Reference Schwanen2015: 7086) therefore concludes that: ‘The autonomy of small- and medium-sized cities as agents in bringing about transformational change toward low-energy urban mobility should not be overestimated.’ In the coming years, this characteristic may well form a substantial problem for the local implementation of the new top-down bus and cycling strategies.
The exception to the fragmentation problem is London, which has managed to deeply reconfigure its passenger transport system in the past two decades, leading to a marked modal shift away from cars. This reconfiguration was enabled by a dedicated local governance structure (notably Transport for London, which was created in 2000 with substantial budgetary and policy discretion), political leadership by successive mayors, and targeted policies, including investments to improve public transport and cycling systems, and the London congestion charge that dis-incentivised automobility. London’s system reconfiguration thus shows that substantial change is possible in favourable governance contexts, including political will and resources.
5.7.5 Scope, Depth, and Speed of Reconfiguration
The scope of the unfolding techno-economic reconfiguration is relatively limited in the automobility system because most change has come to centre on electric vehicles, which is a modular component substitution. Other low-carbon options receive less attention, support, and investment, including incremental fuel efficiency improvements, other modular component substitutions (e.g., biofuels, ride-hailing), and architectural reshaping options (e.g., driverless cars, car sharing, intermodal transport).
The scope of actor reconfiguration in the automobility system has been rather substantial for electric vehicles (especially for automakers and policymakers and somewhat less for users and wider publics) but more limited for other low-carbon options, so that we evaluate the overall scope as moderate.
The scope of policy reconfiguration in the automobility system has remained limited in terms of overall goals, which have increasingly focused on the ‘greening of cars’, particularly through electric vehicles. In terms of policy instruments, however, electric vehicle policies had broad scope, using multiple types of instruments, including financial incentives (for consumer purchase and automaker investments), regulations (e.g., CO2 emission performance standards, diesel and petrol car sales bans), and direct infrastructure investments (in recharging facilities).
The depth of the unfolding techno-economic reconfiguration in the automobility system is moderate, because biofuel blending and various forms of electric vehicles represent modular substitution changes that do not require deeper changes in the system architecture (although the creation of an electric recharging infrastructure creates some new linkages to the electricity system with potential future knock-on effects via vehicle-to-grid innovations). Deeper architectural reshaping options (such as car sharing, Mobility-as-a-Service, driverless cars, and intermodal transport) have remained relatively limited, except in London where an effective intermodal transport system has been created.
The depth of actor reconfiguration in the automobility system is substantial for electric vehicles, where all major automakers have reoriented investment strategies and technical capabilities, while maintaining a mass production-focused business model. Policymakers remained supportive of cars and the car industry, but substantially shifted their support from petrol and diesel cars to electric vehicles, leading to a range of new instruments, including a phase-out policy. But actor reconfiguration has been low to moderate with regard to most of the other car-oriented innovations, which are still small (car sharing), in early developmental stages (driverless cars), or not very radical (fuel efficiency, biofuels, ride-hailing).
Policy reconfiguration in the automobility system has become deep for electric vehicles but is of limited and moderate depth for other innovations.
The speed of reconfiguration is substantial for electric vehicles and will likely increase in the coming decade (driven by phase-out policies, technological and cost improvements, and competitive dynamics). But speed is relatively limited for most of the other innovations, except perhaps for ride-hailing in big cities. Cumulative effects of multiple changes have been substantial, however, leading to 12% GHG emission reductions from automobility between 2007 and 2019, while total passenger car mobility increased by 10%.
Phrased in MLP terms, the automobility system is experiencing destabilisation in internal combustion engine technology, industry strategies, policies, and mobility practices (especially of young urbanites), while multiple niche-innovations have emerged, some of which are gaining momentum (EVs, ride-hailing, biofuels). But the automobility system also continues to have substantial degrees of obduracy related to extensive road infrastructures, established consumer preferences, the economic importance of car manufacturing, and ongoing political support, which is why electric vehicles are receiving more support and resources than other radical innovations.
In the railway, bus, and cycling systems, the scope of the unfolding techno-economic reconfiguration has been limited because of the limited breadth of innovation. Recent bus and cycling strategies aim to increase the reconfiguration scope by stimulating electric buses, intermodal smart tickets, improved information provisioning, and dedicated bus and cycle lanes, but it remains to be seen if these succeed.
The scope of actor reconfiguration in these three systems was also limited until 2020 when the pandemic led to a substantial reduction in rail and bus travel, with potential longer-term structural effects due to lingering health concerns, and a temporary increase in cycling. The scope of policy reconfiguration in these three systems was also limited until 2020 when new strategies changed the policy instruments and incentives in rail, bus, and cycling systems.
The depth of techno-economic reconfiguration has been limited in these systems because change is mostly about increased use of well-established technologies, except for (the intended expansion of) electric buses, which represents moderate-depth modular substitution. The depth of actor reconfiguration in these three systems has also been limited since increased use of existing technologies builds on existing capabilities. The depth of policy reconfiguration was similarly limited until 2020 when new strategies intend to substantially alter the goals, governance styles, and/or institutional arrangements in rail, bus, and cycling systems.
The speed of change has been substantial in the railway and cycling systems in terms of expansion but not in terms of transformation: railway use by passengers has more than doubled since the mid-1990s, while cycling increased by 40% between 2007 and 2019, and 46% in 2020. Despite this expansion, railway and cycling remained relatively small systems, accounting for, respectively, 9.5% and 0.7% of passenger-kilometres in 2019, compared to the automobility system, which accounted for 85% of passenger-kilometres in 2019.
5.7.6 Future Outlook
Although GHG emissions have not yet declined sufficiently, there are some encouraging developments, such as rapidly increasing market shares of electric vehicles in car sales, which are likely to substantially reduce emissions in the coming decades. Although the replacement of diesel and petrol car fleets will lag behind, the diffusion of electric vehicles is likely to constitute an important future pathway for passenger mobility system reconfiguration, even though it mostly represents a modular component substitution rather than a Great Reconfiguration. The speed of this change is likely to increase in the coming years because of strong policy support, including phase-out policies for petrol and diesel cars, strategic reorientations by automakers, and further decreases in the cost of batteries and electric vehicles.
Deeper reconfiguration of passenger mobility systems is possible in the coming years, especially at the local level, where buses, cycling, car sharing, ride-hailing, intermodality, and mobility services have substantial transformative potential. Recent national policy strategies have recognised this potential and introduced some policies to stimulate developments in this direction, but it remains to be seen to what degree local implementation will succeed or be transformative. One reason for doubt is that local policymakers have limited technical capacities, financial resources, and policy discretion. Another reason is that national policymakers, automakers, and many users remain committed to personal cars, which complicates a deep reconfiguration of local transport systems.
Tele-working, and the long-term consequences of COVID-19 more generally, may also contribute to future reconfiguration of passenger transport by altering mobility patterns. While increased tele-working is likely to be a permanent trend (especially for white collar professionals), there are uncertainties about the scale of this change and its effects on mobility patterns. So far, the effects on car travel, which has rebounded to pre-pandemic levels, seem to be limited, while the effects on rail travel, which has rebounded much less, may be larger. It also remains to be seen how employers’ and workers’ attitudes towards tele-working, and COVID-19 more generally, will develop in the coming years.
In sum, electric vehicles are likely to substantially reconfigure parts of the passenger mobility system in the coming decades and there are additional options for deeper reconfiguration. It is presently uncertain, however, if these additional options will be further developed or if modular substitution will remain the dominant decarbonisation pathway.


 Open access