


1. Introduction
There is now a substantial body of research on single-molecule studies of the component F1 of FOF1-ATP Synthase (Adachi et al. Reference Adachi, Oiwa, Nishizaka, Furuike, Noji, Itoh, Yoshida and Kinosita2007, Reference Adachi, Oiwa, Yoshida, Nishizaka and Kinosita2012; Noji et al. Reference Noji, Yasuda, Yoshida and Kinosita1997; Sielaff et al. Reference Sielaff, Rennekamp, Engelbrecht and Junge2008; Spetzler et al. Reference Spetzler, Ishmukhametov, Hornung, Day, Martin and Frasch2009; Watanabe et al. Reference Watanabe, Iino and Noji2010; Yasuda et al. Reference Yasuda, Noji, Yoshida, Kinosita and Itoh2001) In the physiological operation of the FOF1-ATP synthase the proton transfer between two offset ion channels in the FO causes its c-ring to rotate. This c-ring rotation induces rotation of the central γ shaft, which controls the chemistry in the F1 α 3 β 3 ring (Boyer, Reference Boyer1993; Braig et al. Reference Braig, Menz, Montgomery, Leslie and Walker2000; Junge & Nelson, Reference Junge and Nelson2015; Mukherjee & Warshel, Reference Mukherjee and Warshel2011, Reference Mukherjee and Warshel2015; Senior, Reference Senior2007; Walker, Reference Walker2013; Weber, Reference Weber2010). In treating this modular structure the system has been studied by a ‘divide and conquer’ method of separately analyzing the function of the F1 ring with the embedded shaft. The crystal structure of the F1-ATPase (Braig et al. Reference Braig, Menz, Montgomery, Leslie and Walker2000) provides a starting point for these mechanistic studies (Walker, Reference Walker and Grenthe2003). The kinetic study of the water-soluble F1-ATPase, although itself artificial, can play a key role in the understanding of the mechanism of the whole ATP synthase.
In the present paper we summarize (Section 4) what we believe has been learned from the single molecule studies, both experimental and theoretical. When coupled with information extracted from ensemble experiments (Boyer, Reference Boyer1993; Braig et al. Reference Braig, Menz, Montgomery, Leslie and Walker2000), single-molecule experiments in the F1-ATPase can uncover the dynamics of the coupling between the γ rotor and the F1 stator (Senior, Reference Senior2007; Weber, Reference Weber2010), e.g., by probing the rotor angle dependence of the individual substeps in the stator. To realize this potential, structurally interpretable information needs to be extracted from single-molecule experiments. One additional item of the present paper is to illustrate the role of an analytical theory that treats the chemo-mechanics, provides a framework for treating and predicting experimental results, and suggests new experiments. The results reveal features linking single-molecule trajectories with past and future and atomistic simulations.
At the outset it should be stated that although much is being learned from the single molecule studies there are some limitations. The FOF1-ATP synthase consists of the two units FO and F1 but in the single molecule studies it is the F1 part, which has been studied thus far. Since there is then no proton gradient across the FO ion channels to drive, via the c-ring and the γ shaft, the opening and closing of β subunits in the F1, almost all of the single molecule studies have been performed for the reverse reaction, namely the hydrolysis of ATP (Kamerlin et al. Reference Kamerlin, Sharma, Prasad and Warshel2013), catalyzed by the F1-ATPase. We note in passing that in some bacteria the FOF1-ATP synthase works in reverse, it hydrolyzes ATP to generate ion gradient and in vitro the enzyme can operate in both directions depending on the nucleotide and proton concentration (Pedersen & Carafoli, Reference Pedersen and Carafoli1987). With the assumption of the reversible nature of the individual steps in the overall process one then learns details of the mechanism of the ATP synthesis in the system. There are nevertheless some single molecule studies described in Section 2 of ATP synthesis directly using controlled rotation (Adachi et al. Reference Adachi, Oiwa, Nishizaka, Furuike, Noji, Itoh, Yoshida and Kinosita2007, Reference Adachi, Oiwa, Yoshida, Nishizaka and Kinosita2012). In the absence of FO driven rotation, the F1 shaft spontaneously rotates in the hydrolysis direction, but in these controlled rotation experiments the rotation and hence the function can be artificially reversed using magnetic tweezers by forcing the γ shaft to rotate in the opposite direction, thus effectively emulating the function of the FO.
A second note is that most of the single molecule studies are of a quasistatic nature, in that the rotation of the γ subunit is controlled in one way or another. Nevertheless, an important quantity, the timescale of the single-molecule events, is in the millisecond to second range, which is typical for the intact FOF1-ATP synthase. This value contrasts with the ‘free rotation’ microsecond range when the concentration of ATP is high and there is no load on the rotor. Novel information on the F1-ATPase is being obtained from these experiments on a fine ‘scale’ not physiologically accessible. In summary, much is being learned about the various dynamic aspects that one can expect to apply in the FOF1-ATP synthase.
The single-molecule studies are of various types: stalling, controlled and free rotation, FRET, AFM, and polarized fluorescence. Recently, we have interpreted some of these single-molecule results in terms of a reaction rate theory that combines the chemistry with the mechanical contribution associated with the motor. These studies are complementary to earlier studies largely of ensemble measurements (cf. Boyer, Reference Boyer1993 and references therein). To this end we describe a chemical-mechanical theory (Volkán-Kacsó & Marcus, Reference Volkán-Kacsó and Marcus2015) that we have formulated to treat several types of single-molecule experiments on this biomolecular motor (Adachi et al. Reference Adachi, Oiwa, Yoshida, Nishizaka and Kinosita2012; Watanabe et al. Reference Watanabe, Okuno, Sakakihara, Shimabukuro, Iino, Yoshida and Noji2012). The theory draws heavily on a theory of electron and other transfers in solution (Marcus, Reference Marcus1968, Reference Marcus and Frangsmyr1993; Marcus & Sutin, Reference Marcus and Sutin1985). We show how the torsional elasticity effects (Sielaff et al. Reference Sielaff, Rennekamp, Engelbrecht and Junge2008) in the motor can be coupled in the theory to various physical and chemical processes, such as nucleotide binding and ATP hydrolysis. We focus in the present review on four types of single-molecule experiments that have been performed on the F1 component depicted in Fig. 1 of the enzyme, F1FO-ATPase. A summary of what we believe has been learned from these single molecule studies is given in Section 4.
F-ATPase structure viewed in the plane of the rotor structure (left) and the F1 subsystem (Braig et al. Reference Braig, Menz, Montgomery, Leslie and Walker2000) viewed in the plane of the α 3 β 3 ring (right). The left subfigure was reproduced with journal permission from Weber (Weber, Reference Weber2010).

The functional form of the chemical reaction rate theory that we employ was originally designed for electron transfer reactions. It has been shown nevertheless that the functional form of the reaction rate, more particularly the free energy of activation in terms of the standard free energy of reaction applies to other types of transfer processes within a range |ΔG 0| < λ, using a notation introduced later (Lewis & Hu, Reference Lewis and Hu1984; Marcus, Reference Marcus1968; Murdoch, Reference Murdoch1983).
In this paper we describe in Section 2 various types of single molecule experiments, in Section 3 the theory and its application to single molecule experiments on the F1-ATPase of thermophilic bacillus PS3 is described, and in Section 4 what has been learned from these single molecule experiments is summarized. In particular, in Section 4.2 a discussion on the dwell angles and substeps in two kinds of F1-ATPase, thermophilic bacillus and mammalian, is included.
2. Types of single-molecule experiments
2.1 Stalling experiments
In rotor angle manipulation experiments the angle θ of the rotor was externally controlled by magnetic tweezers, while rotation was optically monitored (Adachi et al. Reference Adachi, Oiwa, Yoshida, Nishizaka and Kinosita2012). In these experiments magnetic beads were attached to the rotor (Fig. 2a ) and the rotor aligned itself to the direction of a controlling external magnetic field.
(a) F1-ATPase in single-molecule imaging and controlled rotation experiments at two rotor angles: 0° and 80°. A double-bead is attached to the γ rotor shaft (in yellow) and rotated against the stator ring (active subunits β 1-β 3). (b) Free energy profile for nucleotide binding (k f ) and release (k b ) rate constants at the two angles. (c) Open-to-close changes in the nucleotide binding β 1 subunit as a function of rotor angle.

An advanced version of these experiments are the stalling experiments (Watanabe et al. Reference Watanabe, Iino and Noji2010). In these experiments the freely rotating shaft was allowed to first reach a dwell angle, then the magnetic tweezers were quickly turned on and the rotor shaft immediately assumed a chosen angle θ. The rotor was stalled at this angle for a predetermined time, then released upon which it either moved back to the original dwell or forward to the next dwell, depending on the state of the underlying process (e.g., for ATP binding either ATP-bound or empty) at the moment of release. We note in passing that earlier experiments (described later) have resolved two dwells, the binding dwell (before an 80° substep, cf. Fig. 1a ) and the hydrolysis dwell (before a subsequent 40° step).
The observed relative number of forward and back events as a function of stall time was given a simple two-state kinetic interpretation (Watanabe et al. Reference Watanabe, Okuno, Sakakihara, Shimabukuro, Iino, Yoshida and Noji2012), which then permitted the determination of forward (k f ) and backward (k b ) rate constants of ATP binding, or other processes. From their ratio, a local thermodynamic property, an equilibrium constant for the reaction step, was also obtained. The angle dependence of the rate constants was explained in terms of the effect of the elastic response of the rotor structure on the free energy of the F1-ATPase-nucleotide system (Fig. 2b ) in the model of elastic transfer of nucleotides or other groups (Volkán-Kacsó & Marcus, Reference Volkán-Kacsó and Marcus2015). Later, we give some of the experimental and theoretical results and then show what can be extracted from these single-molecule experiments.
2.2 Controlled rotation experiments
In these experiments single-molecule fluorescence microscopy was added to the rotation microscopy and magnetic tweezers (Adachi et al. Reference Adachi, Oiwa, Yoshida, Nishizaka and Kinosita2012). The individual binding and release events of fluorescent nucleotides were directly monitored, while the shaft was rotated at a constant rate. To detect site occupancy the binding nucleotide species (ATP or ADP) was modified by linking a fluorescent Cy3 moiety to it via a flexible alkane tether (Adachi et al. Reference Adachi, Oiwa, Nishizaka, Furuike, Noji, Itoh, Yoshida and Kinosita2007). When the nucleotide was bound to the F1-ATPase the Cy3 moiety emitted a measurable fluorescence signal but when it was in the solution it was dark. Events whereby the occupancy changed between 0 and 1 were thereby determined and analyzed (Fig. 1c ). Using a criterion to assign groups of binding events to specific β subunits, in the analysis of Kinosita and co-workers (Adachi et al. Reference Adachi, Oiwa, Yoshida, Nishizaka and Kinosita2012) the number of (0 → 1) and (1 → 0) events over the time spent in a 0 and 1 occupancy state yielded forward and reverse rate constants, respectively. Expressions have recently been obtained permitting the extraction of rate constants where multiple events occur, so completing our treatment of single events (Volkán-Kacsó & Marcus, Reference Volkán-Kacsó and Marcus2017a).
2.3 Free rotation experiments
In the first-generation experiments of this type, the unconstrained rotation of the shaft was observed by conventional microscopy, first under a heavy viscous load via imaging the motion of a microfilament attached to the rotor (Noji et al. Reference Noji, Yasuda, Yoshida and Kinosita1997). Later, the viscous drag was reduced by attaching submicron-sized beads to the rotor (Sakaki et al. Reference Sakaki, Shimo-Kon, Adachi, Itoh, Furuike, Muneyuki, Yoshida and Kinosita2005; Yasuda et al. Reference Yasuda, Noji, Yoshida, Kinosita and Itoh2001). A counter-clockwise (as defined in the previous section) stepping rotation with dwell angles 120 apart was resolved which later was shown to consist of the 40° and 80° substeps mentioned earlier (Watanabe et al. Reference Watanabe, Iino and Noji2010).
2.4 High-speed free rotation experiments
In some later versions of the single-molecule rotation experiments, the size of the imaging bead was further reduced (Yasuda et al. Reference Yasuda, Noji, Yoshida, Kinosita and Itoh2001). Subsequently gold nanorods (Spetzler et al. Reference Spetzler, Ishmukhametov, Hornung, Day, Martin and Frasch2009) were attached to the rotor shaft, now permitting the angular velocity during the transition between steps to be observed. In particular, the gold nanorods do not limit the rotation velocity via their friction with the water molecules. Using a μs resolution imaging of the rotor angle by monitoring the polarization direction of the light scattered by the nanorod, a feature-rich velocity profile was time-resolved, which reflected the intrinsic dynamics of the rotation (Sielaff et al. Reference Sielaff, Martin, Singh, Biukovic, Gruber and Frasch2016; Spetzler et al. Reference Spetzler, Ishmukhametov, Hornung, Day, Martin and Frasch2009).
2.5 Single-molecule FRET and polarization experiments
Another single-molecule fluorescence experiment is a more elaborate version of previous imaging techniques. An example is the single-molecule Förster resonance energy transfer (smFRET) method (Zimmermann et al. Reference Zimmermann, Diez, Zarrabi, Gräber and Börsch2005), which was used in conjunction with rotation imaging to simultaneously monitor subunit conformation changes and rotation (Sugawa et al. Reference Sugawa, Okazaki, Kobayashi, Matsui, Hummer, Masaike and Nishizaka2016; Zimmermann et al. Reference Zimmermann, Diez, Zarrabi, Gräber and Börsch2005). Another example is the time-resolved detection of the direction of a bimolecular fluorescence species attached to the β subunit, when the latter undergoes conformational changes (Masaike et al. Reference Masaike, Koyama-Horibe, Oiwa, Yoshida and Nishizaka2008). In the fluorescent probe polarized emission occurs due to a strong dipole moment matrix element coupling the electromagnetic field and the electronic states of the fluorophore along the z axis.
3. Chemo-mechanical group transfer theory
The theory will be described (Volkán-Kacsó & Marcus, Reference Volkán-Kacsó and Marcus2015, Reference Volkán-Kacsó and Marcus2016, Reference Volkán-Kacsó and Marcus2017a) by providing (1) an equation for the dependence of the rate constant of a substep on the standard free energy reaction, and (2) introducing into the thermodynamic free energy equation a mechanical elastic coupling term arising from the interaction of the subunits with the γ subunit of the F1-ATPase. The theory and its application to predict controlled rotation data, summarized in this section to make the present review self-contained, is described in more detail in (Volkán-Kacsó & Marcus, Reference Volkán-Kacsó, Marcus, Barber and RUBAN2017b).
3.1 Rate constants and free energy relations
We first note that the equations of the ‘weak-overlap’ theory of electron transfer reactions were adapted to treat ‘strong overlap’ reactions, such as the transfer of an atom B in the atom transfer reaction A + BC → AB + C (Marcus, Reference Marcus1968) and used for the latter (e.g., Chidsey, Reference Chidsey1991; Lewis & Hu, Reference Lewis and Hu1984; Murdoch, Reference Murdoch1983; Sutin, Reference Sutin1966). In this case the topology is such that there is in effect only one relevant potential energy surface (the lower adiabatic surface) instead of two diabatic surfaces. For such transfer reactions in solution (Marcus, Reference Marcus1968, Reference Marcus and Frangsmyr1993; Marcus & Sutin, Reference Marcus and Sutin1985) the free energy barrier for the reaction, ΔG*, is given by an equation, which has been approximated in the literature byFootnote a
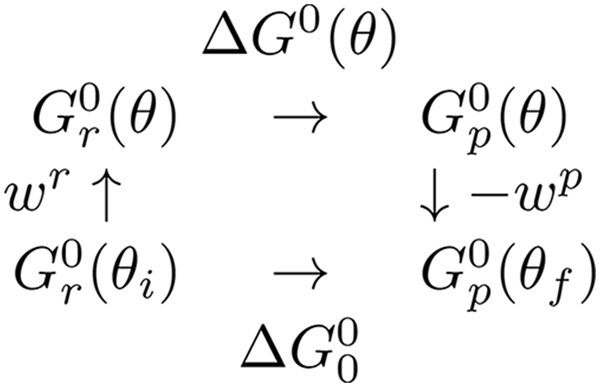
Thermodynamic cycle for a substep showing reactant and product states both when the rotor is stalled at a given angle and when the system is not subject to stalling by the magnetic tweezers.

 $$\Delta G{^\ast} = \displaystyle{\lambda \over 4}(1 + \Delta G^{\rm o} /\lambda )^2, $$
where, for simplicity of presentation in this paper, we have omitted the ‘work terms’ that occur in transitioning from a pair of reactants (r) or products (p) in solution to form a collision complex with the F1-ATPase. In Eq. (1), ΔG 0 denotes the standard free energy reaction of the transfer reaction and λ denotes the ‘reorganization energy’ for the reaction. The rate constant k is given by
 $$k = A\exp ( - \Delta G{^\ast}/kT)$$
where A depends on the nature of the process, e.g., whether the reaction is first or second order, and on the details of the transition state of the process. A particular example would be to use a collision theory picture (Volkán-Kacsó & Marcus, Reference Volkán-Kacsó and Marcus2015) of ATP binding to the weak binding site of an empty β subunit in which the pre-exponential term A is a collision frequency Z, and a term related to an ATP binding outside of the β subunit. For the binding and release of ATP there are extensive data obtained by different methods (Adachi et al. Reference Adachi, Oiwa, Yoshida, Nishizaka and Kinosita2012; Braig et al. Reference Braig, Menz, Montgomery, Leslie and Walker2000; Spetzler et al. Reference Spetzler, Ishmukhametov, Hornung, Day, Martin and Frasch2009; Watanabe et al. Reference Watanabe, Iino and Noji2010, Reference Watanabe, Okuno, Sakakihara, Shimabukuro, Iino, Yoshida and Noji2012; Yasuda et al. Reference Yasuda, Noji, Yoshida, Kinosita and Itoh2001). In the ATP binding an ATP first forms a collision complex (Oster & Wang, Reference Oster and Wang2000) with the F1-ATPase, followed by an ATP binding as the next step (an 80° step) in the overall hydrolysis.
The simplest adaptation of Eq. (1) is to use the quadratic relationship, but, because of the different topology of the surfaces for weak and strong interaction, to set ΔG* = 0 when − ΔG 0 ⩾ λ, and ΔG* = λ when ΔG 0 ⩾ λ between the reactants. Whereas the ET reaction rate decreases at highly negative ΔG 0 the ‘strong overlap’ reaction rate reaches some limiting maximum value, a result clear from the topology of the adiabatic surface, instead of experiencing the ‘Marcus inverted effect’. When, instead, ΔG 0 is very positive (⩾ λ) we use for this limiting case ΔG* = ΔG 0. Accordingly, in passing we note that the relation between this model and a bond energy-bond order model (BEBO) has been discussed (Marcus, Reference Marcus1968 and reference cited therein). In the BEBO model the sum of the bond orders in a reaction AB + C → A + BC is assumed constant throughout the reaction step, so for an atom or group transfer a cooperative effect is seen. Here, the activation energy when B is transferred from A to C is roughly 10% of the AB bond energy for a thermoneutral reaction. A somewhat more detailed account of the application of the BEBO idea for a substep in the F1-ATPase is found elsewhere (Volkán-Kacsó & Marcus, Reference Volkán-Kacsó, Marcus, Barber and RUBAN2017b). The relevance to processes such as ATP binding is that when an ATP enters a channel in an empty β subunit and finally locks into place in the subunit some hydrogen bonds are broken while new hydrogen bonds are formed, perhaps with an approximately conserving the total number of hydrogen bonds.
3.2 Mechanical elastic coupling
We have used the above ideas (Volkán-Kacsó & Marcus, Reference Volkán-Kacsó and Marcus2015, Reference Volkán-Kacsó and Marcus2016, Reference Volkán-Kacsó and Marcus2017a) in applying Eqs. (1) and (2) to the binding and release of ATP in single-molecule stalling and controlled rotation experiments. The dwell angles 0°, 80°, 120°, 200°, 240°, 320° and 360° are angles of rotation of the rotor with respect to the stator and are the angles of local stability.
A thermodynamic cycle (Scheme 1) was introduced by Volkán-Kacsó & Marcus (Reference Volkán-Kacsó and Marcus2015) to provide a basis for a relationship between the free energies of a ligand binding in free rotation, $\Delta G_0^0 $
, and the binding free energy ∆G
0(θ) at a constant rotor angle θ. We introduced into the expressions for the free energy of the reactants and of the products an elastic coupling (Sielaff et al.
Reference Sielaff, Rennekamp, Engelbrecht and Junge2008) between the rotor and the stator (Volkán-Kacsó & Marcus, Reference Volkán-Kacsó and Marcus2015) involved in the step. In particular, to the two-state model originally used to derive Eq. (1) we added to each parabolic free energy curve an elastic term. The elastic term in the free energy equations for the reactants and products of an individual step in a subunit are given as a function of θ in Eq. (3), so yielding Eqs. (4) and (5) for the free-energy barrier as a function of θ.
$\Delta G_0^0 $
, and the binding free energy ∆G
0(θ) at a constant rotor angle θ. We introduced into the expressions for the free energy of the reactants and of the products an elastic coupling (Sielaff et al.
Reference Sielaff, Rennekamp, Engelbrecht and Junge2008) between the rotor and the stator (Volkán-Kacsó & Marcus, Reference Volkán-Kacsó and Marcus2015) involved in the step. In particular, to the two-state model originally used to derive Eq. (1) we added to each parabolic free energy curve an elastic term. The elastic term in the free energy equations for the reactants and products of an individual step in a subunit are given as a function of θ in Eq. (3), so yielding Eqs. (4) and (5) for the free-energy barrier as a function of θ.
 $$w^r = \displaystyle{k \over 2}(\theta - \theta _i )^2 \quad {\rm and}\quad w^p = \displaystyle{k \over 2}(\theta - \theta _f )^2, $$
 $$\Delta G{^\ast}(\theta ) = W^r + [\lambda + \Delta G^0 (\theta )]^2 /4\lambda, $$
where we have now included a work term W r for attaching the ATP from solution to the exterior of the F1-ATPase, and where the standard free energy of reaction ∆G 0(θ) is given as a function of θ in Eq. (5).
 $$\eqalign{\Delta G^0 (\theta ) &= \Delta G_0^0 + w^p (\theta ) - w^r (\theta ) \cr &= \Delta G_0^0 - k(\theta _f - \theta _i )[\theta - (\theta _f + \theta _i )/2].} $$
Here, $\Delta G_0^0 $
is energy of the final dwell state minus the free energy of the initial dwell state for that step, as in Scheme 1 given earlier.
$\Delta G_0^0 $
is energy of the final dwell state minus the free energy of the initial dwell state for that step, as in Scheme 1 given earlier.
3.3 Application of theory to the single-molecule experiments
Stalling and controlled rotation experiments provide the θ-dependent rate constants and equilibrium constants for the steps in the overall process. The ΔG 0(θ) is related to the θ-dependent equilibrium constant K( θ) for that step by ΔG 0(θ) = −kT ln K(θ). The equation for the ln K(θ) for the ATP binding step is seen in Eq. (5) to be linear in θ, in agreement with the experimental data in Fig. 1. With experimental data from ensemble (Boyer, Reference Boyer1993; Weber & Senior, Reference Weber and Senior1997) and free rotation (Adachi et al. Reference Adachi, Oiwa, Yoshida, Nishizaka and Kinosita2012; Spetzler et al. Reference Spetzler, Ishmukhametov, Hornung, Day, Martin and Frasch2009; Yasuda et al. Reference Yasuda, Noji, Yoshida, Kinosita and Itoh2001) experiments Eqs. (4) and (5) were used to predict (Volkán-Kacsó & Marcus, Reference Volkán-Kacsó and Marcus2015) for the stalling experiments the Bronsted slope ∂ΔG*/∂ΔG 0 of 0·47 which compares with the value of 0·48 in the stalling experiment for the rate of ATP binding and release over the θ range studied. For the binding rate (k f ) the slope of ln k f (θ) versus θ was also predicted for these nucleotides from the Bronsted slope and the ln K(θ) versus θ data, and found to be in reasonable agreement (~within 10%) with experiment (Volkán-Kacsó & Marcus, Reference Volkán-Kacsó and Marcus2015). For the spring constant κ of the rotor that appears in Eq. (4) the value of κ = 16 pN nm rad−2 was obtained from the stalling experiments. It was then used in the prediction of the absolute value of the binding and release rate constants in Fig. 3 for the nucleotides in controlled rotation experiments. With no adjustable parameters, good agreement was found between these experiments and our calculations. In the prediction we also used the binding rate constant obtained from the free rotation experiment for the fluorescent ATP species (Spetzler et al. Reference Spetzler, Ishmukhametov, Hornung, Day, Martin and Frasch2009). The agreement between experimental and theoretical rate constants is seen in Fig. 3 where the points (symbols) are experimental and the solid curves theoretical.
(Reproduced from Volkán-Kacsó & Marcus, Reference Volkán-Kacsó and Marcus2016) Corrected binding and release rate and equilibrium rate constants versus θ angle for Cy3-ATP in the presence (solid squares, circles and triangles) and absence of Pi (open symbols) in solution. The experimental data (Adachi et al. Reference Adachi, Oiwa, Yoshida, Nishizaka and Kinosita2012) corrected for missed events (and an error due to replacing the time spent in the empty state by total time of a trajectory) are compared with their theoretical counterparts (solid lines). Dashed lines show the data without corrections.
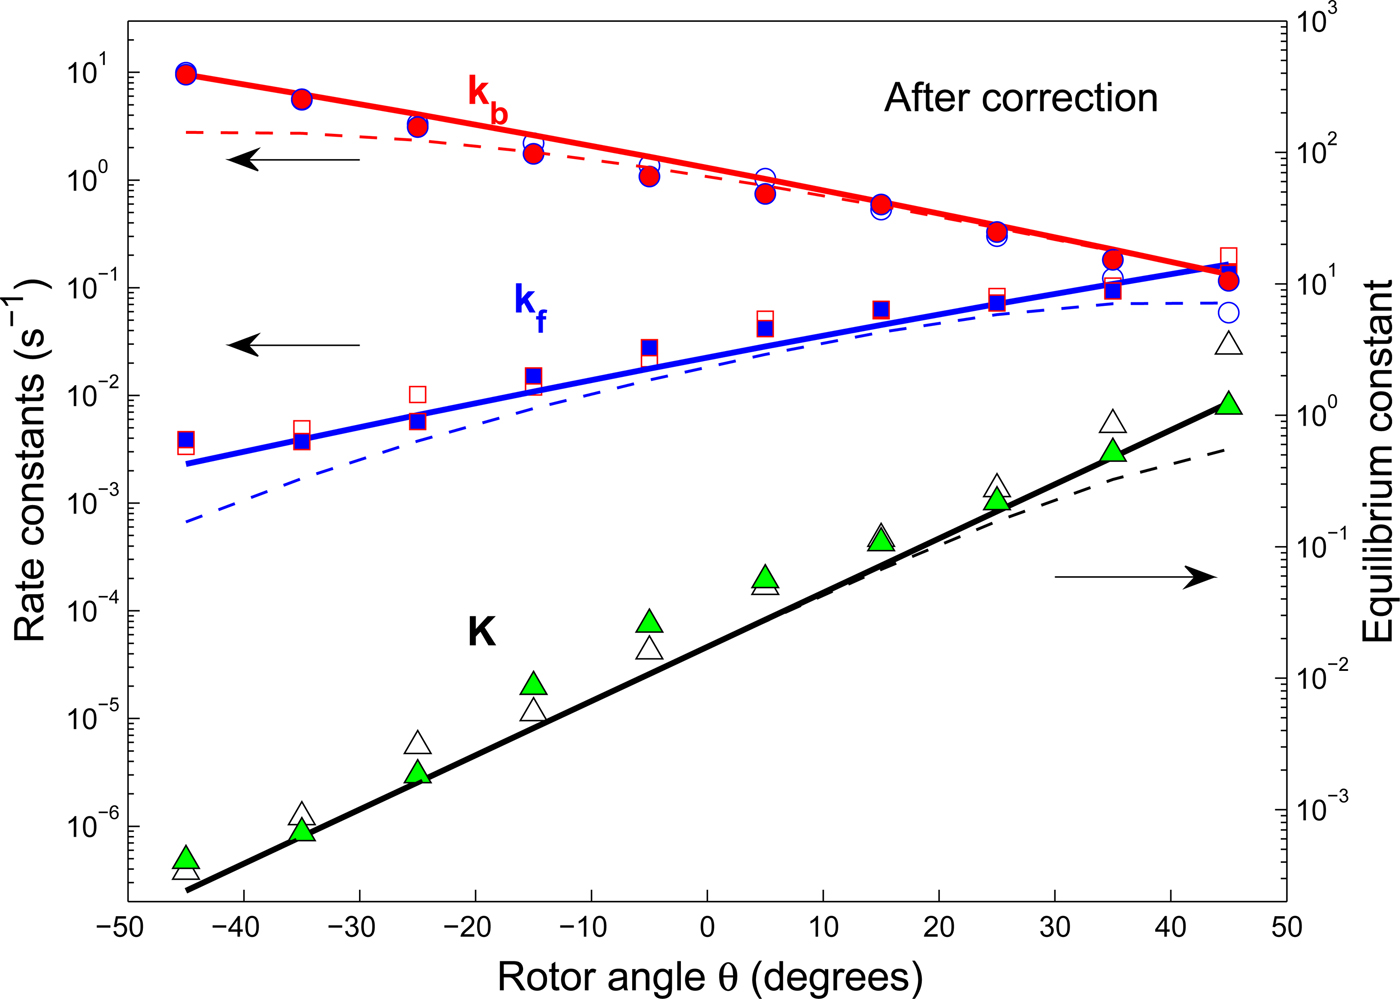
The controlled rotation experiments are complementary to the other forms of single-molecule experiments in several respects. There is a region of angles θ where the controlled rotation and stalling experiments overlap, so that from the stalling data, supplemented by ensemble data it was possible, as above, to predict results of the controlled rotation experiments using no adjustable parameters. The comparison is given in Fig. 3, covering the θ-range of ~−40° to ~+40°. We note that for these rate and equilibrium constant calculations in Volkán-Kacsó & Marcus (Reference Volkán-Kacsó and Marcus2016) we did not use the Bronsted slope equation introduced in the previous study (Volkán-Kacsó & Marcus, Reference Volkán-Kacsó and Marcus2015), the equation now being simpler than the one involving the Bronsted slope (one equation instead of two). In the controlled rotation experiments there are bound fluorescent nucleotides that become non-fluorescent upon release into the solution and so they are used to observe individual binding and release events, but there will also be some missed events when the rate of release is very fast. It was possible to take into account these missed events using the theory given in the previous equations. The missed events are an example of artifacts that arise in single-molecule trajectories, and theory has been used as an instrument to account for such artifacts (see e.g., Cossio et al. Reference Cossio, Hummer and Szabo2015 and references therein). The results, after correcting for these events, are given in Fig. 3. The observations of the rates without this correction for the missed events is given by the dashed lines in that figure.
Recently, the theory of elastic group was further extended in several respects (Volkán-Kacsó & Marcus, Reference Volkán-Kacsó and Marcus2017a). A method was described for predicting the experimentally observed lifetime distribution of long binding events in the controlled rotation. These events involve a combination of two or more processes. Using these distributions the long binding events in the experiments can be treated and the rate constants for the hydrolysis and synthesis reactions occurring during these events extracted. As discussed in a later section a near symmetry of the data about the angle of −40° and a ‘turnover’ in the binding rate data versus rotor angle for angles greater than ~40° was interpreted using diffusion-reaction kinetics.
4. What has been learned from single-molecule experiments
4.1 The depositing of the F1-ATPase on the slide does not influence the rotation kinetics
A first question is the relevance of single-molecule studies to the behavior of the actual F1-ATPase system when in the former the F1-ATP lies on some surface rather than diffused in solution. In Fig. 4 single-molecule and ensemble kinetic data are plotted as a function of ATP concentration: the rate of the F1-ATPase rotation in single-molecule experiments and the number of hydrolyzed ATP molecules per 120° rotation in the ensemble experiments.
Comparison of rotation and hydrolysis rates. Red circles, time-averaged rotation rate for individual 40-nm beads. Red squares, rotation rate averaged over different beads. Dark green squares, one-third of the initial rate of ATP hydrolysis. Light green circles, one-third of the rate of ATP hydrolysis in the presence of LDAO. Blue diamonds, rotation rate for an actin filament attached to the g-subunit (reproduced with journal permission from Yasuda et al. Reference Yasuda, Noji, Yoshida, Kinosita and Itoh2001).

These Michaelis–Menten curves from single-molecule rotation experiments are practically identical with the corresponding data from ensemble measurements. This important property illustrates that F1-ATPase molecules attached to a microscope slide and imaged using a filament or a micro bead behave in this respect as if they were simply suspended in solution. Hence, on that basis, the kinetic and dynamic information extracted from single-molecule rotation experiments are relevant to the physiological functionality of the F1-ATPase.
4.2 There is a concerted kinetics of binding, hydrolysis and release events in the 3 active subunits of the F1
A scheme shown in Table 1 has been established by a series of single-molecule experiments, in which ATP binding and ADP release (from a different β subunit) are concerted (Beke-Somfai et al. Reference Beke-Somfai, Feng and Nordén2012) events (80° substep) and ATP hydrolysis and Pi release (again, from a different β subunit) occur during a 40° substep (Watanabe et al. Reference Watanabe, Iino and Noji2010).
Scheme of coupled processes in F1-ATPase during free rotation

The dwell angle increases in the counter clockwise direction. The species occupying the pockets of ring β subunits 1, 2, and 3 are represented in the binding and catalytic dwells.
The single-molecule findings leading to the coupling scheme are the following:
-
1. ATP binding occurs during the 80° step: The dwell before an 80° substep is ATP concentration dependent and the dependence is linear at low concentrations (Michaelis–Menten curve), identifying it as a binding dwell. ATP binding is considered the first step in the kinetic scheme, so the binding dwell is set to 0° (Yasuda et al. Reference Yasuda, Noji, Yoshida, Kinosita and Itoh2001).
-
2. ATP hydrolysis occurs during a 40° step much later in the scheme, namely during the 200° to 240° step: Mutations at the catalytic pocket have been shown not to affect the 80° step but to reduce the length of the dwell before a 40° step by 2 orders of magnitude, indicating that the hydrolysis occurs during the latter. Using a mixture of ATP and Cy3-ATP, it was shown in fluorescent trajectories that a Cy3-ATP bound at 0° will undergo hydrolysis during the 200° to 240° step (Adachi et al. Reference Adachi, Oiwa, Nishizaka, Furuike, Noji, Itoh, Yoshida and Kinosita2007).
-
3. ADP release occurs during an 80° step, namely from 240° to 320°: Using a mixture of ATP and Cy3-ATP, fluorescent Cy3-ATP was seen to undergo hydrolysis (the Cy3-ATP in solution, like ATP, induced the spontaneous rotation in F1-ATPase) and the resulting fluorescent Cy3-ADP was released during 240° to 320° step (Adachi et al. Reference Adachi, Oiwa, Nishizaka, Furuike, Noji, Itoh, Yoshida and Kinosita2007).
-
4. Pi release occurs during the last 40° step, from 320° to 360°: Increasing the concentration of Pi retards the rate of the 40° step, without affecting the 80° step (Adachi et al. Reference Adachi, Oiwa, Nishizaka, Furuike, Noji, Itoh, Yoshida and Kinosita2007). In single-molecule experiments this finding is explained by the rebinding of Pi at high Pi concentrations, which will effectively lengthen the dwell before the 40° step. Accordingly, Pi release is associated with a 40° step (Adachi et al. Reference Adachi, Oiwa, Yoshida, Nishizaka and Kinosita2012), but which of the three? The hydrolysis occurs at 200° to 240°, so Pi release cannot occur before 200°. Stalling experiments showed that the hydrolysis step 200° to 240° is reversible at low Pi concentrations, so Pi remains in the pocket until the last 40° step, namely the 320° to 360° step (Watanabe et al. Reference Watanabe, Iino and Noji2010). Accordingly, the release of the P i is preceded by the ADP release.
A crystallographic method of studying the chemo-mechanics of rotation is to use substitutions in the binding species and thus prepare various stable states that can be resolved in X-ray structure (Bason et al. Reference Bason, Montgomery, Leslie and Walker2014). Using this approach in the case of mammalian (human and bovine) F1-ATPase Walker and coworkers (Bason et al. Reference Bason, Montgomery, Leslie and Walker2014) found three such states about 65°, 25° and 30° apart. A somewhat similar 80°, 10° and 30° division of the 120° for the dwells of the thermophilic Bacillus ATPase studied in current single-molecule experiments has been suggested (Adachi et al. Reference Adachi, Oiwa, Nishizaka, Furuike, Noji, Itoh, Yoshida and Kinosita2007) based on a mutant that retards the rate and permits an improved time-resolution. Kinosita and coworkers (Adachi et al. Reference Adachi, Oiwa, Nishizaka, Furuike, Noji, Itoh, Yoshida and Kinosita2007) suggested that the combined 10° and 30° substeps give rise to the 40° substep resolved in previous single-molecule experiments (Nishizaka et al. Reference Nishizaka, Oiwa, Noji, Kimura, Muneyuki, Yoshida and Kinosita2004) and associated with hydrolysis and Pi release in a different subunit (Watanabe & Noji, Reference Watanabe and Noji2014; Watanabe et al. Reference Watanabe, Iino and Noji2010). The 10° is presumably the hydrolysis step, a similar small 15° hydrolysis step is supported by a very approximate independent analysis (Volkán-Kacsó & Marcus, Reference Volkán-Kacsó, Marcus, Barber and RUBAN2017b), but the latter can be improved when more accurate kinetic data in the stalling experiments become available. If the highly time-resolved experiments, resolved on the microsecond scale (Sielaff et al. Reference Sielaff, Martin, Singh, Biukovic, Gruber and Frasch2016), become available at lower ATP concentrations they too can provide relevant data on these divisions of the 120°. So, a further study of the dwell angles is of interest in relating results from these different approaches.
4.3 Unidirectional concerted stepping rotation occurs in the presence of fluorescent ATP and in mutant F1-ATPase species
The kinetics in the F1-ATPase, when only the fluorescent Cy3-ATP was in the buffer, (there was no ATP), was shown by Kinosita and co-workers (Nishizaka et al. Reference Nishizaka, Oiwa, Noji, Kimura, Muneyuki, Yoshida and Kinosita2004) to be practically identical with the kinetics when the rotation was driven by unlabeled ATP. While the chemo-mechanical coupling and the stepping were identical, the average rate of rotation was lower with Cy3-ATP than with ATP, owing to the lower rate of Cy3-ATP binding.
In single-molecule experiments, such as stalling, one of three β subunits was mutated to reduce the hydrolysis and catalysis rates, which was needed to properly resolve and study the catalytic step (Adachi et al. Reference Adachi, Oiwa, Yoshida, Nishizaka and Kinosita2012). The rates were further reduced by using a slowly hydrolyzing mutant nucleotide analog ATPγS instead of the ATP itself. Again, the stepping, directional rotation and so the coupling scheme was not altered by these changes, only smaller rate constants were seen in the free rotation trajectories (Nishizaka et al. Reference Nishizaka, Oiwa, Noji, Kimura, Muneyuki, Yoshida and Kinosita2004).
4.4 Comparison of single occupancy experiments with multiple occupancy experiments and comparison of corresponding rates
The θ-dependent rate of ATP binding is not influenced by the occupancy of the neighboring sites and thus by the total occupancy (Sakaki et al. Reference Sakaki, Shimo-Kon, Adachi, Itoh, Furuike, Muneyuki, Yoshida and Kinosita2005). In the stalling experiments (Watanabe et al. Reference Watanabe, Okuno, Sakakihara, Shimabukuro, Iino, Yoshida and Noji2012) used to study ATP binding, when the rotor angle was stalled at angles ranging from about −45° to +45°, the events of ATP binding and release as a function of stalling time followed a two-state kinetics. During longer stall times multiple binding and release events occurred. When an ATP is first bound, the binding induces a fast release of ADP from the counter clockwise neighbor β subunit (Adachi et al. Reference Adachi, Oiwa, Nishizaka, Furuike, Noji, Itoh, Yoshida and Kinosita2007). Given the low ADP concentration maintained in the experiments (to prevent the so-called ‘ADP inhibited’ state from forming) any subsequent ATP binding and release events occurred with only a Pi in the latter β subunit. Accordingly, whereas the first ATP binding event occurred in the presence of ADP in the second subunit, any ATP release and subsequent ATP binding events occurred without the ADP in the second subunit. Yet, when the stall times for this ATP binding/release step were increased, the statistics of forward and backward steps and hence the θ-dependent rate constant of ATP binding were not altered.
In fluorescent Cy3-ATP free rotation (Adachi et al. Reference Adachi, Oiwa, Yoshida, Nishizaka and Kinosita2012) and controlled rotation experiments (Watanabe et al. Reference Watanabe, Okuno, Sakakihara, Shimabukuro, Iino, Yoshida and Noji2012) there was no difference in the rate constant of Cy3-ATP binding, even though the site occupancy was 2–3 in the former and only 0 and 1 in the latter. In other experimental studies that accessed very low nM ATP concentration regimes it was also concluded that the rate constant of binding of ATP was not influenced by the nucleotide occupancy in the neighboring subunits (Sakaki et al. Reference Sakaki, Shimo-Kon, Adachi, Itoh, Furuike, Muneyuki, Yoshida and Kinosita2005).
In contrast, the release rate of ADP is determined by whether ATP is bound or not to a neighboring site. In the chemo-mechanical scheme given in Table 1 the ADP release during the 80° step is faster than 1 s−1. This upper limit is due to the rate limiting hydrolysis step seen in the high-resolution single-molecule rotation experiments (Yasuda et al. Reference Yasuda, Noji, Yoshida, Kinosita and Itoh2001). Meanwhile, the spontaneous release rate of ADP, i.e., when it is not induced by the binding of an ATP to the clockwise neighbor, is, very slow, on the order of tens of seconds (Adachi et al. Reference Adachi, Oiwa, Yoshida, Nishizaka and Kinosita2012). Consequently, the binding of ATP accelerates the release of ADP in the counter clockwise subunit by at least 4 orders of magnitude, reflecting the role of conformational changes induced by the binding.
The above observations have been used in our theoretical treatment of ATP binding and release rates in controlled rotation and stalling experiments (Volkán-Kacsó & Marcus, Reference Volkán-Kacsó and Marcus2015, Reference Volkán-Kacsó and Marcus2016, Reference Volkán-Kacsó and Marcus2017a). They establish the condition that the 80° step is controlled by the ATP binding/release events in a single β subunit: these events induce opening and closing conformational changes in that subunit while any changes in the other two subunits would ‘tag along’. Using a single reaction coordinate associated with the first β subunit, the changes in the latter were taken into account (Volkán-Kacsó & Marcus, Reference Volkán-Kacsó and Marcus2015).
4.5 The concerted kinetics in the ring subunits drives a unidirectional rotation kinetics even in the absence of a rotor shaft
High-speed AFM measurements (Uchihashi et al. Reference Uchihashi, Iino, Ando and Noji2011) in a rotorless F1-ATPase demonstrated that the opening-closing kinetics of the β subunits follow a unidirectional counter-clockwise rotation pattern. The result is consistent with the kinetic scheme in the counter-clockwise rotation observed in the complete F1, albeit the individual steps in the rotorless F1-ATPase are slower. Using the rotation pattern, Noji and coworkers (Uchihashi et al. Reference Uchihashi, Iino, Ando and Noji2011) extracted the rotation rate constant versus ATP concentration reproduced in Fig. 5.
ATP hydrolysis rate of rotorless F1-ATPase (α 3 β 3 ring only) as a function of ATP concentration. The ATP hydrolysis rate constant extracted from the kinetics inferred from high-speed AFM measurement obeyed Michaelis–Menten kinetics (solid line), reproduced from Noji and co-workers (reproduced with journal permission from Uchihashi et al. Reference Uchihashi, Iino, Ando and Noji2011).

The strong dependence of binding and release rate constants on the rotor angle could suggest, as previously proposed, a so-called ‘γ-dictator’ model (Uchihashi et al. Reference Uchihashi, Iino, Ando and Noji2011), whereby this concerted mechanism in the hydrolysis and presumably in the synthesis cycles is due to the interaction between rotor and ring subunits, alone. Indeed, our present treatment of controlled rotation experiments indicates that the single-site activity can be described by such a model.
However, when considering higher nucleotide concentrations, in particular in rotation experiments for F1-ATPase under physiologically relevant conditions, giving rise to a multi-site activity, events of binding/release and hydrolysis/synthesis occurring in pockets of different β subunits are directly coupled. These inter–subunit interactions are strong enough to determine the directional rotation kinetics even without the γ shaft (Uchihashi et al. Reference Uchihashi, Iino, Ando and Noji2011), or a truncated shaft (Furuike et al. Reference Furuike, Hossaih, Maki, Adachi, Suzuki, Kohori, Itoh, Yoshida and Kinosita2008). So while the angular position θ of the latter does affect the rates of the processes in the β subunits, it is not essential in mediating the interactions between the β subunits that lead to the concerted kinetics.
4.6 Direct information on the opening and closing of the subunits
Several single-molecule experiments have provided methods to monitor the opening-closing kinetics.
-
1. Optical imaging of F1-ATPase rotation was used in tandem with single-molecule imaging of polarized light emission from fluorophores attached to a β subunit (Masaike et al. Reference Masaike, Koyama-Horibe, Oiwa, Yoshida and Nishizaka2008). With this arrangement the directional changes of the subunits in the plane of the F1 ring were monitored. It was demonstrated that in addition to hinge bending conformational changes, these subunits also undergo a twisting motion during the chemo-mechanical cycle.
-
2. In combined rotation and FRET imaging experiments the subunit conformational changes were monitored while the F1 underwent typical stepping rotation (Sugawa et al. Reference Sugawa, Okazaki, Kobayashi, Matsui, Hummer, Masaike and Nishizaka2016). The FRET signal was analyzed using statistical theoretical methods and showed that in the active F1-ATPase the empty subunit is in an open conformation while the nucleotide-bound subunits are in closed conformations.
-
3. As described earlier, high-speed AFM measurements were used to monitor the rotary kinetics of opening and closing of the β subunits (Uchihashi et al. Reference Uchihashi, Iino, Ando and Noji2011). As in item 2 above, in these experiments the empty subunits awaiting the binding of an ATP were in an open state, while the other two subunits, presumably with nucleotides in their catalytic pockets, were in a closed state.
4.7 Exponential rate and equilibrium constant versus rotor angle dependence of binding/release and catalysis
As described in Section 3 stalling and controlled rotation experiments revealed exponential-like forward and back rate constants for ATP binding in the region of angular overlap in these experiments (Adachi et al. Reference Adachi, Oiwa, Yoshida, Nishizaka and Kinosita2012; Watanabe et al. Reference Watanabe, Okuno, Sakakihara, Shimabukuro, Iino, Yoshida and Noji2012). Such exponential functions apply to the hydrolysis, Pi release, and various nucleotide binding rates in regions where these events occur in spontaneous rotation. The forward and back rate constants have opposite angle-dependent trends, and the equilibrium constant is strictly exponential, as predicted by theory (Volkán-Kacsó & Marcus, Reference Volkán-Kacsó and Marcus2016).
4.8 There is a turnover in the ATP binding rate around 80°
The turnover in the ATP binding rate constants versus rotor angle plot seen in Fig. 6a indicates that the closing of the binding channel continues as the angle is rotated beyond 80°. The turnover is consistent with structural data and the idea of a continuum of open-to-close states between −40° and 140°.
(a) Reported binding and release rate constants versus controlled rotation angle for fluorescent ATP in the presence of Pi in solution. The reported uncorrected experimental data (squares) are compared with theoretical counterparts (solid lines) by calculating missed events and also correcting for an error due to replacing the time in the empty state T0 by the total time T. Dashed lines show a fit to the experimental data. (b) F1-ATPase structure at three different rotor angles with β subunits in green, α subunits in red and the γ subunit in black. (c) Cutaway of the three structures revealing the binding channel at the α−β interface and its narrowing as the rotor angle is changed. The figure was reproduced from (Volkán-Kacsó & Marcus, Reference Volkán-Kacsó, Marcus, Barber and RUBAN2017b).

We suggested (Volkán-Kacsó & Marcus, Reference Volkán-Kacsó and Marcus2016) that a diffusion process while the ATP is entering the channel in the subunit after the initial binding of the ATP to the outside of the F1-ATPase. The latter then serves as the reactant state in the transfer process. The binding channel leading to the binding pocket (Fig. 6c ), which closes as the rotor is moved in the positive direction (Fig. 6b ) retards the diffusion process to the extent that it becomes the bottleneck during binding for angles beyond 50° or so. Conversely, in this standard diffusion-reaction scheme (Marcus, Reference Marcus1960; Noyes, Reference Noyes1961), the transfer reaction is the bottleneck in the θ-region from about −45° to +45° where stalling and controlled rotation experiment overlap.
4.9 Near symmetry of the kinetic data about −40° and about +140°
As seen in Fig. 6c the β subunit is the most open at −40° and the most closed presumably at +140° (0° is defined as the binding dwell angle at which the β subunit in question is empty and is about to undergo ATP binding associated with a subsequent 80° substep). The minimum at −40° does not correspond to a specific dwell angle. The structural changes of opening and closing are consistent with the trends of binding/release versus rotor angle data and with spontaneous free rotation experiments. In particular:
-
1. Moving the rotor to the left or right starting from −40° in both cases induces a closing of the β subunit which accelerates binding. This behavior is consistent with the spontaneous forward rotation induced by binding of ATP in free rotation experiments occurring in a θ-range to the right of −40° (from 0° to 80°).
-
2. Rotating the γ rotor towards −40° from the left or right in both cases induces an opening of the β subunit, which accelerates release. This result, in turn, is consistent with the spontaneous forward rotation induced by the release of ADP in free rotation experiments occurring in a θ-range to the left of −40° (from of −120° to −40°).
A degree of asymmetry is also seen in the binding/release rate versus rotor angle data relative to the angle from −40° in both directions: Notably, in the presence of Pi in the solution, ATP binding to the right in Fig. 6a occurs at much higher rates than ATP binding to the left. Thus, Pi binding hinders ATP binding in the synthesis direction, but does not prevent ADP binding, a behavior that is consistent with the hydrolysis scheme being the inverse of the synthesis scheme established by single-molecule experiments (Watanabe et al. Reference Watanabe, Iino and Noji2010; Yasuda et al. Reference Yasuda, Noji, Yoshida, Kinosita and Itoh2001). (In the hydrolysis direction Pi is the last to be released during the final 320°–360° substep.)
4.10 In the active F1-ATPase the Pi release occurs after ADP release
In the chemo-mechanical scheme from Table 1 established by the single-molecule experiments, Pi is the last to be released during the final 320°–360° substep. A corresponding structure, i.e., with ATP in one subunit, ATP (or ADP and Pi) in another subunit and Pi only in the third subunit has yet to be found. This observation raises the possibility that the ‘ground state’ structure reported in X-ray crystallography (Braig et al. Reference Braig, Menz, Montgomery, Leslie and Walker2000) is a stable structure that is not on the kinetic pathway of F1-ATPase rotation. Based on recent stalling experiments it was suggested that the crystallography structure, in which one subunit appears to contain ADP without Pi, is the so-called ADP inhibited state (Watanabe & Noji, Reference Watanabe and Noji2014). This result is a reminder that an X-ray structure may sometimes represent the most stable structure and not always the kinetically active structure. It is clear that the structural information is an essential component for understanding the mechanism and that the kinetic data can provide useful additional data for determining the detailed mechanism.
4.11 Angle-dependent rate constants can be extracted from the controlled systems such as stalling or controlled rotation experiments
As seen in Fig. 2, the rate constant versus rotor angle are quasi-exponential and in the range of overlap between the two experiments the forward rate constants and the backward rate constant have opposite slopes. The elastic group transfer theory was used to interpret and predict these angle-dependent kinetic (Volkán-Kacsó & Marcus, Reference Volkán-Kacsó and Marcus2016). Furthermore, we recently devised a method to use the lifetime distribution function of long binding events from the controlled rotation experiments to extract the rate constants for hydrolysis and synthesis (Volkán-Kacsó & Marcus, Reference Volkán-Kacsó and Marcus2017a). We note that due to the angle dependence of the binding, chemical reaction and release rate constants, these waiting time distributions do not necessarily follow simple exponential dependence, and careful treatment is needed to use the data for extraction of the kinetic properties from these distributions.
4.12 There is a relation between the rate constants in stalling, controlled and free rotation experiments
The angle-dependent rate constants in Figs 3 and 6 have been used (Volkán-Kacsó & Marcus, Reference Volkán-Kacsó, Marcus, Barber and RUBAN2017b) to calculate the rate constants that can be extracted from the distribution of dwell times in free rotation trajectories. To do so, the fluctuations of the rotor angle about the initial dwell angle were used to calculate the average rate constants (Volkán-Kacsó & Marcus, Reference Volkán-Kacsó, Marcus, Barber and RUBAN2017b). In particular, for the ATP binding step, the initial angle fluctuates about θ i = 0° for the forward process or it fluctuates about θ i = 80° for the reverse process. The idea of using angle-dependent rate constants, k f ( θ) and k b ( θ), arises from an approximation, which is valid on the ms to s timescales resolved in free rotation experiments. In the latter are used microbeads, in which the stepping in the rotation appears as a discrete process of jumping between subsequent dwells, 0°, 80°, 120°, … In this case, transition state theory and hence a rate description is applicable. A quasi-static θ applies whenever a microbead is used with a slow response time due in part to the friction with the water molecules in the buffer solution.
The rotation rates reported for ATP synthesis in bacterial, mitochondrial and chloroplast enzymes under physiological conditions are slow, about 100 s−1 (Cross et al. Reference Cross, Grubmeyer and Penefsky1982; Etzold et al. Reference Etzold, Deckers-Hebestreit and Altendorf1997; Junesch & Gräber, Reference Junesch and Gräber1985), and are similar to single-molecule studies on F1-ATPase. The latter probes ms to s timescales, relevant to the physiologically relevant function. The viscosity-loaded conditions imposed by the use of the microbeads, are also physiologically relevant, as demonstrated by Junge and coworkers (Panke et al. Reference Panke, Cherepanov, Gumbiowski, Engelbrecht and Junge2001), who argued that a compliant rotor running under high load (and hence elastically twisted) is necessary for an efficient coupling between the FO and F1, given that their subunit counts are incommensurate.
4.13 There is a harmonic behavior of the restoring force
The Gaussian distribution of the fluctuations about the dwell angle seen in single-molecule experiments (Adachi et al. Reference Adachi, Oiwa, Yoshida, Nishizaka and Kinosita2012; Sielaff et al. Reference Sielaff, Rennekamp, Engelbrecht and Junge2008) correspond to a harmonic behavior. The elastic behavior is due to the twisting and bending of structural elements in the ATPase, such as the rotor and the β lever arm, described by a spring constant κ (Volkán-Kacsó & Marcus, Reference Volkán-Kacsó and Marcus2015). The linearity of the plot of the logarithm of the equilibrium constant versus θ supports the assumption that the same κ can be used in the two terms in Eq. (3).
4.14 Using the rate constant versus rotor angle data one can predict the dwell angles and the step size in the free rotation
The theory has provided simple mathematical relations between the dwell angles, the spring constant and log k versus θ slopes (Volkán-Kacsó & Marcus, Reference Volkán-Kacsó and Marcus2016, Reference Volkán-Kacsó and Marcus2017a) When the logarithm of the ratio of the forward and reverse rate constants is linear in θ the difference of dwell angles bracketing the step can be predicted (Volkán-Kacsó & Marcus, Reference Volkán-Kacsó, Marcus, Barber and RUBAN2017b). To do so an independent estimate of the spring constant is necessary, e.g., from fluctuation experiments (Sielaff et al. Reference Sielaff, Rennekamp, Engelbrecht and Junge2008). Then using the angle-dependent rate constant data from stalling experiments, the difference of dwell angles bracketing the hydrolysis step were predicted from the free rotation trajectories (Volkán-Kacsó & Marcus, Reference Volkán-Kacsó, Marcus, Barber and RUBAN2017b). We note that structurally the hydrolysis step is coupled to structural changes of the ring subunits and thus the γ shaft (Beke-Somfai et al. Reference Beke-Somfai, Lincoln and Nordén2013). The linearity condition was not fulfilled for the ATP binding step but was roughly fulfilled for the hydrolysis although the present data are relatively sparse (Fig. 3c in Watanabe et al. Reference Watanabe, Okuno, Sakakihara, Shimabukuro, Iino, Yoshida and Noji2012).
4.15 What is not known from current single-molecule experiments
-
a. The single molecule studies have been performed in the F1-ATPase and not on the FOF1 ATP synthase;
-
b. Detailed correlation at the atomic level of the shaft rotation in relation to the opening and closing and other conformational changes of the β subunits are not clarified;
-
c. Improved resolution of the dwell angles.
5. Concluding summary
In summary, single-molecule experiments have revealed a number of new features on the mechanism of F1-ATPase, also relevant for the understanding of the behavior of the complete ATP synthase. Among these features are the following:
-
a. Similar behavior is found for F1-ATPase on a microscope slide and F1-ATPase dispersed in solution;
-
b. Concerted kinetics of binding, hydrolysis and release events in the 3 subunits during a rotation with 40° and 80° substeps;
-
c. In F1-ATPase rotation hydrolysis occurs 200° after ATP binding and Pi release follows ADP release;
-
d. The ring subunits drive a unidirectional counter-clockwise rotation even in the absence of a rotor shaft;
-
e. Opening and closing of the β subunits during nucleotide binding and release drive shaft rotation;
-
f. There are quantitative relations between the rate constants in stalling, controlled and free rotation experiments;
Acknowledgements
It is a pleasure to acknowledge the support of this research by the Office of Naval Research, the Army Research Office, and the James W. Glanville Foundation.




 Open access

