


Many developing countries have implemented various strategies to promote maternal health services and reduce maternal and neonatal deaths. These strategies include banning traditional midwives, licensing and educating birth attendants, and encouraging antenatal care (ANC) visits at health facilities and facility-based delivery (FBD) (Doctor et al., Reference Doctor, Nkhana-Salimu and Abdulsalam-Anibilowo2018). While research demonstrates that the presence of skilled attendants during labor significantly reduces neonatal deaths in developed countries (De Bernis et al., Reference De Bernis, Sherratt, AbouZahr and Van Lerberghe2003; De Brouwere et al., Reference De Brouwere, Tonglet and Van Lerberghe1998; Kumar et al., Reference Kumar, Mohanty, Kumar, Misra, Santosham, Awasthi, Baqui, Singh, Singh, Ahuja, Singh, Malik, Ahmed, Black, Bhandari and Darmstadt2008), the effectiveness of these strategies in developing nations, such as India (Fadel et al., Reference Fadel, Ram, Morris, Begum, Shet, Jotkar and Jha2015; Powell-Jackson et al., Reference Powell-Jackson, Mazumdar and Mills2015; Randive et al., Reference Randive, San Sebastian, De Costa and Lindholm2014; Lim et al., Reference Lim, Dandona, Hoisington, James, Hogan and Gakidou2010), Nepal (Powell-Jackson et al., Reference Powell-Jackson, Neupane, Tiwari, Tumbahangphe, Manandhar and Costello2009), Malawi (Godlonton Okeke, Reference Godlonton and Okeke2016), and Zambia (Renard, Reference Renard2022), has shown limited impact, raising questions about their efficacy.
In this paper, I examine the impact of health policies promoting maternal and newborn health services in Rwanda on maternal health service utilization and neonatal mortality rates. In 2006, Rwanda implemented several health initiatives, notably the Facility-Based Childbirth Policy (FBCP), offering free access to a comprehensive package of ANC and FBD for all pregnant women. Additionally, there were expansions in community-based health insurance (CBHI), performance-based financing (PBF), and other measures aimed at enhancing healthcare access and quality. Since the implementation of these initiatives, Rwanda has witnessed a substantial increase in the FBD rate, surging from 30% in 2005 to 96% in 2015 (Rwanda Ministry of Health, 2017).
To evaluate the holistic impact of these health reforms, I employ a difference-in-differences (DiD) and event study estimator, leveraging the variation in FBD use prior to the policy reforms to capture sensitivity to the change. Specifically, I categorize Rwandan districts into two groups based on their FBD rate in the baseline period and combine this with the timing of the policy to estimate the causal effect. The underlying assumption is that regions with lower baseline FBD rates have greater potential to increase FBD and ANC utilization through the 2006 reforms. I use data from the Rwandan Demographic and Health Survey (RDHS), which provides comprehensive information on the birth history, socioeconomic status, and demographic variables of mothers and households.
I define the treatment districts as those with low FBD rates in the baseline period, indicating a relatively low historical rate of FBD. The results show that those areas had a greater increase in FBD rates by 10–17 percent following the implementation of the health policies. Additionally, the timing of the first ANC visit decreased by 0.24–0.26 months, and the number of ANC visits increased by 0.17–0.19 times, while the probability of having more than four visits remained unchanged. The effects are observed in the event study specification, but the policy effect did not occur immediately. While the increase in FBD rates was immediate, the change in ANC visits became more apparent after 2011. The DiD estimates suggest an average decline in the rates of newborn mortality (deaths within a week, NMR7) and neonatal mortality (deaths within a month, NMR) by 5.3 and 6.5 deaths per 1000 live births, respectively. However, the event study specification shows a limited impact. In fact, the policy effect on neonatal mortality was not immediate, similar to ANC; instead, it concentrated on later years.
Furthermore, I explore whether travel time to the district hospital, where patients seek advanced care, or the duration of the PBF scheme, which potentially improves the quality of care, reinforces the treatment effect. Travel time to the district hospital is crucial, given that deliveries with complications and cesarean sections are typically performed in district hospitals in Rwanda.Footnote 1 The findings indicate that, although the treatment effect on FBD and ANC is not stronger in regions with closer hospitals or where the PBF scheme was adopted earlier, the decline in NMR and even IMR was more pronounced in these regions. The results provide evidence of the significance of access to quality institutions in reducing mortality rates, highlighting the role of accessibility and quality, aligning with findings from previous studies (Godlonton Okeke, Reference Godlonton and Okeke2016; Renard, Reference Renard2022).
This paper makes two significant contributions. Firstly, it adds to the literature exploring the causal effect of maternal health services on childhood mortality rates. While Rwanda's health reforms have succeeded in increasing service usage, an escalation in service use doesn't guarantee an improvement in health outcomes, as observed in studies across many developing countries. In fact, there are several studies finding success in improving access to maternal healthcare; however, the causal link to child health is mixed. An increase in maternal service use has a substantial impact on the child's survival rate in Nigeria (Okeke Abubakar, Reference Okeke and Abubakar2020; Okeke Chari, Reference Okeke and Chari2018) and ten sub-Saharan African countries (McKinnon et al., Reference McKinnon, Harper, Kaufman and Bergevin2015). On the other hand, limited impact is found in Burkina Faso (Fink et al., Reference Fink, Robyn, Sié and Sauerborn2013), India (Powell-Jackson et al., Reference Powell-Jackson, Mazumdar and Mills2015; Aggarwal, Reference Aggarwal2021), Kenya (Gitobu et al., Reference Gitobu, Gichangi and Mwanda2018), Malawi (Godlonton Okeke, Reference Godlonton and Okeke2016), and Zambia (Renard, Reference Renard2022). However, some of these findings present that the neonatal mortality rate decreases in areas with greater proximity to (high-quality) health facilities. The findings of this paper have a similar conclusion: there is incomplete evidence of a reduction in NMR7 and NMR due to an increase in maternal health service use, but the effect may be reinforced by distance to hospitals. In addition, the timing of the policy effect I find suggests that the policy impact on service use as well as mortality rate is not immediate, and therefore, the researcher should include a sufficient amount of time after the policy inception.
Secondly, this paper stands out as one of the few examining maternal health services in Rwanda. Despite Rwanda's renowned success in rapidly increasing facility-based deliveries over the last two decades, few causal evaluations have been undertaken. Rwanda serves as a role model among sub-Saharan African countries for promoting maternal health services, making it crucial to assess whether the seemingly successful free maternal health service program has achieved its ultimate goal of reducing mortality rates. Chari Okeke (Reference Chari and Okeke2014), focusing on the staggered roll-out of the PBF policy in Rwanda, shows that while PBF increased FBD use, it did not reduce neonatal mortality rates. Given the unclear quality improvement effect of PBF, its expansion might not have effectively reduced the mortality rate. This paper, concentrating on the holistic health reforms during a similar period, reveals a weak reduction in neonatal mortality rates attributable to these health reforms.
This paper is structured as follows. § 1 summarizes the institutional background relevant to this paper. § 2 describes the data and descriptive statistics. § 3 presents the empirical strategy. § 4 explains the main empirical results and § 5.2 examines the heterogeneity by accessibility to high-quality healthcare. I conclude in § 6.
1. Institutional background
1.1. Healthcare reforms in Rwanda
Rwanda has initiated comprehensive health reforms since 2000 to reduce maternal and child mortality and rebuild the healthcare system that was destroyed during the 1994 genocide (Bucagu et al., Reference Bucagu, Kagubare, Basinga, Ngabo, Timmons and Lee2012). After the success of pilot programs, in 2006, the government launched and expanded a couple of health policies including Facility-Based Childbirth Policy (FBCP), which provides a full package of ANC and FBD services free of charge regardless of insurance possession, CBHI, a universal health insurance scheme that works at the community level, and Performance-Based Financing Contracts (PBFC), which provide funds to health facilities based on their performance. The first two policies are intended to improve access to health services and the last is to enhance the quality of care.Footnote 2 These attempts seem to be very successful; the FBD rate had increased from 37 percent in 2005 to 95 percent in 2010 thanks to the reforms, which is a notable increase compared to other sub-Saharan African countries with similar health policies (Doctor et al., Reference Doctor, Nkhana-Salimu and Abdulsalam-Anibilowo2018). At the same time, the Ministry of Health increased the number of trained staff (nurses, midwives, and doctors) and health centers and posts, the primary level facilities (Bucagu et al., Reference Bucagu, Kagubare, Basinga, Ngabo, Timmons and Lee2012).
Rwanda health policy events, 1999–2010

Source: Bucagu et al. (Reference Bucagu, Kagubare, Basinga, Ngabo, Timmons and Lee2012).
While FBCP is the most relevant policy to ANC and FBD use, the other two policies also played a crucial role. Rwandan CBHI (also known as Mutuelles de Santé) increased both insurance coverage and healthcare use including maternal care (Smith Sulzbach, Reference Smith and Sulzbach2008; Wang et al., Reference Wang, Temsah and Mallick2016; Collins et al., Reference Collins, Saya and Kunda2016; Lu et al., Reference Lu, Chin, Lewandowski, Basinga, Hirschhorn, Hill, Murray and Binagwaho2012; Saksena et al., Reference Saksena, Antunes, Xu, Musango and Carrin2011), like other health insurance or user fee removal programs in low-income countries (Renard, Reference Renard2022; McKinnon et al., Reference McKinnon, Harper, Kaufman and Bergevin2015; Meessen et al., Reference Meessen, Hercot, Noirhomme, Ridde, Tibouti, Tashobya and Gilson2011). Although CBHI is operated at the community level, the main parameters such as benefits package, enrollment fees, subsidization mechanisms, organizational structure, management systems, etc. are standardized by law in 2008 (Lu et al., Reference Lu, Chin, Lewandowski, Basinga, Hirschhorn, Hill, Murray and Binagwaho2012). Total health expenditure per capita in Rwanda has increased since 2000 because of a variety of health initiatives, however, out-of-pocket and catastrophic health expenditures have decreased especially for those with insurance (Bucagu et al., Reference Bucagu, Kagubare, Basinga, Ngabo, Timmons and Lee2012). Wang et al. (Reference Wang, Temsah and Mallick2016) show that the increase in maternal health service was concentrated on FBD, and had a limited impact on ANC use. More importantly, although CBHI was supposed to favor disadvantaged households, the coverage has been highly skewed toward the rich (Wang et al., Reference Wang, Temsah and Mallick2016). The research on estimating the causal effect of Rwandan CBHI on mortality rates and other health outcomes such as illness or stunting is scant and the results are mixed; Pierce et al. (Reference Pierce, Heaton and Hoffmann2014) find positive effects but Binagwaho et al. (Reference Binagwaho, Hartwig, Ingeri and Makaka2012) show limited effects on health outcomes.Footnote 3
Likewise, the goal of PBF is to improve both access to and quality of healthcare. Low-quality health care has been recognized as an obstacle to improving people's health in developing countries (Das et al., Reference Das, Hammer and Leonard2008), and maternal health service is no exception (Godlonton Okeke, Reference Godlonton and Okeke2016). Under the PBF scheme, payments to health facilities are linked to the services delivery including ANC, FBD, postnatal care (PNC), family planning, and prevention of mother-to-child transmission of HIV (Bucagu et al., Reference Bucagu, Kagubare, Basinga, Ngabo, Timmons and Lee2012). Based on the success of the pilot program launched in 2001, the government decided to scale up it as a national program in 2006, with a staggered roll-out until 2008 (Rusa Fritsche, Reference Rusa and Fritsche2007). Chari Okeke (Reference Chari and Okeke2014); Basinga et al. (Reference Basinga, Gertler, Binagwaho, Soucat, Sturdy and Vermeersch2011) find that PBF increased FBD and the number of ANC visits, but it did not lead to a reduction in neonatal deaths.
In fact, FBCP, PBF, and CBHI interact with one another. FBCP and CBHI directly increase maternal service use, and so does PBF because maternal health service is included as a targeted intervention of PBF. Health insurance may increase the use of general health services, improving both maternal and child health (Ahmed et al., Reference Ahmed, Sarker, Sultana, Chakrovorty, Ahmed, Dorin, Mirelman, Islam, Rahman, Niessen, Rehnberg and Khan2018). In addition, if PBF had successfully improved the quality of health facilities and healthcare, then it may have reinforced the impact of maternal health services. Because of the similar timing of initiation and interactive characteristics, this paper estimates the impact of the holistic health reforms on maternal health service use and childhood mortality rates, rather than focusing on a specific policy.
1.2. Healthcare system and FBD in Rwanda
The healthcare system in Rwanda ranges from community-level care to national hospitals. At the most basic level, community workers at the village level visit households and identify each household member's healthcare needs. Health posts and centers are the primary care unit, performing promotional, preventive, and curative activities. Health posts are a relatively new type of health facility, which was expanded rapidly from 9 in 2008 to 1184 in 2021 (Rwanda Ministry of Health, 2022, 2017). Health posts provide similar, albeit more limited services than health centers, reaching out to the most remote portions of the country. To improve coverage of primary care, it is planned to have at least one health center per sector and health post per cell.Footnote 4Footnote 5 More complicated illness that cannot be treated in primary care units is referred to higher-level facilities, such as district hospitals (secondary) and provincial and national referral hospitals (tertiary) (Bucagu et al., Reference Bucagu, Kagubare, Basinga, Ngabo, Timmons and Lee2012; World Health Organization, 2017). In 2019, there were 12 referral and provincial hospitals, 36 district hospitals, 509 health centers, and 885 health posts (1,184 in 2021) (Rwanda Ministry of Health, 2019a, 2022).
Under this system, health centers handle most primary care including ANC without complications, normal child deliveries (vaginal delivery), and simple surgical procedures. District hospitals treat patients referred from health centers and posts, performing more complicated curative activities, such as medical and surgical activities, and importantly, difficult and cesarean deliveries (Lu et al., Reference Lu, Chin, Lewandowski, Basinga, Hirschhorn, Hill, Murray and Binagwaho2012; World Health Organization, 2017).Footnote 6 Most of the ANC and normal FBD service is provided by trained midwives and nurses in health centers (Lundeen et al., Reference Lundeen, Musange, Azman, Nzeyimana, Murindahabi, Butrick and Walker2019; Rwanda Ministry of Health, 2022).Footnote 7 In case of complication, the health centers transfer the woman to the nearest district hospital via an ambulance or transport arranged by the woman in case of no ambulance (Niyitegeka et al., Reference Niyitegeka, Nshimirimana, Silverstein, Odhiambo, Lin, Nkurunziza, Riviello, Rulisa, Banguti, Magge, Macharia, Habimana and Hedt-Gauthier2017). Cesarean section is typically performed at a district hospital by general practitioners (Niyigena et al., Reference Niyigena, Alayande, Bikorimana, Miranda, Rudolfson, Ndagijimana, Kateera, Riviello and Hedt-Gauthier2022; Rwanda Ministry of Health, 2019b), and thus the distance and transportation to district hospitals are important factors in seeking quality care in case of emergency.
2. Data
2.1. Data sources
The main dataset used is the Rwandan Demographic and Health Survey (RDHS). I use the birth history data of 2005, 2008, 2010, 2014/15, and 2019/20 waves of RDHS and stack them according to birth year to create a continuous set of births from 2000 to 2018. The birth history data includes all births that the respondent (woman of reproductive age, 15–49 years old) gave retrospectively regardless of survival and age. For the children who have died, the respondents provide information on the age of death (in months when they died before 60 months). The RDHS also collects information on several birth and health statuses such as place of birth (facility or home), ANC, and PNC(postnatal care) visits,Footnote 8 vaccination history, and having fever and diarrhea for children under five years old. The data also provides useful information on households and mothers’ socioeconomic status (SES), such as household wealth and mothers’ education.Footnote 9 I use three measures of mortality rates: Newborn Mortality (death in 7 days, NMR7), Neonatal Mortality (death in 30 days, NMR), and Infant Mortality (death in one year, IMR). Following the traditional definition, the mortality rates are scaled per 1000 live births. When defining each mortality rate, I only include births that passed the one-month threshold for NMR7 and NMR and one year for IMR. Since the mortality rates had surged during the Rwandan genocide and thus led to a very different trend in the late 1990s, I only include births from 2000 although the RDHS asks for the full history of the birth career even happened more than five years ago.Footnote 10
One complication is the inconsistency in administrative districts over time. The Rwandan Government reformed its administrative areas from 12 provinces and 106 districts to 5 provinces and 30 districts in 2006. Because of this change, it is difficult to compare the spatial change of FBD and other health outcomes across time. Using the geocodes of the primary sampling units (PSU or clusters), I match 2008-2019 PSUs to the 106 old districts, for more variation, and construct a dataset with consistent geographic areas. Because the RDHS randomly displaces the GPS coordinates for privacy issues, some measurement error still exists.Footnote 11 Random measurement error of explanatory variables typically biases the point estimate toward zero, which is a less of problem. Nevertheless, for robustness, I drop the 2005 RDHS, which has a different administrative boundary and use new district boundaries, which does not change my result much.Footnote 12
For additional information on the district characteristics, I use the Integrated Household Living Condition Survey (Enquête Intégrale sur les Conditions de Vie des ménages, EICV) of Rwanda, 2005 and 2014 waves. This survey provides information on changes in people's well-being, such as economic conditions, education, health and housing conditions, household consumption, etc. I use it as a supplementary data set to calculate the average insurance coverage rate, travel time to health facilities, and total population by district and year that RDHS does not provide. When calculating the average insurance coverage and travel time to hospitals by district, I restrict the EICV sample to women 15–49 years old as the RDHS sample consists of reproductive-aged women.
2.2. Descriptive statistics
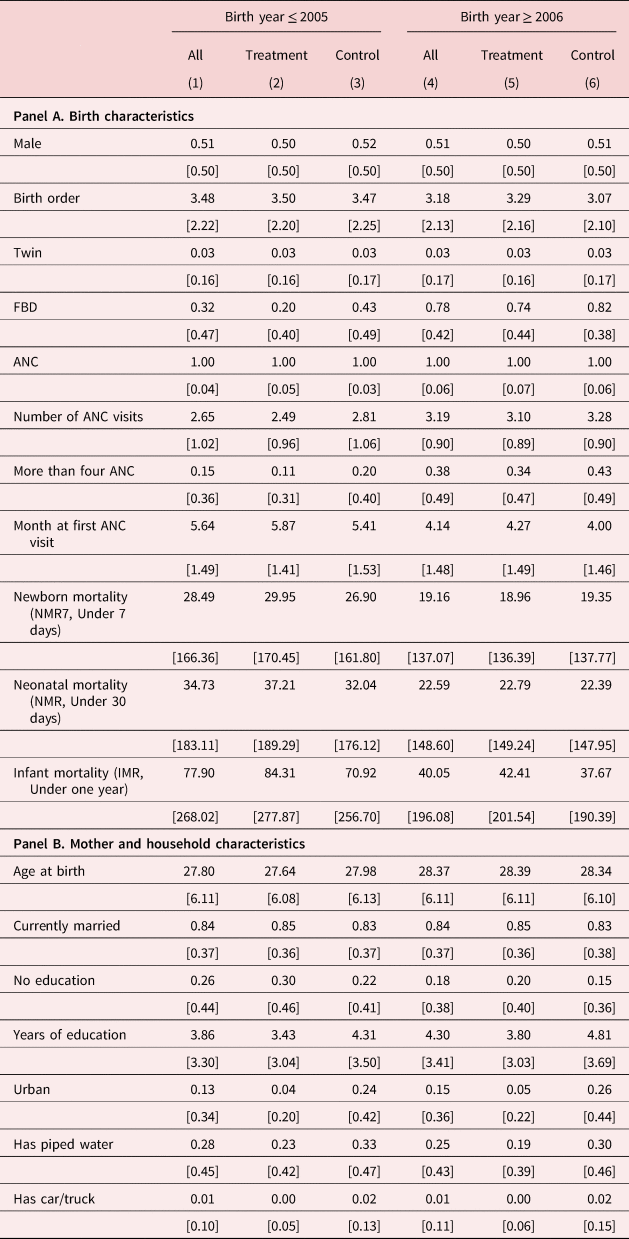
Table 2 presents the summary statistics of the resulting data. I present the mean and standard deviation for all, treatment, and control groups, both for pre- and post-period relative to the health reform. Panels A and B specifically address the birth characteristics and the maternal/household characteristics, respectively.
Summary statistics

Note: This table shows the mean and standard deviation (in brackets) of the entire data used. The unit of observation is each birth. In Panel A, variables related to children or births are presented. Basic demographic variables and survival status are available for all births but FBD and ANC information is for births within five years. Panel B presents the summary statistics of the variables of the mothers and households. Because the unit of observation is birth, some mothers are duplicated if she has more than one child. All of the statistics are weighted with the sample weights.
Three things are notable in Panel A. First, the FBD rate experienced a substantial increase, rising from 32 percent to 82 percent. This increase was particularly pronounced in the treated districts, jumping from 20 to 78 percent, in contrast to the control group's shift from 43 to 95 percent. On the other hand, the probability of utilizing ANC services did not witness a significant change, as nearly every pregnant woman had been engaging in ANC visits even in treatment districts before the reform. Post-reform, however, women exhibited earlier and more frequent ANC visits. While control districts maintained better statistics for ANC visits, the disparities between control and treated districts diminished in the post-period. Mortality rates exhibited a marked decline across all three measures. Specifically, NMR7 and NMR decreased by 9 and 12 deaths per 1000 births, respectively, and IMR nearly halved, plummeting from 78 to 40 deaths. The mortality rates were higher in treated districts during the pre-period, they converged in the post-period, indicating a relatively more substantial decline in the treated districts.
Panel B reveals a marginal improvement in household SES throughout the study period, with the exception of mothers’ education. The proportion of mothers with no formal education decreased from 26 to 17 percent, while years of education increased from 3.86 to 4.35 years. Control districts demonstrated superior education and urbanity levels in both pre-and post-periods. However, the differences between control and treated districts remained relatively consistent, suggesting parallel trends in SES. Other characteristics, such as age at birth, marital status, access to piped water, and possession of automobiles, did not undergo significant changes.
3 Empirical strategy
3.1. Main specification
To identify the causal effect of the health reforms on the use of maternal health services and mortality rates, I exploit a variation in baseline FBD rates across districts in a DiD framework. To be specific, I use the district-level home delivery rate (1-FBD) in 2000–2005 as the proxy for the intensity of exposure to health reforms. In other words, my identification relies on the hypothesis that districts with low baseline FBD rates had a greater scope to increase the use of maternal health services due to the reforms, and thus are more affected by the policy. A similar identification strategy is found in previous works like Bleakley (Reference Bleakley2007); Godlonton Okeke (Reference Godlonton and Okeke2016); Osili Long (Reference Osili and Long2008).
I take the districts with a low FBD rate (below median) as the treatment districts and call them low-FBD districts.Footnote 13 Figure 1 displays how the treatment and control districts are distributed in Rwanda. Kigali area (capital, center of the country) and other large cities are mostly the control districts; however, the treatment districts are well-distributed within the country.
Treatment/Control Assignment. Note: This figure shows the map of Rwanda with its administrative districts in 2005 (old districts). The treatment districts or the low FBD districts are depicted in the darker shade. The treatment districts are districts whose baseline average FBD rates are below the 50th percentile.

Specifically, the main regression equation is as follows:

in which y idpmt is an outcome for child i born in district d in province p in month m of year t. The outcome variables include an indicator for FBD use, ANC visits, and mortality rates. Low FBD d is one if the district has a lower baseline FBD rate than the median (or higher home delivery rate) and ${\opf 1} ( t \geq 2006)$ is an indicator function whether t is greater or equal to 2006. X idpmt is a vector of birth and household characteristics, including survey year fixed effect to correct wave-specific shocks. τ d and θ t are the district fixed effect and the birth year fixed effect, respectively. η m is the birth month fixed effect, controlling any possible seasonality. I include province-level time trends to absorb any long-term linear trend in the outcome variables that may vary across provinces. 2005 RDHS is representative at the old district level while the rest of the waves are at the new district level. Thus, I use the corresponding districts to cluster the standard errors.Footnote 14 The coefficient of the interest is β, the reduced-form impact of the policy change on the outcome variables, capturing the difference in change in the outcome variables before and after the reforms between the districts of high and low FBD. To test the pre-trends and observe the dynamic effect of the policy, I modify Equation (1) to include lags and leads from 2006 and interact with the low FBD indicator in an event study framework. In some specifications, I consider the mother-fixed effect to control unobservable characteristics of mothers.Footnote 15 All regressions are weighted with the sample weights in RDHS.
3.2. Validity of identification strategy
I conduct a placebo test to reject the hypothesis that the effect on mortality rates is confounded by a concurrent change in other factors that affect childhood deaths. For example, mortality rates may have been reduced more in treatment areas, not because of the policy, but because mothers in the treatment areas got relatively healthier, more educated, or wealthier. To address this concern, I examine whether changes in observable characteristics are associated with the treatment status. While this test is not complete for exclusion restriction, the absence of significant association with observable characteristics suggests similar results for unobservable characteristics (Altonji et al., Reference Altonji, Elder and Taber2005).
Another important assumption is parallel trends of outcome variables between treatment and control districts in the absence of the policy intervention. A similar pre-trend between treatment and control districts suggests that the post-trend would have progressed similarly. In other words, the trend of treatment and control districts should evolve in parallel in the absence of the treatment. This assumption is fundamentally untestable because it requires post-period outcomes without policy intervention. In Appendix Figure A.1, I show the raw means of the use of FBD and ANC, and mortality rates by birth or conception year and by treatment status. In these figures, the pre-trends of outcome variables are similar in treatment and control districts. The control districts were better off in terms of maternal health service use and mortality rates in the pre-period, however, the differences converge after the policy implementation except for at least four ANCs. The event study specification also suggests strong graphical evidence for no visible violation of parallel trends in Figures 3 and 4. Nevertheless, I conduct an additional analysis utilizing an alternative estimator robust to violation of parallel trends suggested by Rambachan Roth (Reference Rambachan and Roth2023) and show the main specification is robust in Appendix Figure A.3.
Figure 2 graphically presents the result of the balance test. In this figure, I plot the coefficients of the event study estimator with 2005 as the baseline year for each outcome variable. If there is a pre- or post-trend, it indicates a differential change between the two groups. Most of the coefficients are not distinguishable from zero. Birth characteristics such as sex, birth order, twin indicator, and whether the mother is under 20 (young mother) are all uncorrelated. The treatment status is not associated with the socioeconomic status of the household such as the mother's marital status, education, and wealth index. However, the point estimate for living in an urban area shows an upward trend after 2006, although statistically insignificant. I suspect that urbanization was faster in treatment districts because they consist more of rural areas. Overall, results in Figure 2 indicate that treatment status balances almost all observable characteristics, and the research design is unlikely to be biased by changes in unobservable variables.
Balance Test. Note: This figure graphically shows the result of the balance test. I separately run regressions using Equation (1) with the dependent variables described in the title of each panel. Event study coefficients are presented with a 95% confidence interval. Controls are not included. Standard errors are clustered at the proper district level. (Old districts for the 2005 wave and new districts for the rest of the years.).

4. Results
4.1. Effect on FBD and ANC
In Table 3, I present the mean effect of the policy on FBD and ANC visits. The results suggest a substantial increase in maternal health service use, robust to various specifications. Column 1 reports the basic specification without any control variables. In column 2, I include birth controls such as sex, birth order, an indicator for twins, and the mother's age at birth and its square term. Column 3 adds SES variables, including the mother's education and marital status, household wealth in quintile, and an indicator for urban, pipe water, and possession of the automobile. Column 4, my preferred specification, additionally controls for province-specific linear time trends. In column 5, I control the mother-fixed effect, restricting the sample to mothers with multiple births.
Effect on facility-based delivery and prenatal care

Note: This table presents the treatment effect on FBD and ANC. Dependent variables are presented in the panel title. Each cell presents β 1 of Equation (1) with different specifications described in the bottom part of the table. Birth controls include gender, twin indicator, a full set of dummies of birth order, marital status, and the mother's age at birth and its square term. SES controls include maternal education, household wealth, and urban indicator. All regressions include survey year fixed effects. Columns 4 and 5 include (old) province-specific linear time trends. Because Rwanda changed its administrative boundaries in 2006 (from 106 to 30 districts) and the RDHS is representative at the district level at the survey time, I use the districts appropriate to the time to cluster standard errors, i.e., the old districts in the 2005 survey and the new districts in 2008-2019 surveys. Regressions are weighted using sample weights from the RDHS. Robust standard errors are in parentheses clustered by the proper district. *significance at 10%; **significance at 5%; ***significance at 1%.
According to Panel A, the FBD rate has increased by 14.3 to 16.7 percentage points, or 45 to 52% compared to the pre-period, in the treatment districts, in columns 1–4. The result is robust to the mother-fixed effect, although the point estimate decreases to 10 percentage points. In Panel B and C, the table shows that the month-at-first ANC decreases by 0.21 to 0.23 months or 3.7 to 4.1% and the number of visits also increases by 0.15 to 0.18 times or 5.7 to 6.7%. Because of the small point estimate in Panel C, the probability of having at least four ANC visits does not increase at all in Panel D. In all panels, the point estimates are stable across the specifications, regardless of the control variables, suggesting that the treatment status is uncorrelated with other covariates.
Results in Table 3 suggest that the health reforms in Rwanda were somewhat successful in terms of promoting FBD and ANC visits. Figure 3 presents whether the policy effect was immediate using the event study framework. The figure shows that the FBD rate increased right away after the policy implementation, however, it is not for ANC visits. Average pregnancy month at first ANC visit started to decrease from 2011, five years after the implementation, and so did the total number of ANC visits. The raw trends in Figure A.1 show this result more clearly; while the trend of FBD uses converges right away after 2006 in two regions, the use of ANC does not.
Event Study Estimates on FBD and ANC, (a) FBD, (b) Month at first ANC, (c) Number of ANC, (d) At least four ANC, Note: This figure shows the event study estimators of (a) FBD, (b) month at the first ANC visit, (c) the number of ANC visits, and (d) having at least four ANC with a 95% confidence interval. The specification is the same as column 4 of Table 3. See the notes of Table 3 for the list of control variables. Standard errors are clustered at the proper district level.

I also explore the impact on detailed ANC and FBD use in Appendix Figure A.2, respectively. The quality of ANC slightly increases, for example, the probability of having a blood test, blood pressure check, and tetanus injection increases. The probability of having FBD at health centers and hospitals both increases, but c-section does not.
4.2. Effect on mortality rates
The previous results show that the health reforms in 2006 successfully increased the use of maternal health services, especially FBD, in Rwanda. Here, I examine whether this is associated with a reduction in neonatal mortality rates. The dependent variables are an indicator for deaths, and I multiply the point estimates by 1000 to match the standard definition of the mortality rates (deaths per 1000 live births). To test the comprehensive impact of the health reforms on childhood mortality rates, I use NMR7 (death in a week), NMR (a month), and IMR (one year) as the dependent variables.
The DiD point estimates in the preferred specification are presented in Table 4. Each cell is from separate regressions using Equation (1). Dependent variables are described in the column titles. Panel A uses the same specification with column 4 in Table 3, and Panel B includes the mother fixed effect as in column 5 in Table 3. The inclusion of the mother fixed effect does not change the point estimates much, except for IMR, although the point estimates are not significant for both specifications. Impact on NMR7 and NMR is strong, decreasing from 4.1 to 5.3 and 5.9 to 6.5 deaths, corresponding to respectively, although the point estimates are less precise with the mother fixed effect. The impact on IMR is not significant and becomes rather positive after adding the mother fixed effect. Because the effect on deaths that occurred between 30 days and one year is small and statistically insignificant, this makes the point estimate for IMR small and insignificant as well (See Appendix Table A.1).
Effect on mortality rates

Note: This table shows the treatment effect on different mortality rates. Dependent variables are presented in the column title. Each cell presents β 1 of Equation (1) with the preferred specification (column 4 in Table 3). Because I cannot determine the survival status of the children who did not pass the thresholds for each definition, I drop all the children who did not reach the threshold in the survey. Controls are as same in Table 3. Panel A has the same specification as column 4 and Panel B with column 5 in Table 3. See the notes of Table 3 for further information. Robust standard errors are in parentheses clustered by the proper district. *significance at 10%; **significance at 5%; ***significance at 1%.
Figure 4 presents the event study results to examine the exact timing of the policy effect. The event study figure suggests that the policy effect on mortality rates is unclear, despite the positive average effect in Table 4. The treatment effect is not immediate unlike FBD, and the point estimates become negative only from 2011. There is an overall downward trend for NMR7 and NMR, which makes the average effect captured in Table 4 statistically significant.
Event Study Estimates on Mortality Rates, (a) NMR7, (b) NMR, (c) IMR. Note: This figure shows the event study estimators of (a) NMR7 (deaths in one week), (b) NMR (one month), and (c) IMR (one year) with a 95% confidence interval. The specification is the same as column 4 of Table 3. See the notes of Table 3 for the list of control variables. Standard errors are clustered at the proper district level.

Table 4 and Figure 4 present a positive but limited improvement in mortality rates, suggesting that the policy effect may have a lag. While many papers studying similar policy interventions in low-income countries to improve FBD or delivery with skilled attendants find no effect on overall mortality rates (Godlonton Okeke, Reference Godlonton and Okeke2016; Powell-Jackson et al., Reference Powell-Jackson, Pereira, Dutt, Tougher, Haldar and Kumar2016, Reference Powell-Jackson, Neupane, Tiwari, Tumbahangphe, Manandhar and Costello2009; Aggarwal, Reference Aggarwal2021; Renard, Reference Renard2022), some studies have very short post-period. My results suggest that the policy effect on service use and mortality rates does not happen immediately, and imply that researchers should observe multiple years to make a conclusion.Footnote 16
4.3. Robustness checks
Several robustness checks have been conducted to validate the findings. These checks include alternative definitions of treatment (Appendix Table A.2), the application of an alternative estimator robust to differential pre-existing trends as suggested by Rambachan Roth (Reference Rambachan and Roth2023) (Appendix Fig. A.3), the incorporation of new district boundaries by excluding the 2005 RDHS data (Appendix Fig. A.4), and a subsample analysis (see Appendix Table A.3). The results pertaining to FBD and antenatal care (ANC) remain mostly robust across alternative specifications and subsample analyses, exhibiting strong statistical significance. For instance, treatment effects become more pronounced when using the 25th percentile as the cutoff instead of the median, as this accentuates the underlying differences between treatment and control districts. When accounting for pre-existing trends with Rambachan Roth (Reference Rambachan and Roth2023)'s estimator, the robustness of the estimators is primarily observed for FBD and ANC, but not for mortality rates, consistent with the main estimator. The sub-sample analysis sheds light on the origins of our results, indicating that the observed effects predominantly stem from households more likely to alter their behaviors post-health reforms, particularly among mothers residing outside the capital in rural areas with lower education and wealth levels. However, it is important to note that the results do not maintain robustness when using new district boundaries, primarily due to insufficient pre-period data (Appendix Fig. A.4). The detailed results are available in the Online Appendix.
5. Heterogeneity analysis
5.1. Travel time to health center
Most ANC and FBD occur in primary-level facilities, primarily health centers. In the event of pregnancy complications, patients are expected to be referred to a district hospital for advanced care.Footnote 17 However, this referral process poses challenges when the hospital is located too far away or transportation is inadequate (Niyitegeka et al., Reference Niyitegeka, Nshimirimana, Silverstein, Odhiambo, Lin, Nkurunziza, Riviello, Rulisa, Banguti, Magge, Macharia, Habimana and Hedt-Gauthier2017; Aggarwal, Reference Aggarwal2021). Proximity to a hospital plays a crucial role in the ease of accessing advanced care in the event of pregnancy complications, potentially reducing the likelihood of early mortality. This possibility is explored in Figure 5.
Heterogeneity by Travel Time to District Hospital. Note: This figure compares the event study coefficients in (new) districts where travel time to the district hospital is short (<180 minutes) and long (>180 minutes). The specification is the same as column 4 of Table 3. See the notes of Table 3 for the list of control variables. Standard errors are clustered at the proper district level. See Appendix Figure A.5 for heterogeneity by the linear distance to hospitals.

I use the district-level average travel time to the closest district hospital provided by the 2005 EICV to divide the sample into two groups.Footnote 18 While using average travel time may seem less precise than actual distance measurements, it incorporates factors such as transportation means used by the average household and road availability, making it a more relevant metric than linear distance.Footnote 19, Footnote 20
Because mothers mostly visit health centers for FBD and ANC, the impact on FBD and ANC use is similar for both groups of districts in Panels (a)–(d). However, for mortality rates, some differences are observed. NMR7 and NMR decreased right after 2006 in districts where the district hospitals are closer. The decline is clearer for IMR; there was an immediate drop in IMR in closer districts, and the decline lasted for years. Although the differences in Panels (e)–(g) are not statistically different, the figures clearly show that there was a clear decline in mortality rates in districts where hospitals are close, suggesting the importance of proximity to health facilities.
5.2. Quality of health facilities
The quality of the health facility where mothers deliver a child plays an important role in reducing neonatal mortality. For example, Godlonton Okeke (Reference Godlonton and Okeke2016) and Renard (Reference Renard2022) find that FBD did not have a significant effect on overall neonatal mortality, but only in areas where there is a qualified health facility nearby, in Malawi and Zambia, respectively. Unfortunately, the data on health facility quality in Rwanda is limited, making it difficult to conduct a similar analysis.
Alternatively, I exploit a policy relevant to facility quality to estimate the heterogeneity in effect. One important change in health reforms is the expansion of the PBF scheme. This scheme started as a pilot program in three health districts in 2000 and then expanded nationwide in 2006-2008 with a staggered roll-out.Footnote 21 The policy intends to improve the quality of healthcare by rewarding health facilities based on their performance. Thus, if PBF was successful, health districts that implemented PBF earlier may have better quality health facilities. The impact of PBF on FBD and ANC in Rwanda is shown in Basinga et al. (Reference Basinga, Gertler, Binagwaho, Soucat, Sturdy and Vermeersch2011); Chari Okeke (Reference Chari and Okeke2014), but the impact on mortality rates is unclear in the literature. In fact, the quality of health facilities is still low in Rwanda compared to high-income countries, with improper infrastructure and ill-trained staff members (Rwanda Ministry of Health, 2022; Rurangirwa et al., Reference Rurangirwa, Mogren, Ntaganira, Govender and Krantz2018). Thus, the improvement in healthcare quality due to PBF may not be sufficient enough to reduce mortality rates.
I divide the districts by PBF implementation year following (Chari Okeke, Reference Chari and Okeke2014). Earlier districts are districts where PBF was implemented before 2008. Figure 6 shows that later districts relatively perform slightly better than earlier districts in terms of maternal health services (a)-(d)), although the difference is not statistically significant. On the other hand, a marginal reduction in mortality rates is observed in PBF early districts, especially after 2011. However, the estimates are very imprecisely estimated and the differences are not large enough to conclude that PBF has a positive effect on mortality rates. This result is consistent with Chari Okeke (Reference Chari and Okeke2014). The DiD estimation in Appendix Table A.5 also presents a similar result. The reduction in mortality rates is larger in earlier districts, but the difference is not statistically different. Nevertheless, because the impact of PBF on care quality in Rwanda is not well-known, we cannot conclude that healthcare quality does not play an important role in reducing deaths in Rwanda.
Heterogeneity by PBF, Note: This figure compares the event study coefficients in (new) districts where PBF was implemented earlier and later than 2008. The specification is the same as column 4 of Table 3. See the notes of Table 3 for the list of control variables. Standard errors are clustered at the proper district level.

6. Discussion and conclusion
Over the past few decades, many developing countries have aimed to lower financial barriers to maternal health services, but the evaluation of these programs remains controversial, with some showing disappointing impacts on maternal and neonatal mortality rates. Despite Rwanda's commendable success in increasing maternal health service utilization, there is limited understanding of its causal impact on mortality rates. This paper addresses this gap by offering empirical evidence on the effects of maternal healthcare on neonatal mortality in Rwanda.
Rwanda has received global acclaim for its achievements in promoting FBD and ANC through health policies initiated in 2006. Employing a DiD framework that considers variations in FBD rates before policy implementation, this study reveals that the reforms resulted in a significant 14-percentage-point increase in FBD. Furthermore, the health reforms led mothers to ANC visits 0.23 months earlier and increased ANC visits by 0.16 times. While there is weak evidence of a decline in neonatal mortality, the policy notably reduced NMR7 and NMR by 5.3 and 6.5 deaths per 1000 live births, respectively, with less clear effects in the event study specification. The proximity to district hospitals, where complicated pregnancies are addressed, emerges as a crucial factor, demonstrating a more substantial decline in mortality rates in districts with shorter travel times to the nearest hospital. Additionally, there is a more pronounced decline in mortality rates in districts where Performance-Based Financing (PBF) was implemented earlier, a factor anticipated to enhance the quality of health facilities, although the differences are not statistically significant.
Importantly, the policy's impact on maternal service use and mortality rates did not manifest immediately but with a lag. This underscores the necessity of considering a sufficient post-period when assessing policy effects—a critical insight for maternal health service research in developing countries, where studies often focus on relatively short periods. Additionally, the results emphasize the importance of access to high-quality health facilities, consistent with findings from other studies (Godlonton Okeke, Reference Godlonton and Okeke2016; Renard, Reference Renard2022; Okeke Chari, Reference Okeke and Chari2018). While Rwanda's healthcare system has made significant advances in improving accessibility, there is still room for development, particularly in providing universally high-quality care. This research contributes valuable insights for policymakers and underscores the ongoing path to enhance healthcare accessibility and quality.
Supplementary material
The supplementary material for this article can be found at https://doi.org/10.1017/dem.2024.7
Competing interests
None.


 Open access