


Introduction
Habitat loss is a global concern that has resulted in widespread biodiversity decline (Fahrig Reference Fahrig2003; Haddad et al. Reference Haddad, Brudvig, Clobert, Davies, Gonzalez and Holt2015). Habitat loss is often conflated with anthropogenic fragmentation of habitat, but the impact of habitat fragmentation on biodiversity depends on context (Fahrig Reference Fahrig2003). Fragmentation of habitat can affect biodiversity and species interactions, resulting in changes to local populations and species persistence (Baguette et al. Reference Baguette, Blanchet, Legrand, Stevens and Turlure2013). Conversely, fragmentation of a predominant vegetation type can create corridors of different (often earlier successional) habitats within the matrix, which can increase connectivity between isolated patches of the early successional habitat (Mann and Plummer Reference Mann and Plummer1995; Haddad et al. Reference Haddad, Rosenberg and Noon2001). Increases in suitable habitat for species in fragmented systems facilitate their movement by reducing barriers, thereby helping to sustain species richness (Merckx et al. Reference Merckx, Van Dyck, Karlsson and Leimar2003; Gilbert-Norton et al. Reference Gilbert-Norton, Wilson, Stevens and Beard2010; Haddad et al. Reference Haddad, Brudvig, Clobert, Davies, Gonzalez and Holt2015). However, differences in species behaviours make identifying generalisable responses to corridors challenging, because different species react to corridors in distinct ways according to their specific habitat preferences (Haddad et al. Reference Haddad, Rosenberg and Noon2001, Reference Haddad, Brudvig, Clobert, Davies, Gonzalez and Holt2015; Tewksbury et al. Reference Tewksbury, Levey, Haddad, Sargent, Orrock and Weldon2002; Dániel-Ferreira et al. Reference Dániel-Ferreira, Fourcade, Bommarco, Wissman and Öckinger2023).
Historically, habitat corridors have been considered in terms of wooded or planted corridors that connect patches of forested habitat (Haas Reference Haas1995; Mann and Plummer Reference Mann and Plummer1995). However, linear anthropogenic disturbances, such as powerlines or roads that cut through forests, can also act as corridors of earlier successional habitat that direct the movement of species (Gustafsson and Hansson Reference Gustafsson and Hansson1997; Haddad et al. Reference Haddad, Bowne, Cunningham, Danielson, Levey, Sargent and Spira2003; Öckinger and Smith Reference Öckinger and Smith2008; Berg et al. Reference Berg, Ahrné, Öckinger, Svensson and Wissman2013, Reference Berg, Bergman, Wissman, Żmihorski and Öckinger2016; Oki et al. Reference Oki, Soga, Amano and Koike2021; Dániel-Ferreira et al. Reference Dániel-Ferreira, Fourcade, Bommarco, Wissman and Öckinger2023). In the oil sands region of the boreal forest of Canada, narrow anthropogenic corridors are created by the removal of woody vegetation for exploration by the oil and gas industry (Fig. 1A), representing one of the most common types of forest fragmentation in affected areas (Lee and Boutin Reference Lee and Boutin2006; Viliani et al. Reference Viliani, Sutheimer and Nielsen2024). These corridors, called seismic lines, form a network of lines across approximately 1000 km2 (∼26% of Alberta, Canada’s total boreal forest area), with a total length of more than 300 000 km (Alberta Wilderness Association, no date; Riva and Nielsen Reference Riva and Nielsen2021). Seismic lines vary in width but are conventionally between 3 and 12 m wide (Lee and Boutin Reference Lee and Boutin2006). Removal of woody vegetation creates strips of early successional habitat within natural forest communities, which results in increased soil temperature, greater sunlight exposure, and greater wind speeds (Pattison et al. Reference Pattison, Quinn, Dale and Catterall2016; Dabros et al. Reference Dabros, Hammond, Pinzon, Pinno and Langor2017; Roberts et al. Reference Roberts, Ciuti, Barber, Willier and Nielsen2018; Stern et al. Reference Stern, Riva and Nielsen2018). As a result, many organisms can move longer distances by using the linear structure of seismic lines. Movement is known to increase along seismic lines for at least some butterflies (Riva et al. Reference Riva, Acorn and Nielsen2018b), bees (Nelson et al. Reference Nelson, Frost and Nielsen2021), birds (Haas Reference Haas1995; St. Clair et al. Reference St. Clair, Belisle, Desrochers and Hannon1998), wolves (Latham et al. Reference Latham, Latham, Boyce and Boutin2011), and invasive plants (Roberts et al. Reference Roberts, Ciuti, Barber, Willier and Nielsen2018).
A, An example of a seismic line used in this study in the Richardson area of the boreal forest in Alberta, Canada (photograph by C.J. Nelson). The study area had burned with a low-intensity surface fire in 2011. B, An example of Malaise trap placement for this study.

The impact of seismic lines has not been investigated for most North American boreal butterfly species, with previous studies focusing on only one species (Riva et al. Reference Riva, Acorn and Nielsen2018b). Increased connectivity between butterfly populations could contribute to sudden alterations in genetic diversity (most likely homogenisation) or increased ability to respond to climate change through distribution shifts (Keyghobadi et al. Reference Keyghobadi, Roland and Strobeck2005; Schneider et al. Reference Schneider, Hamann, Farr, Wang and Boutin2009). However, despite evidence of some butterfly species experiencing increased movement on seismic lines and other forms of linear anthropogenic disturbance (Haddad and Baum Reference Haddad1999; Haddad Reference Haddad2005; Riva et al. Reference Riva, Acorn and Nielsen2018b), not all species may behave in this way. Habitat fragmentation associated with seismic lines may be detrimental to species that rely on food plants that are only present in unfragmented forest habitat. Indeed, Berg et al. (Reference Berg, Ahrné, Öckinger, Svensson and Wissman2013) and Piccini et al. (Reference Piccini, Pittarello, Barberis, Lonati, Bonelli and Scalercio2024) have shown that vegetation composition shapes lepidopteran communities. Further investigation of more butterfly species would be helpful in assessing and more broadly understanding the impacts of seismic line development.
Butterflies have been shown to exhibit higher diversity on seismic lines than in adjacent intact peatland forests, likely due to a combination of increased floral resources, favourable microclimates, and canopy openness (Riva et al. Reference Riva, Acorn and Nielsen2018a). The effect of wide (> 5 m) and narrow (< 5 m) seismic lines on butterfly species diversity has been shown to differ, with lines of 3 m width not meaningfully altering butterfly species assemblages from surrounding interior peatland habitat (Riva et al. Reference Riva, Acorn and Nielsen2018a). Plant diversity is higher in early seral stages in the boreal forest than it is in mature stands (Pykälä Reference Pykälä2004), so we expect lower butterfly species richness and abundance in interior forest habitat because of butterfly reliance on the plant community for food resources (Dennis et al. Reference Dennis, Shreeve and Van Dyck2003). Understorey plant diversity is higher along seismic lines than in interior forest, similar to early seral stage conditions (Dawe et al. Reference Dawe, Filicetti and Nielsen2017; Riva et al. Reference Riva, Pinzon, Acorn and Nielsen2020; Nelson et al. Reference Nelson, Frost and Nielsen2021). In addition, seismic lines increase available solar energy compared to that in interior forest due to increased canopy openness (Nielsen et al. Reference Nielsen, Dennett and Bater2020; Nelson et al. Reference Nelson, Frost and Nielsen2021). We predict that butterfly species richness increases on seismic lines due to resource selection.
One habitat generalist butterfly species, Boloria chariclea Schneider (Lepidoptera: Nymphalidae), preferentially moved along seismic lines as narrow as 4 m in peatland boreal forest immediately after individuals were hand-released (Riva et al. Reference Riva, Acorn and Nielsen2018b). Other linear anthropogenic disturbances increase the butterfly dispersal rate and increase butterfly density in habitat patches connected by seismic lines (Haddad Reference Haddad1999; Haddad and Baum Reference Haddad and Baum1999). However, butterfly movement behaviour can differ significantly among species that occupy the same habitat, although butterflies that rely on the same food resources typically exhibit similar movement behaviour (Scott Reference Scott1975; Baguette et al. Reference Baguette, Petit and Quéva2000). The specific movement response of butterflies to seismic lines has been examined only for B. chariclea. A greater diversity of butterflies may exhibit a variety of movement behaviours, especially if the assemblage is sufficiently diverse as to require a variety of food resources. As such, investigating a variety of species would help to assess the effects of seismic lines on butterflies as a group.
The objectives of this study were to investigate (1) whether conventional seismic lines between 6 and 12 m in width affect the abundance, species richness, and diversity of butterflies collected using Malaise traps relative to adjacent interior forests, and (2) whether butterflies travel along conventional seismic lines more frequently than they travel across them but show no comparable directional preference in forest interiors. We hypothesised that conventional seismic lines have higher abundance and species richness of butterflies than the adjacent interior forest does due to increased availability of plant resources. We also hypothesised that most butterflies use these lines as movement corridors and preferentially travel along lines rather than across them due to the increased availability of solar energy from reduced canopy cover and greater availability of floral resources.
Methods
All data used for this study were gathered for a study assessing the effects of conventional seismic lines on bee species in Alberta, Canada’s oil sands, which is described in Nelson et al. (Reference Nelson, Frost and Nielsen2021). Although the capture methods used by Nelson et al. (Reference Nelson, Frost and Nielsen2021) were designed for collecting bees, Malaise traps have been shown to be as effective as pan traps or window traps for sampling butterflies (Campbell and Hanula Reference Campbell and Hanula2007; Lamarre et al. Reference Lamarre, Molto, Fine and Baraloto2012), even though Malaise traps tend to capture a lower diversity than baited traps do (Schmidt et al. Reference Schmidt, Schmidt, Häuser, Hausmann and Lien2019).
Study area and site selection
We used the Richardson area of Alberta’s boreal forest, approximately 100 km north of Fort McMurray, Alberta, Canada (57° 32′ 31.2′′ N, 111° 16′ 55.2′′ W), to examine butterfly responses to seismic line disturbances. This area contains conventional seismic lines that range from 6 to 12 m in width, cross the landscape in a grid pattern at densities of 1.5 km/km2 on average, and can reach local maxima of 20 km/km2 (Lee and Boutin Reference Lee and Boutin2006). The Richardson uplands are characterised by dry, sandy soils that are dominated by jack pine, Pinus banksiana Lambert (Pinaceae), forests, and semi-open lichen woodlands that experience periodic low-intensity wildfires, with regeneration of jack pine (Filicetti and Nielsen Reference Filicetti and Nielsen2018). The study area had recently burned with a low-intensity surface fire in 2011 (Fig. 1A).
We selected five conventional seismic lines at least 300 m apart and never on the same line on the grid (different direction or intersected by a major landscape feature; Supplementary material, Fig. S1). All sites were at least 50 m away from any other source of local disturbance, such as roads or well pads. Each site consisted of two 30-m-long parallel transects, one along the seismic line centre and the other 50 m into the adjacent forest interior, assigned randomly to either side of the line. We chose 50 m as the adjacent forest distance due to space limitations, because seismic lines were 100 m apart in most places. Dabros et al. (Reference Dabros, Hammond, Pinzon, Pinno and Langor2017) and Dawe et al. (Reference Dawe, Filicetti and Nielsen2017) found differences between seismic line and forest interior sites at only 25 m, and Harper et al. (Reference Harper, Macdonald, Burton, Chen, Brosofske and Saunders2005) found most forest edge effects within the boreal forest region do not reach further into the forest than 50 m, allowing us to consider locations 50 m from the corridors as interior forest.
Butterfly collection
We used Malaise traps to measure the directional movement of butterflies, including counts, species richness, and diversity. The traps were obtained from the Natural History Book Service (NHBS; Totnes, Devon, United Kingdom) and have two large openings on opposite sides of the trap, allowing them to collect insects flying from either direction along a single axis. We placed Malaise traps at the five sites (10 transects, paired, with each pair consisting of one transect in a seismic line and one parallel transect located 50 m into the adjacent forest, as described in the Study area and site selection section, above). We set two traps per transect, one to catch insects flying along the transect and the other oriented to catch insects flying perpendicularly to the transect. One trap was placed at each end of the transect, meaning that Malaise traps were approximately 30 m apart from one another (Fig. 1B; Supplementary material, Fig. S2). We left the Malaise traps out continuously from 5 May to 27 July 2019 and periodically collected the insects and reset the traps. Sample collections at a given site occurred between 48 and 358 hours apart (when weather or access logistics prevented returning to the trap in 48 hours). Despite that difference in collection timing, the total sampling effort was equal at all sites, with all insect samples pooled for a single composite value per trap. We collected samples within a few minutes of one another within each site. We stopped sampling all traps at a site if a trap was damaged until a complete set of Malaise traps was available. The seismic lines, and therefore the transects, were oriented in different directions at different sites, with two running north–south and three running east–west, and as a result, the prevailing wind direction differed in relation to the orientation of the Malaise traps. We identified all butterfly specimens to species using guidebooks (Bird et al. Reference Bird, Sperling, Pike, Kondla and Hilchie1995; Acorn and Sheldon Reference Acorn and Sheldon2006).
Statistical analysis
We assessed whether differences in butterfly counts in Malaise traps were due to transect type, trap orientation, or the interaction between these two variables. We did this by fitting a generalised linear mixed model with a negative binomial distribution, with total butterfly count per trap, pooled across the season, as a response variable. We included transect type (seismic line or interior forest), trap orientation (parallel or perpendicular to the seismic line), and the interaction between transect type and orientation as fixed effects, and site as a random effect. We controlled for small variations in sampling effort by including the logarithm of the total number of hours that each trap was open as an offset. To test whether the interaction and both main effects were significant, we also fitted all nested versions of the model with simpler fixed-effects structures and used AICc (Akaike’s information criterion corrected for small sample size) to select the best model. If the interaction was nonsignificant (i.e., excluded during model selection), we calculated P-values for each main effect by using log-likelihood ratio tests to compare the model without that main effect to a model with both additive main effects (if both were kept in the final model) or to compare the model with the main effect to a null model without any fixed effects but with the same offset and random factor structure (if only one main effect was kept in the final model). We tested dispersion and the assumptions of homogeneity of variances and normality of residuals, the specifics of which are discussed at the end of the Methods section. For all models, all assumptions were met.
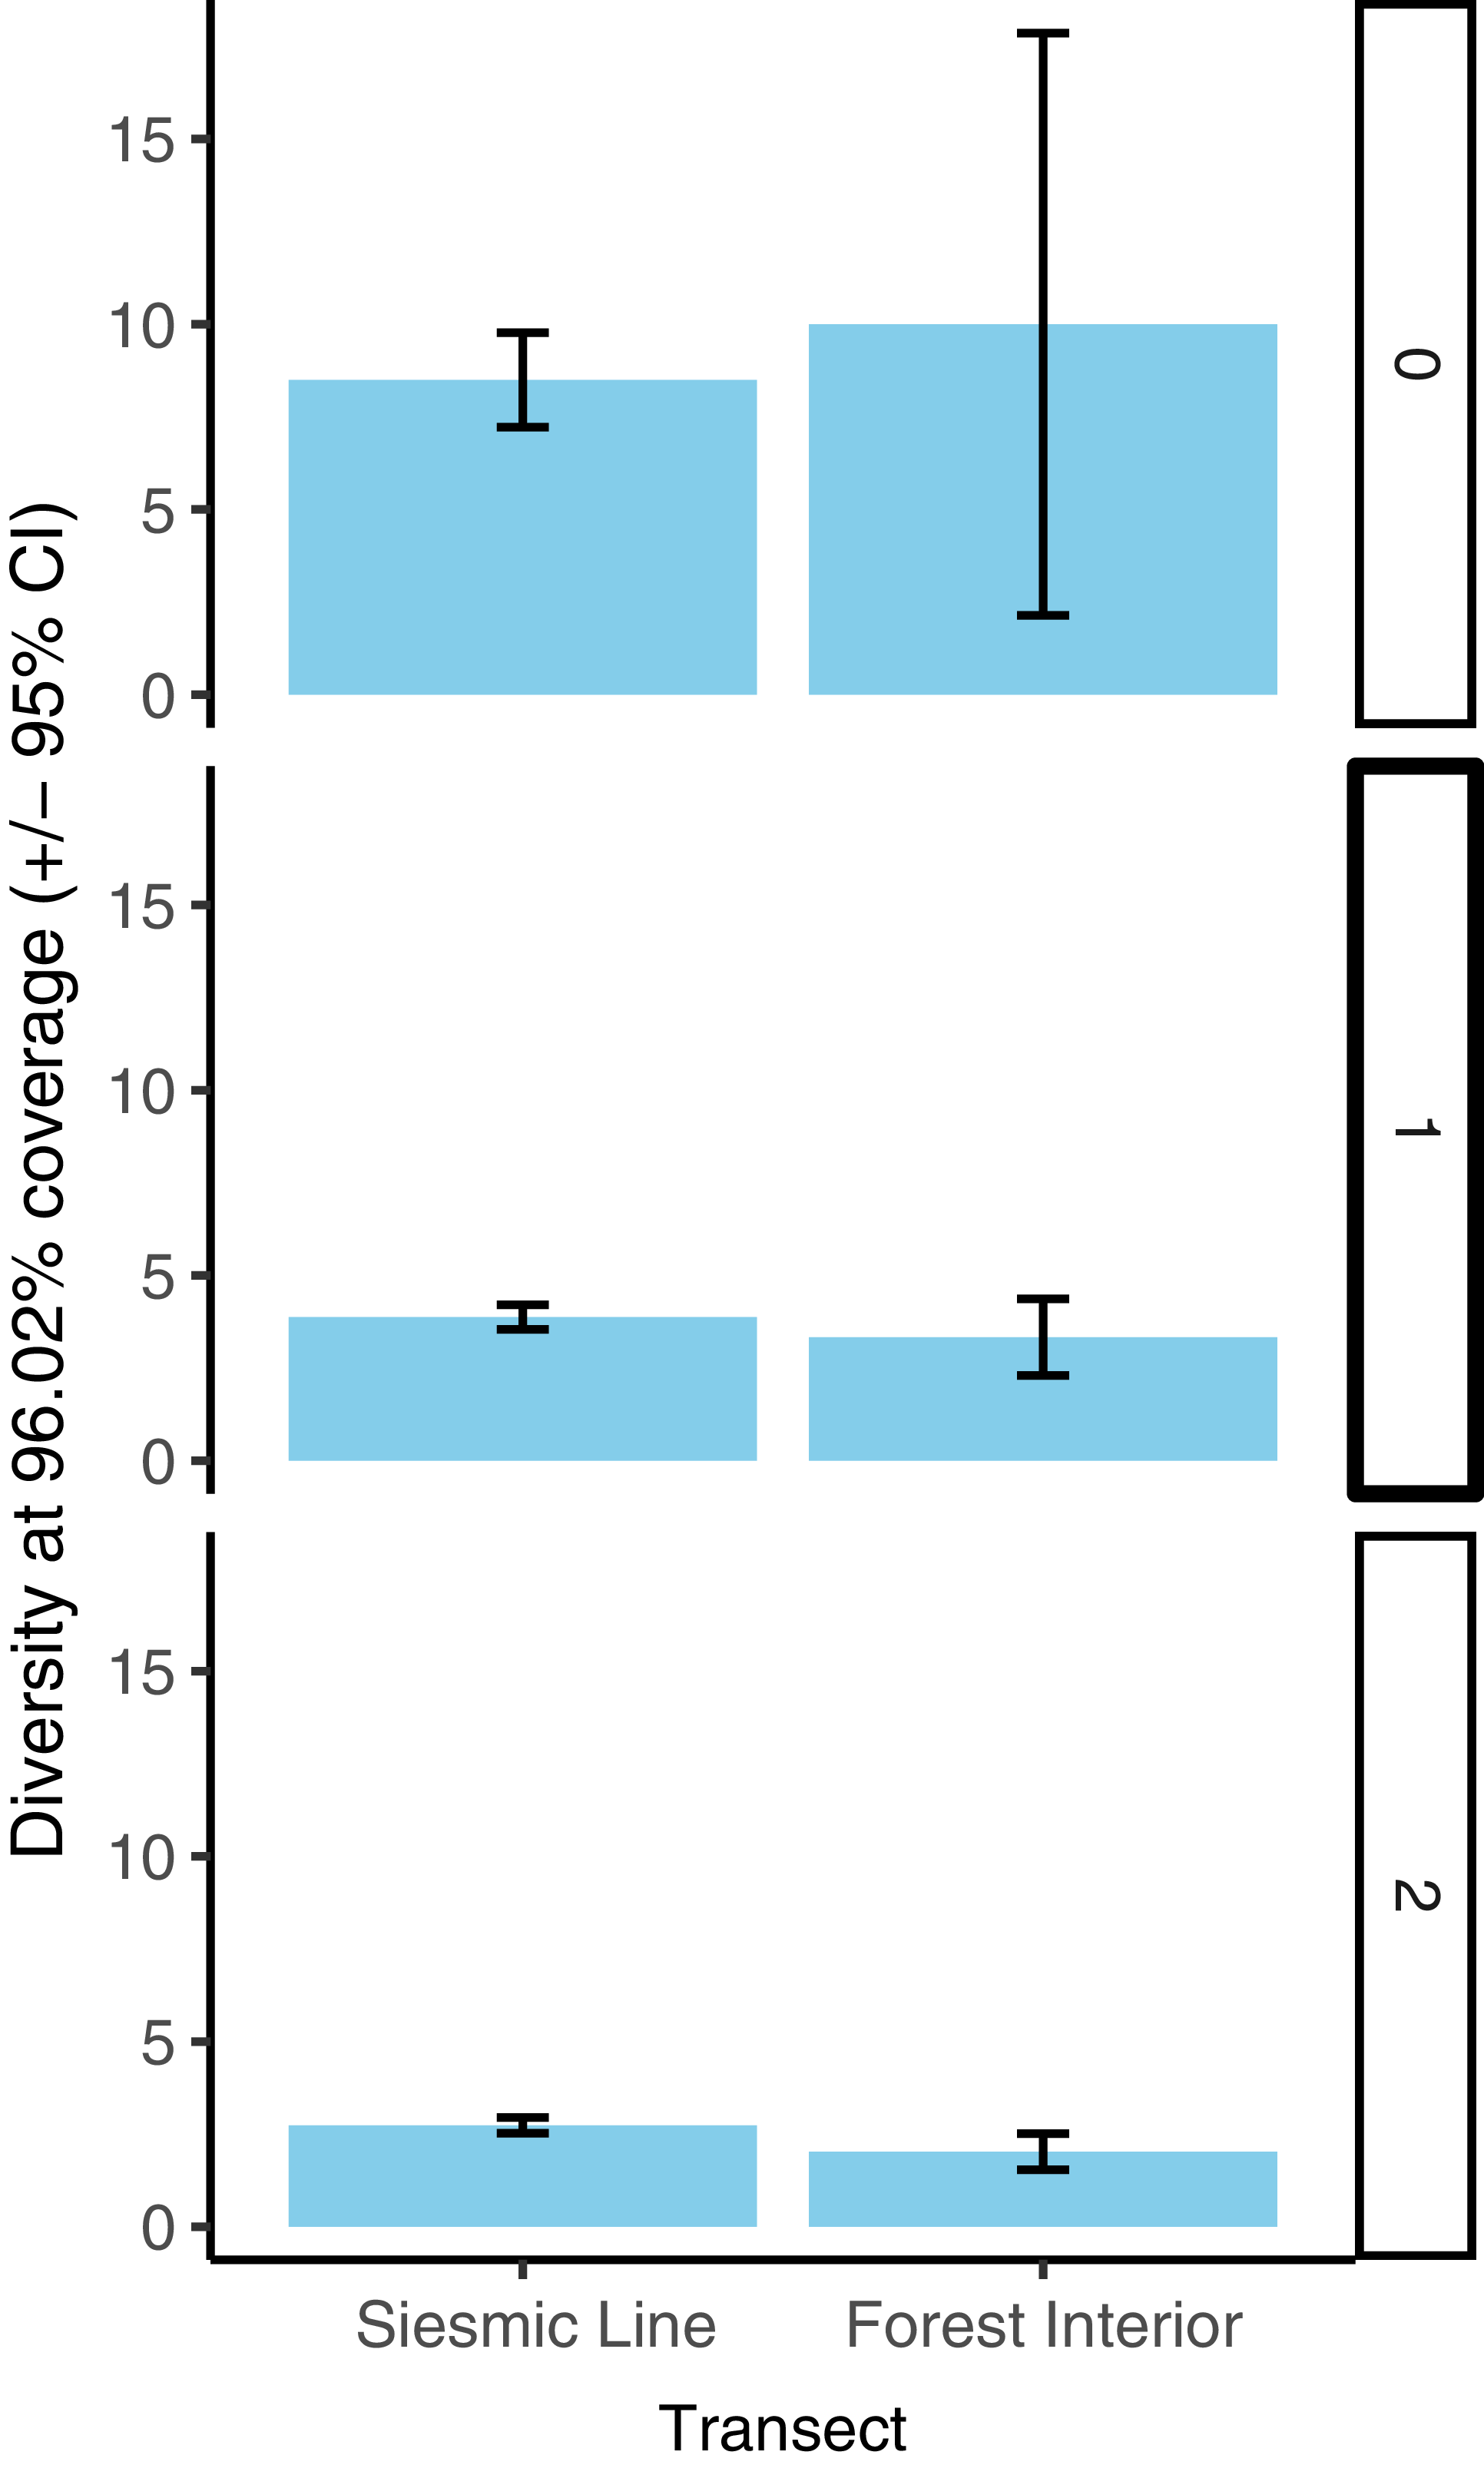
We compared rarefied species richness and diversity (Hill numbers 0, 1, and 2) for each transect type, trap orientation, and transect type–trap orientation combination using coverage-based rarefaction. We pooled specimens within transect type, within trap orientation, and within transect type–trap orientation combination and calculated sample coverage. Using the minimum coverage, we calculated diversity (Hill numbers of q = 0, 1, and 2), rarefied diversity (for factor levels higher than minimum coverage), and bootstrapped 95% confidence intervals, where 500 bootstrap iterations were used. We considered diversity values to be significantly different if their 95% confidence intervals did not overlap. We follow Chao et al. (Reference Chao, Gotelli, Hsieh, Sander, Ma, Colwell and Ellison2014) in interpreting Hill number = 0 (species richness) as diversity of all species, where rare species are weighted heavily; Hill number = 1 as diversity of “typical” species (in terms of their relative abundance); and Hill number = 2 as diversity of dominant species (again, in terms of their relative abundance).
We noticed during collection that many of our observations were of three common species: Celastrina lucia Kirby (Lepidoptera: Lycaenidae), Boloria freija Thunberg (Lepidoptera: Nymphalidae), and Callophrys niphon Hübner (Lepidoptera: Lycaenidae). To test whether dominant species were driving the observed pattern in counts, we repeated our counts analysis with three different subsets of our data: only C. lucia, the three most abundant species, and the dataset minus the three most abundant species. We fitted generalised linear mixed models with the same structure as described above, with counts of C. lucia alone as the response variable in the first model, with counts of the three dominant species as the response variable in the second model, and with counts of the nondominant species as the response variable in the third model. Each model contained transect type, trap orientation, and their interaction as fixed effects, site as a random effect, and the logarithm of the total number of hours each trap was open as an offset. We used model selection as described above.
Finally, to determine if a wind event or series of wind events may have impacted the results of our flight direction analysis, we tested whether a trap’s cardinal direction was associated with its catch. We fitted a generalised linear mixed model with a negative binomial distribution with total butterfly count, pooled across the season for that trap, as the response variable; transect type, seismic line cardinal orientation (collecting north–south or east–west), and their interaction as fixed effects; site as a random effect; and the logarithm of the total number of hours that each trap was open as an offset, and conducted model selection as described above. We report P-values generated as described above and effect sizes from the raw data. Figures show means and standard errors calculated from the raw data, rather than model-estimated means and standard errors. All error presented in the text is standard error.
We used R for all statistical analyses, including the tidyverse packages (R Core Team 2020; Wickham et al. Reference Wickham, Vaughan and Girlich2023a; Reference Wickham, Vaughan and Girlich2023b) and the lme4 package (Bates et al. Reference Bates, Mächler, Bolker and Walker2015), to fit the generalised linear mixed models. We used the iNEXT.4steps package (Chao et al. Reference Chao, Kubota, Zelený, Chiu, Li and Kusumoto2020) to calculate observed and extrapolated diversity and their 95% confidence intervals for both main effects and the interaction. For generalised linear mixed models, we tested dispersion and the assumptions of homogeneity of variances and normality of residuals using the testDispersion, testQuantiles, and plotQQunif functions, respectively, in the DHARMa package (Hartig Reference Hartig2022), which perform these tests on simulated residuals.
Results
Due to animal and environmental interference with the sampling, only 184 Malaise trap samples were collected out of the 260 Malaise trap samples originally set (∼30% trap loss). However, mean sampling effort was very similar across transect types and orientations, with slightly higher collection effort in interior forests and parallel-oriented traps therein (seismic line parallel: 1424 hours; seismic line perpendicular: 1444 hours; interior parallel: 1577 hours; interior perpendicular: 1525 hours; the mean ± 1 (standard error) overlapped in all cases, suggesting no significant differences in collecting effort by treatment combination). We identified a total of 895 butterflies in 16 species from the total of 34 243 hours of trapping time (Nelson et al. Reference Nelson, Frost and Nielsen2021).
Butterfly movement
In all analyses of butterfly abundance (counts), including for the full dataset and all subset analyses, the best model did not include the interaction between trap orientation and transect type, indicating that this interaction was nonsignificant (full dataset interaction: χ2 = 0.8, P = 0.358). However, we observed a strong trend towards an interaction, in that the difference in mean butterfly count in perpendicular-oriented traps minus parallel-oriented traps was 117.6 butterflies on seismic lines and only nine butterflies in forest interiors (Fig. 2A). Notably, the standard error on perpendicular-oriented seismic line Malaise trap abundance was very high, in part due to one trap collection from a single date yielding 133 butterflies of the species C. lucia, which accounts for more than one-tenth of our total dataset. More butterflies were collected in seismic lines (80.2 ± 37.5) than on forest interior (10.3 ± 4.5) transects (χ2 = 11.9, P < 0.001) and in perpendicular (76.9 ± 37.9) rather than in parallel (13.6 ± 5.7) trap orientation (χ2 = 6.9, P = 0.009).
Mean (± standard error) counts of A, all butterflies; B, Celastrina lucia; C, dominant butterflies (C. lucia, Boloria freija, and Callophyris niphon); and D, nondominant butterflies (all species but the three dominant species) per Malaise trap over the season on seismic lines versus interior forests, in parallel-oriented traps (dark grey) and perpendicularly oriented traps (light grey). Note that the y-axis scale varies among graphs. The means and standard errors indicated are calculated from the raw data and are not model-estimated means and standard errors.

The species diversity analysis showed high sample coverage across treatments and treatment combinations (maximum: 99.49% coverage on seismic lines with orientations pooled; minimum: 93.56% coverage in interior forest parallel-oriented traps). Diversities of all (Hill number 0) and of typically abundant (Hill number 1) species did not differ significantly between seismic line and interior forest transects (Figure 3 shows the overlapping confidence intervals). However, diversity of dominant (Hill number 2) species was slightly but significantly higher in seismic lines (diversity = 2.73) than on interior forest transects (diversity 2.03; Fig. 3). Diversity of all (Hill number 0) species did not differ significantly by trap orientation (Fig. 4), but diversity of typically abundant (Hill number 1) and dominant (Hill number 2) species were both slightly but significantly higher in perpendicular-oriented traps than in parallel-oriented traps when data were pooled across transects (Fig. 4). The effect of trap orientation on butterfly diversity captured did not differ significantly by transect for all (Hill number 0) species (Figure 5 shows overlapping error bars for q = 0). However, for typically abundant species (Hill number 1) and dominant species (Hill number 2), the difference in diversity captured by perpendicular-oriented versus by parallel-oriented traps was higher on forest interior transects than on seismic line transects (Fig. 5).
Butterfly species richness (q = 0), diversity of typically abundant species (q = 1), and diversity of dominant species (q = 2) at constant (96.02%) sample coverage for traps on seismic line and interior forest transects. Error bars represent 95% confidence intervals calculated from 500 bootstrap iterations. The level of coverage used was the minimum coverage among transects (interior forest), and diversity values for the seismic line transect type represent coverage-based rarefied diversity.

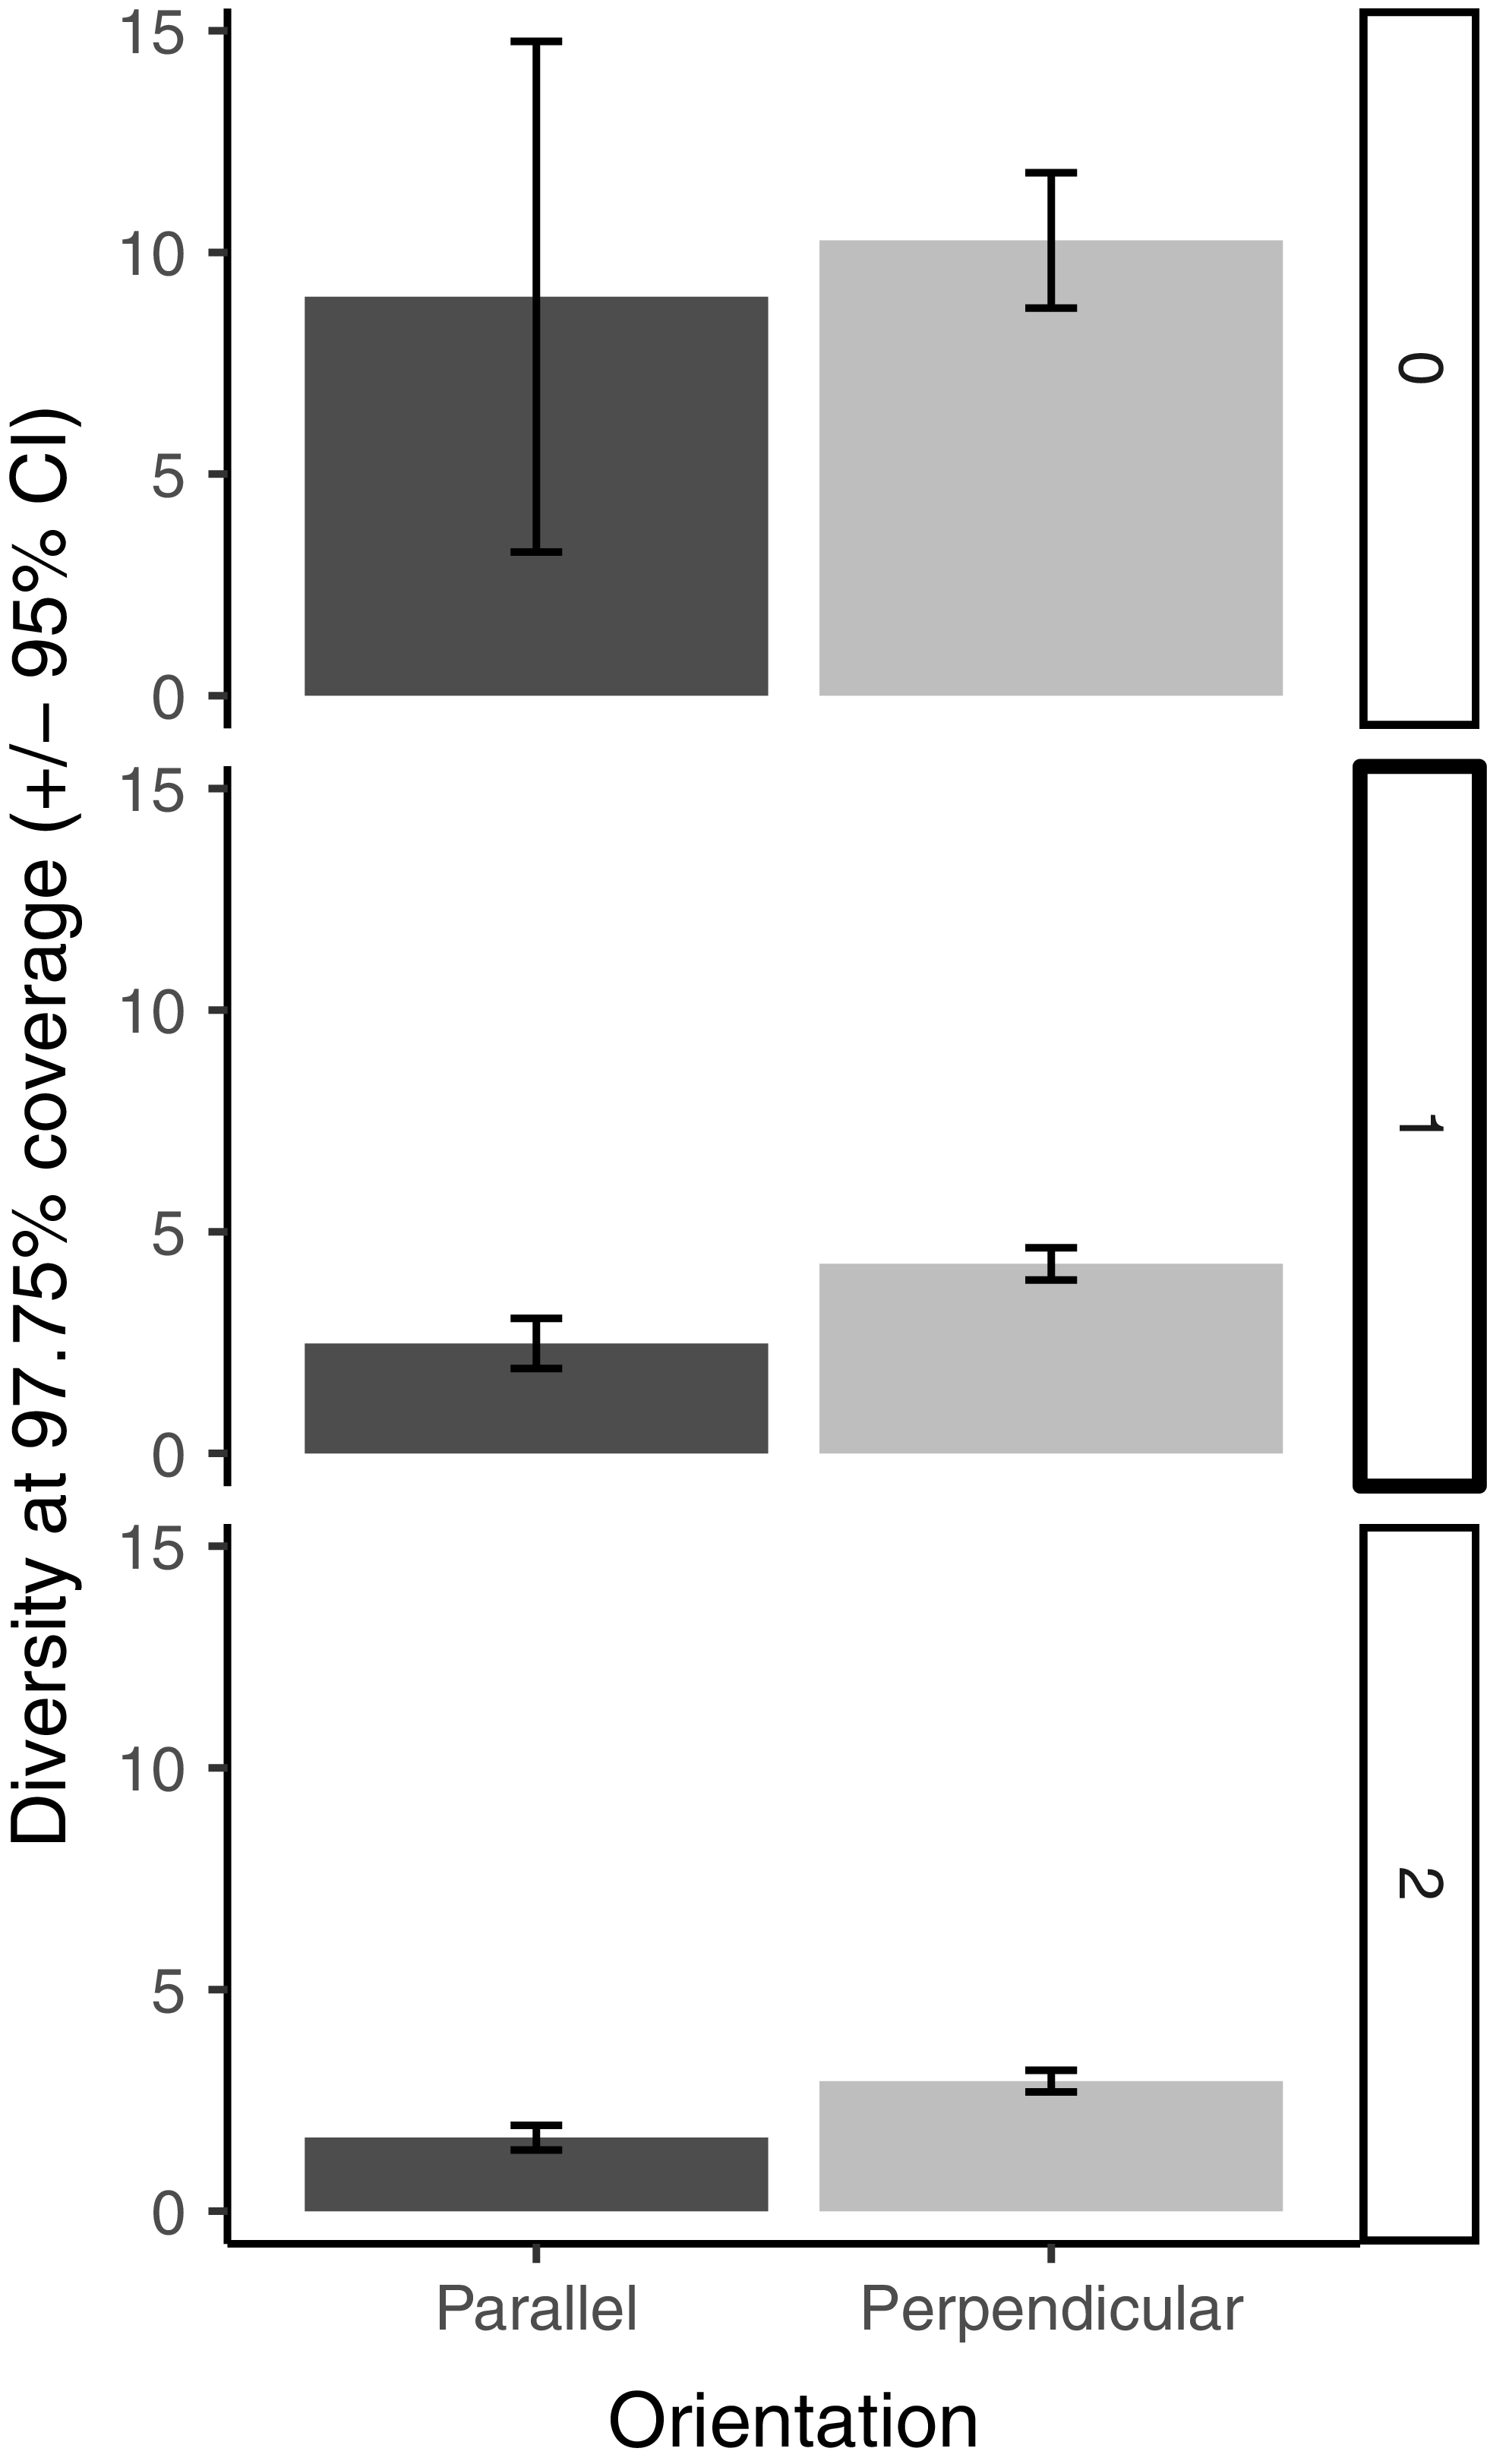
Butterfly species richness (q = 0), diversity of typically abundant species (q = 1), and diversity of dominant species (q = 2) at constant (97.75%) sample coverage for traps on seismic line and interior forest transects. Error bars represent 95% confidence intervals calculated from 500 bootstrap iterations. The level of coverage used was the minimum coverage among trap orientations (parallel), and diversity values for the perpendicular trap orientation represent coverage-based rarefied diversity.

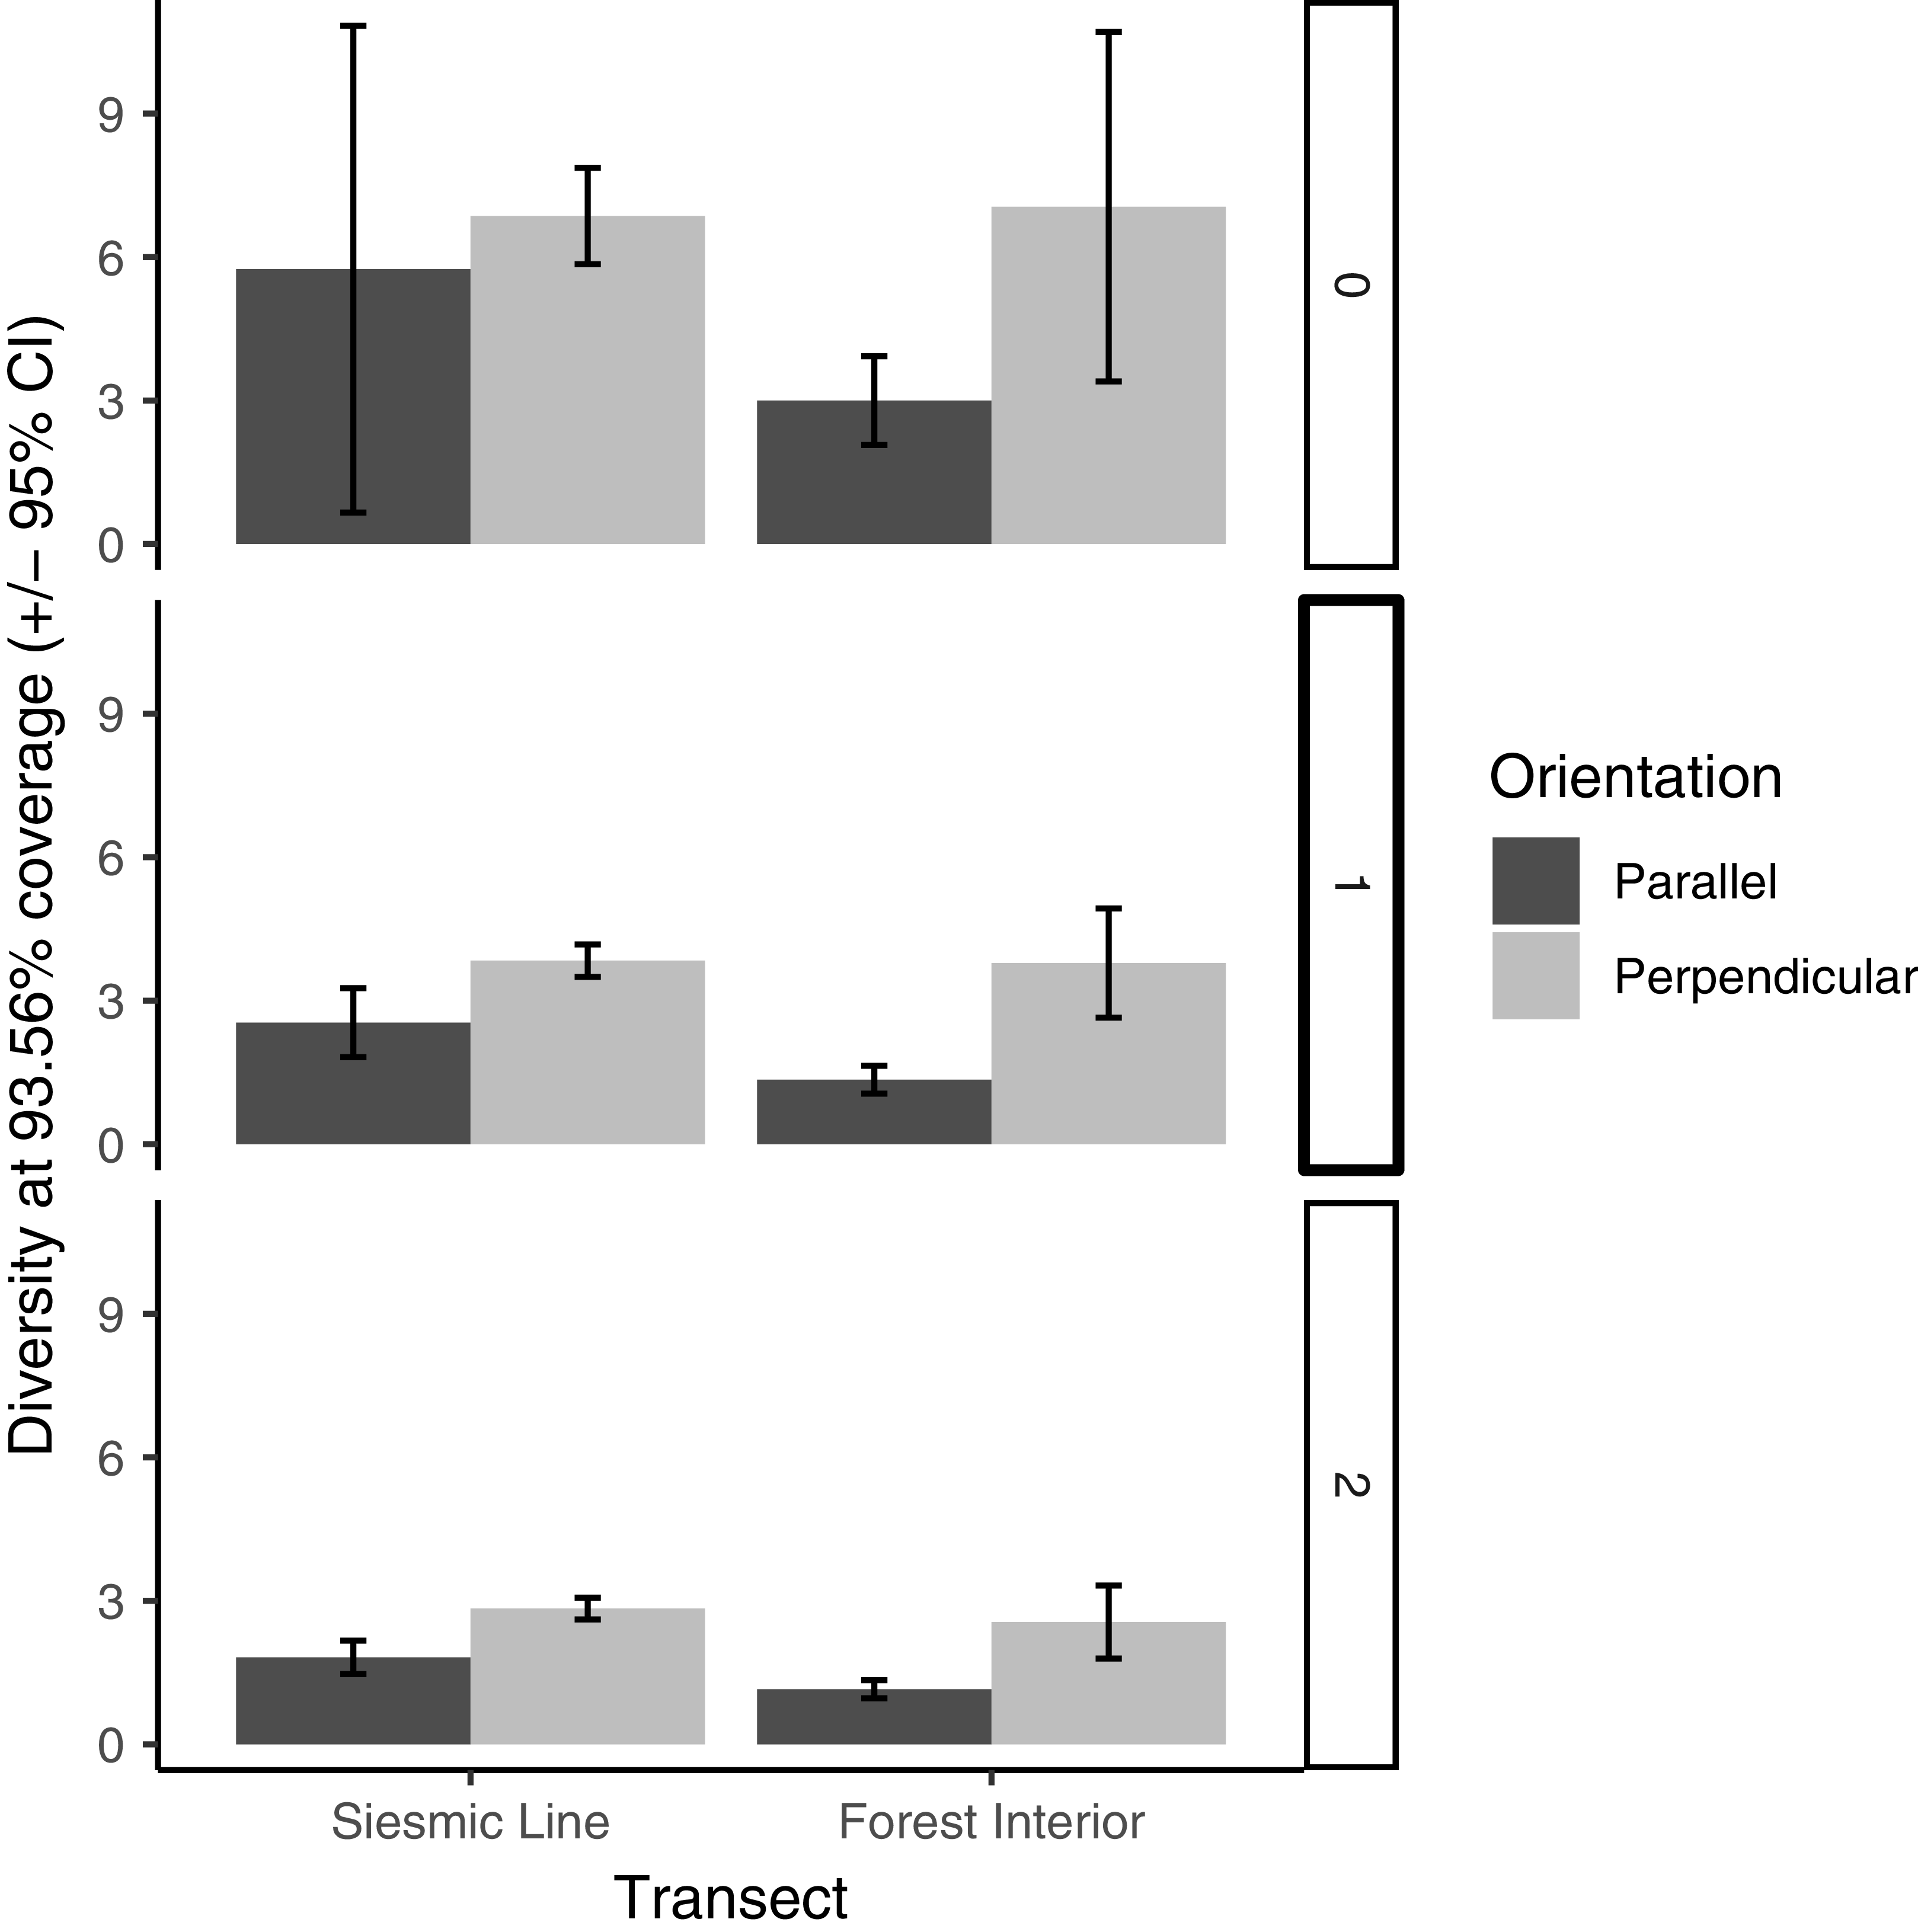
Butterfly species richness (q = 0), diversity of typically abundant species (q = 1), and diversity of dominant species (q = 2) at constant (93.56%) sample coverage for traps with orientation parallel and perpendicular to seismic lines, on seismic line and interior forest transects. Error bars represent 95% confidence intervals calculated from 500 bootstrap iterations. The level of coverage used was the minimum coverage among all transect–orientation combinations (interior forest – parallel), and diversity values for all other transect–orientation combinations represent coverage-based rarefied diversity.

In all cases, diversity captured in perpendicular-oriented traps was similar between transect types, but diversity captured in parallel-oriented traps was lower in forest interiors than in seismic lines (Fig. 5). The greatest difference in diversity observed across transect and orientation combinations, for any Hill number, was small, with a difference of four species for Hill number 0 (species richness) between forest interior perpendicular (seven species) and parallel traps (three species). The butterfly count by transect type, line orientation, and their interaction was not significantly associated with sampling on either the east–west- or north–south-oriented transects. (We removed the main effect of cardinal direction and all interactions during model selection.) We collected 34.2 (± 13.5) butterflies flying north–south and 56.3 (± 38.6) butterflies flying east–west.
Species subset movement analysis
Of all of our butterfly samples, 52.3% comprised C. lucia individuals, 18.1% comprised B. freija individuals, and 10.8% comprised C. niphon individuals. These species comprised approximately 81.2% of the total butterflies collected (Supplementary material, Table S1, Fig. S3). We detected no significant interaction between transect type and trap orientation (removed during model selection) for abundance of C. lucia, the three dominant species, and the nondominant species. We found the same trend of a strong interaction (Fig. 2B–D), which mirrored the pattern in the full dataset (Fig. 2A), where none of these species subsets drove the overall pattern. Abundance of C. lucia was significantly and positively associated with sampling on seismic lines (χ2 = 7.7, P = 0.005) but not significantly associated with trap orientation (removed during model selection). However, perpendicular-oriented traps on the seismic line exhibited a mean count of C. lucia that was almost five times higher (71.2 ± 43.9) than for parallel-oriented traps on the seismic line (14.8 ± 8.3; Fig. 2B). The count of C. lucia, B. freija, and C. niphon as a group was also significantly affected only by transect type, with more butterflies caught in seismic lines than in forest interiors (χ 2 = 9.7, P = 0.002). However, perpendicular-oriented traps on the seismic lines had a mean count of the three dominant species that was more than six times higher (118.6 ± 61.6) than that of parallel-oriented traps on the seismic line (19.0 ± 10.6; Fig. 2C). With records of C. lucia, B. freija, and C. niphon removed, the count of the remaining, nondominant butterfly species was significantly explained by the additive effects of transect type, with more butterflies collected in seismic lines than in interior forest (χ 2 = 10.0, P = 0.002), and trap orientation, with more butterflies collected in perpendicular-oriented traps (χ 2 = 14.6, P < 0.001) than in parallel-oriented traps. Again, we detected a trend towards an interaction, in that the difference in mean butterfly count in perpendicular-oriented traps minus parallel-oriented traps was 18 butterflies on seismic lines as compared to butterflies found in forest interiors (Fig. 2D).
Discussion
We found that butterflies were almost eight times more abundant on conventional seismic lines than in the interior forest, as captured in Malaise traps. We found that the diversities of typically abundant (Hill number 1) and dominant (Hill number 2) butterfly species were slightly higher in perpendicular-oriented Malaise traps and that the diversity of dominant butterfly species was slightly higher on seismic lines. Our results suggest that the increase in butterfly abundance and the diversity of typically abundant and dominant species resulted from an attractive effect of conventional seismic lines. In particular, the greater difference in the diversities of typically abundant and dominant species between Malaise trap orientations on interior forest transects as opposed to seismic line transects indicates that seismic lines may exhibit an attractive effect to some butterfly species even 50 m into the forest. This increase in abundance is unsurprising, being consistent with previous research on butterfly responses to linear clearings in North American forests (Haddad Reference Haddad1999, Reference Haddad2005; Riva et al. Reference Riva, Acorn and Nielsen2018a).
The reason why we did not find significant differences in butterfly richness between seismic lines and forest interiors, even though Riva et al. (Reference Riva, Acorn and Nielsen2018a) did, may be because our Malaise traps detected fewer species (16 species) than Riva et al.’s (Reference Riva, Acorn and Nielsen2018a) Pollard walks did (43 species). However, our use of bidirectional Malaise traps allowed us to examine the behaviour of directional flight. Differences in butterfly diversity responses for different Hill numbers reflect uneven species assemblages. This suggests that our results were impacted by the dominant species in our dataset. Malaise traps have been shown to capture a lower diversity of lepidopteran species than baited or light traps do (Campbell and Hanula Reference Campbell and Hanula2007; Schmidt et al. Reference Schmidt, Schmidt, Häuser, Hausmann and Lien2019). In addition, Malaise traps may favour smaller butterflies and those that fly lower to the ground (Lamarre et al. Reference Lamarre, Molto, Fine and Baraloto2012), which may explain why our data are dominated by small species. It also suggests that our findings may not apply to larger, higher-flying butterfly groups.
We caught almost six times more butterflies and a greater diversity of typically abundant and dominant butterflies travelling across seismic lines rather than along them. The abundance of butterflies travelling across seismic lines was significantly higher than that of butterflies travelling along seismic lines. The difference in butterfly abundance was much smaller with regard to Malaise trap orientations within the interior forests (Fig. 2A–D). That said, we found a trend towards greater abundance of butterflies on perpendicular-oriented traps in the interior forest transects. This suggests that butterflies were attracted to the seismic lines but preferred to travel across them rather than along them. This difference in directional catches is intriguing, given the very high effect size observed, and is inconsistent with previous research on the effect of seismic lines on butterfly travel for B. chariclea, as well as prior research into the behaviour of other pollinator species (Riva et al. Reference Riva, Acorn and Nielsen2018b; Nelson et al. Reference Nelson, Frost and Nielsen2021). Notably, previous research with B. chariclea in Alberta was performed by recording the direction of escape flight immediately after butterfly release rather than by trapping, which may have affected butterfly behaviour (Riva et al. Reference Riva, Acorn and Nielsen2018b). Additionally, Riva et al.’s (Reference Riva, Acorn and Nielsen2018b) research occurred in a peatland boreal forest, rather than in an upland boreal forest like our own research. We believe that the environmental factors that would influence butterfly movement (such as increased solar and floral resources on seismic lines) would be similar in both peatland and upland boreal forest; for this reason, we believe butterfly behaviour can be compared among studies despite the differences in habitat.
Our analysis of the effect of seismic line cardinal orientation on butterfly abundance in Malaise traps indicated that an effect of the prevailing wind direction or large wind events should not have driven the butterfly movement results that we have found. In addition, these results cannot be explained by any underlying preference for flight in specific cardinal directions, because the orientations of seismic lines varied throughout the study. Although seismic line orientation does affect local microclimates, with the greatest difference observed on east–west-oriented lines (Franklin et al. Reference Franklin, Filicetti and Nielsen2021), the mix of line orientations in our study minimised the effect of orientation confounding the observed directions of flights. Although we did not sample in such a way as to determine the mechanism behind butterflies preferentially flying across rather than along seismic lines, we have several ideas that may, in part, explain our findings. We discuss these below.
Broad taxonomic representation
One possible explanation for our findings is that our study had wider taxonomic representation than previous studies on the effect of corridor systems on butterfly species. Research in other corridor systems suggests that butterfly responses to corridors differ even within closely related taxa (Haddad et al. Reference Haddad, Bowne, Cunningham, Danielson, Levey, Sargent and Spira2003) and that modes of butterfly movement between patches of habitat can differ considerably even among butterflies adapted to highly similar environmental conditions (Baguette et al. Reference Baguette, Petit and Quéva2000). This leads us to suspect that our movement direction results may be in part the result of wider taxonomic representation of butterfly species (23 species) compared to previous research on butterfly movement behaviour in corridors, which focused on only one or two species, in addition to different methods for sampling flight direction (Haddad Reference Haddad2005; Riva et al. Reference Riva, Acorn and Nielsen2018b).
Based on species range maps found in Bird et al. (Reference Bird, Sperling, Pike, Kondla and Hilchie1995), approximately 25 butterfly species should be found in this region, suggesting that we sampled around 64% of the species assemblage (Bird et al. Reference Bird, Sperling, Pike, Kondla and Hilchie1995). More butterflies may be expected, because 43 butterfly species have been observed in Wood Buffalo National Park, which is also in Alberta’s boreal forest (Riva et al. Reference Riva, Acorn and Nielsen2018a).
Resource-seeking behaviour
Another possible explanation for our findings is that butterfly movement was better motivated by resource-seeking behaviour than the avoidance of undesirable environmental conditions. Although butterflies have been shown to treat areas of undesirable environmental conditions (i.e., interior forest) as a partial movement barrier (Merckx et al. Reference Merckx, Van Dyck, Karlsson and Leimar2003), research also suggests that the presence of food resources better defines butterfly habitat than other environmental conditions (Dennis et al. Reference Dennis, Shreeve and Van Dyck2003). In the present study, seismic lines may have maintained their attractive effect due to higher temperatures, higher light levels, and ease of movement along the linear corridors, but foraging options within the forests to the sides of the seismic line decreased the effect of line direction on the direction of butterfly flight, which contributed to a more meandering flight path in these butterflies. The desired food plants of some butterflies also may be more common on seismic lines than in interior forest habitat, inducing shrub-loving species like C. lucia and B. freija to fly towards seismic lines where they encounter them on the forest edge.
Floral resources on seismic lines are greater than in the adjacent interior forest in the study area (Nelson et al. Reference Nelson, Frost and Nielsen2021), which may result in an attractive effect towards the seismic lines that is not attenuated until the butterflies cross the line and encounter the lower floral resource density on the other side. Greater floral resources on seismic lines may also explain why we caught more butterflies in the seismic lines and in perpendicular-oriented Malaise traps within the interior forest, because the attractive effect may extend into the interior forest, drawing even butterflies that are far away towards the seismic lines. Celastrina lucia and B. freija are both species that feed on nectar and lay their eggs primarily on shrubby species, which include red-osier dogwood, Cornus sericea Linnaeus (Cornaceae), as well as velvet leaf blueberry, Vaccinium myrtilloides Michaux (Ericaceae), bearberry, Arctostaphylos uva-ursi Sprengel (Ericaceae), cranberry species, Viburnum spp. Linnaeus (Adoxaceae) or Vaccinium spp. Linnaeus (Ericaceae), and other shrubs in the family Ericaceae (Bird et al. Reference Bird, Sperling, Pike, Kondla and Hilchie1995). That said, C. sericea and Viburnum are not commonly found in the area where the present study took place (Nelson et al. Reference Nelson, Frost and Nielsen2021), whereas V. myrtilloides is quite common and its growth is more vigorous on seismic lines (Dawe et al. Reference Dawe, Filicetti and Nielsen2017).
Butterflies that rely on similar food resources often develop similar flight behaviour, and butterflies adapted to boreal forest habitats may behave similarly when encountering seismic lines (Scott Reference Scott1975). In addition, the recent wildfires in the study area have resulted in an interior forest that is comparatively more open than the interior forests examined in other studies of seismic line effects on butterfly movement (S. Nielsen, unpublished data). This impact of recent wildfires may mean that the expected attractive effects of seismic lines as movement corridors are lessened due to greater openness in the area, making the seismic line just another opening in the forest, albeit a more consistent and linear one.
Flight period differences
Our results may also have been caused by differences in flight period timing between our most abundant species and those studied previously. Notably, C. lucia, B. freija, and C. niphon emerge and fly as adults in early spring, with their peak flight period occurring in May (Bird et al. Reference Bird, Sperling, Pike, Kondla and Hilchie1995). Previous research on the effect of seismic line corridors on butterfly movement in the Canadian boreal forest has focused on Boloria chariclea, which has its peak flight period in the summer months (Bird et al. Reference Bird, Sperling, Pike, Kondla and Hilchie1995). The relative availability of solar or floral resources on seismic lines, as opposed to in the interior forest, may differ throughout the season.
Implications and future research
Despite the direction of flight preference of butterflies on seismic lines, our study corroborates the conclusions of previous studies that conventional seismic lines attract a greater abundance of butterflies on the lines than in adjacent interior forest habitat (Riva et al. Reference Riva, Acorn and Nielsen2018a). The finding has significant implications for the function of butterfly communities in boreal forest habitat (Haddad and Baum Reference Haddad and Baum1999; Riva et al. Reference Riva, Acorn and Nielsen2018a; Nelson et al. Reference Nelson, Frost and Nielsen2021). The presence of an expansive network of seismic lines potentially could allow butterflies to disperse further and more easily than would otherwise be possible (Haddad Reference Haddad1999), which may result in previously separate communities interacting and lead to increased homogenisation of butterfly communities genetically within the boreal forest network. Genetic homogenisation could contribute to increased susceptibility of butterfly communities to disease (Keyghobadi et al. Reference Keyghobadi, Roland and Strobeck2005), although it also may contribute to a decrease in parasitism and to the genetic homogenisation of parasitic species (Roland and Taylor Reference Roland and Taylor1997). Conversely, the increase in butterflies’ ability to disperse throughout boreal forest habitat may facilitate greater migration in response to climate change. Butterflies are highly responsive to shifts in climate patterns and changes in habitat heterogeneity (Kerr et al. Reference Kerr, Southwood and Cihlar2001; Westwood and Blair Reference Westwood and Blair2010). Very few woodland-specialist butterflies call Alberta’s boreal forests home, so although seismic lines may favour open-habitat butterflies, it is unlikely that a shift to parkland conditions under climate change will be unfavourable to any particular butterfly species as a result of competition (Riva et al. Reference Riva, Acorn and Nielsen2018a).
Future research on this topic should focus on the behaviours of specialist butterfly species on seismic lines that prefer food plants common in forest edges and interiors. Research in this direction would help to confirm the present study’s findings and to determine if the conclusion that butterflies in the boreal forest prefer conventional seismic line habitat applies to boreal forest butterflies as a group. In addition, further research on the effects of seismic lines on butterfly populations at the landscape scale would help to determine the long-term impacts of the increased dispersal and floral resources made available by seismic line presence in Alberta’s boreal forest.
Supplementary material
The supplementary material for this article can be found at https://doi.org/10.4039/tce.2025.10045
Acknowledgements
The authors thank P. Bider, S. Peterson, and B. Virginia for assistance in field data collection, J. Goodine, O. deBourcier, Z. Roote, R. Jackson, T.C. Christie, V. Dubord, and O. Hrehoruk for helping process trap samples, and J. Acorn for help with challenging identifications. Field data collection was supported by Canada’s Oil Sands Innovation Alliance and the National Science and Engineering Research Council (CRDPJ 498955 to author S.E.N.), Polar Knowledge Canada (to author C.J.N.), and UAlberta North (to author C.J.N.). The funding organisations were not involved in the design, data collection, interpretation, writing, or submission of this article.
Competing interests
The authors declare that they have no competing interests.


 Open access