

1.1 This Chapter’s Plan
Data-centric socialities are media-centric socialities. Ostensibly, media are “means of transmitting some matter or content from a source to a site of reception” (Davies Reference Davies and Levinson2005, 181). This is what the air does when carrying sound waves or a letter that contains a lover’s words. But media do not only transmit. As philosopher Sybille Krämer (Reference Krämer2019, 833) insists, media are fundamentally generative: they “always shape and constitute what they represent.” Throughout history, new media have generated new possibilities, enabling people to do new things. Astronomers have worked with diverse media, from tabulating observations in cuneiform writing on clay tablets and various graphical explorations on paper to photographs on glass plates and printed materials that allow researchers anywhere to compare identical records made at different times and places.Footnote 1 So, what do digital media add to, or change about, these practices? What can scientists do with them that they could not do before?
This chapter attempts to answer these questions for digital imaging in astronomy. I begin with a scientist’s assessment of its novelty and then describe how a detector technology and a data standard became dominant. I focus on the work of ground-based optical astronomers, but it turns out that their interactions with radio astronomers and space astronomers (who use observatories on spacecraft) – members of different “instrumental communities” (Mody Reference Mody2011) – have shaped the social organization and sociality of data-rich astronomy. I describe a technological convergence in astronomical practice that affords mobilizing data beyond local contexts, rendering abstract time as an object of management, sharing data as nonrivalrous goods, monitoring and assessing others’ work remotely, and building new forms of collaboration. As identical copies of observing records, digital data do not only “spread the word” about research, but also the “work” itself (cf. Kohler Reference Kohler and Biagioli1999, 252). These uses unfold in a novel medial middle ground. Elementary operations with digital exposures are its foundation.
1.2 “The Big Trick of Optical Astronomy”: Quantitative Imaging with Digital Outputs
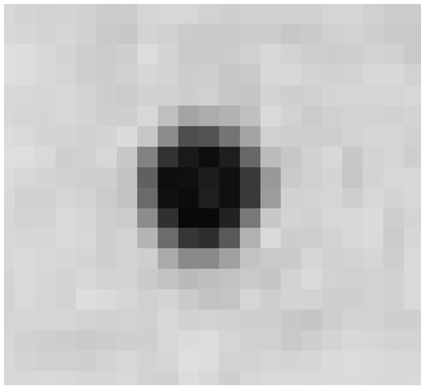
Let us begin with an introductory class in observational astronomy taught for undergraduate students at a North American university. Following a review of various imaging detectors, the Professor turns to charge-coupled devices (CCDs). These sensitive solid-state detectors use the photoelectric effect to produce grid-shaped pixel images which can be read out and then stored, retrieved, and transmitted as digital files. CCDs are found in digital cameras from smartphones to large telescopes.Footnote 2 Once cooled with liquid nitrogen to reduce quantum noise, CCDs can be exposed for several hours. Figure 1.1 illustrates how digital images are both visual and numerical. It shows a small fraction of a calibrated astronomical CCD image as a formatted, bounded, two-dimensional surface of nonoverlapping square picture elements (pixels). A progression of shades of gray represents the radiation flux registered in individual pixels. The grayscale from white to black encodes the number of detected photons and corresponds to increasing exposure, with black indicating the CCD’s maximum exposure and saturation.
Detail of the negative of a calibrated photographic exposure of a source on the sky, a grid of 21 × 19 pixels
Note: The online version shows the colors of the original figure.

The Professor cares about making images of sources on the sky and measuring their brightness, size, and shape. But artifacts in data – imprints of the observing situation, including noise –, are this work’s ever-present burden. By enabling “quantitative imaging with digital outputs,”Footnote 3 CCDs promise a remedy. As the Professor explains, CCDs in use are not only “very efficient” (sensitive) and “very linear” (recording incoming light in proportion to the exposure time). What is more, their output is “born-digital” (McCray Reference McCray2014), that is, numerical and, as such, symbolic. It is directly amenable to arithmetic calculations, including the pixel-by-pixel addition, subtraction, and division of exposures. In concert, these properties offer unprecedented possibilities to remove artifacts from data. The Professor explains:Footnote 4
Now that we have gone over some of the basics … ehm … I think it’s time to get into … to some of the tricks. The big trick of optical astronomy is that everything is a differential observation. This is not true of absolutely all observational astronomy. And I am gonna talk a little bit about what I mean by this. In older astronomy this was almost never the case. Old astronomy was photographic plates … where somebody took a picture of the sky … and they just collected photons for 20 or 30 minutes … or two hours … or they did spectra for hours and hours (…) And so why is ((differential observation)) an improvement? The thing is … there are all these effects that … we can remove by differential imaging. So … for example … the instrument response shouldn’t care where you look in the sky … it shouldn’t matter … the instrument is the instrument … we can look here ((the Professor points with his hand toward the ceiling in various directions)) … and here … and here … The instrument response should be the same. So …. you can look on your source … and then you can look off your source … and what you see off the source should have no source in it … and so if you look at the difference between on source observation versus an off source … the difference is the source. And this was not the case before we had electronic detectors … There were a few things in radio astronomy where we were able to do this … but this on source versus off source is one of the big … it is one of the unspoken things … it’s not even in the textbooks … they talk about techniques of on source and off source but they don’t mention that this is a fundamental shift in the way we do astronomy … it is one of the reasons why modern astronomy is so much more powerful … it is not just that the detectors are more sensitive … it’s that you can … that they are digital and that the differences between on source and off source are vital … So that is the big trick in optical astronomy … the big secret.
As the Professor explains, CCDs allow astronomers to count photons of cosmic light and subtract artifacts, including the “instrument response,” from it. Differential imaging employs the sensitivity, linearity, and “born-digitality” of CCD’s output. But why is this move from analog photography – an element of what the Professor calls “old astronomy” – to digital imaging so spectacular and productive? In analog photography an emulsion of silver halogenide grains is exposed by incoming light and fixed chemically. This process is much less sensitive than photography with CCDs: of 100 incoming photons a CCD registers up to 80, whereas photographic film records only 1 or 2 (McLean Reference McLean2008). Thus, film loses most incoming photons. Photographic film is also highly nonlinear: it does not record incident light in proportion to its intensity. An emulsion’s characteristic curve plots the density of dark grains as a function of light exposure. It is approximately linear for a certain part only, but nonlinear for shorter as well as longer exposures, where film saturates.Footnote 5
Analog photography is not “born-digital.” To analyze analog photographs with a computer, one must digitize them first, that is, scan developed film with a densitometer to measure its transmission and transform this information into numerical values. Doing so requires sampling and quantization.Footnote 6 It loses information. Measuring the characteristic curve for each plate and applying the linearization correction to the measured transmissions of scanned pixels involves decisions that are difficult to reproduce. Nowhere is there a simple subtraction of “off-source” from “on-source” exposures. Differential imaging with CCDs bypasses these challenges. No wonder that it amazes the Professor. But the success of differential imaging depends on the stability of detector (“the instrument response should be the same”) and sky over the period of observation. Subtracting “off-source” from “on-source” would not make sense otherwise.
Differential observation may be called an affordance of CCDs in use. Psychologist J. J. Gibson (Reference Gibson, Shaw and Bransford1977, 67–68) argues that “the affordance of anything is a specific combination of the properties of its substance and its surface” for use in any perceiving animal’s project. Widely adopted, the notion of affordance seeks to capture potential, often unplanned and unanticipated uses of objects in specific courses of practical action.Footnote 7 Differential observation of astronomical sources was not a design feature of CCDs. Astronomers at work recognized its do-ability with this new detector. I will review more affordances of digital imaging in astronomy later in this chapter, including those that matter to its social organization of observing and data use. But let us briefly consider its history first to understand the options and decisions that led to its widespread use.
1.3 How to Count Light? Defining an “Ideal Detector” and Trying to Build It
In retrospect, work done in the 1970s and 1980s laid a foundation for data-rich astronomy, thanks largely to the invention of CCDs and the rising computing power available to scientists. Many astronomers realized quickly that CCDs offered solutions to a set of problems that researchers had formulated since the 1950s, and to which a variety of detector designs were attempts at a solution. In putting it this way I follow George Kubler, who writes in The Shape of Time that “[e]very important work of art can be regarded both as a historical event and as a hard-won solution to some problem” (Kubler Reference Kubler1962, 30). This art historian’s way of pondering the historical and social meaning of artifacts is worth adopting for making sense of technical inventions and their social uses.Footnote 8
So, which problems did CCDs solve for astronomers? We know parts of the answer from Section 1.2. But let us develop a more comprehensive understanding by contrasting the two detector technologies that dominated optical astronomy in the 1950s, well before CCDs were invented. One was analog photography. It was praised for its capability to record wide-field images, for its high resolution, as well as for its easy processing and archiving (Hearnshaw Reference Hearnshaw1996, 327). But as we have seen, these affordances came along with serious downsides: low sensitivity, nonlinearity, as well as the need to scan developed film to generate digital output. Photomultipliers were the other technology. Used for photometric measurements of starlight since the 1910s, these devices used the photoelectric effect to let incoming photons trigger electron cascades that were registered with voltmeters. Their advantages were their relatively high sensitivity (ten to twenty times that of photographic plates), linear response, and ease of calibration. Their output could be digital or analog. Photomultipliers are essentially 1-pixel detectors, suited for measuring the radiation flux of point sources such as bright stars.
Attempts to design the best possible detector in optical astronomy were efforts to combine the advantages of analog photography with those of photomultipliers while avoiding the downsides of either. As researchers and technicians at various observatories sought to come up with new designs, they pondered what an ideal detector would be like.Footnote 9 This development was guided by metrics of performance. Light sensitivity became the most discussed metric. Quantum physics posits the countability of photons of light, and thus the detective quantum efficiency (DQE) – the efficiency of an actual system compared to an idealized, perfect photon-counting system – seemed to be a useful measure of sensitivity.Footnote 10
Because of their high quantum efficiency and linearity, photomultipliers were the starting point for developing electronic detectors that could produce images. An early design that the French astronomer Albert Lallemand proposed already in the 1930s was called electronography. It used photocathodes to make images by recording the output electrons on photographic film. But electronographic cameras were difficult to use, and extracting information from the recorded films was challenging.Footnote 11 Thus, high sensitivity alone would not define a desirable imaging detector.
Image intensifiers also used photocathode tubes but focused the electron beam onto a photo-emitting screen that was scanned by a television camera. As such, their output was electronic and could be digitized easily. The most successful image intensifiers were both sensitive and linear but worked only for observing faint light sources (Boksenberg Reference Boksenberg, Duchesne and Lelievre1976). Bright sources were quickly saturated. Consequently, a wide dynamic range – a large span between the brightest and the faintest recordable signal – was desirable as well, along with the demand for detectors to produce stable images whose neighboring parts would not influence each other’s response, as some image intensifiers tended to do.
Unlike electronographic cameras, image intensifiers became popular in the late 1960s and 1970s. Several designs were developed, but none was built in large numbers. Alexander Boksenberg and his team at the University College London built four copies of the Image Photon Counting System (IPCS) that were used as traveling instruments, for example, at the 5-meter telescope on Mount Palomar in California and the European Southern Observatory’s 3.6-meter telescope at La Silla in Chile (McCray Reference McCray2014). Its main competitor was Joseph Wampler and Lloyd Robinson’s Image Dissection Scanner (IDS) at Lick Observatory in California, of which five copies were built. This was the only instrument that visiting astronomers could use. As with the IPCS, the IDS’s internal noise could be controlled when used only as one-dimensional detectors to record spectra, but not images (Robinson and Wampler Reference Robinson and Wampler1972).
In 1977, after more than two decades of experimentation with electronic detectors, Peter Boyce, the program director for astronomical instrumentation and development at the National Science Foundation (USA), observed that there was “an almost bewildering variety of detectors being used for ground-based astronomical observations” (Reference Boyce1977, 148). A handful of researchers developed these designs, and their knowledge and skill could not be transferred easily. Boyce noted that “enthusiastic instrument developers” tended to overlook the requirement of “simplicity of use and reliability over extended periods at the telescope” (Reference Boyce1977, 148). He concluded:
The ultimate test of a new detector is not the pictorial quality of its first images but the new knowledge ultimately derived from its use by a wide range of working astronomers. In one or two cases where sufficient resources have been available, it has been possible to use a very complicated detector in a relatively routine manner. But the most useful scientific tool continues to be that one which can be used by a large number of scientists without the need for a long or complicated introduction or training period.
Boyce echoed a sentiment that many astronomers shared when he noticed that years of developing alternatives to analog photography only demonstrated the latter’s enduring qualities in terms of its high resolution, wide field of view, and storage capacity (cf. also Ford Reference Ford1979). With the emergence of digitization techniques and digital detectors, the storage capacity of photographic plates was measured in terms of pixel number. Digitized in standard ways, a 30 cm × 30 cm photographic plate (a typical format) yielded one billion pixels. This was several orders of magnitude above the largest digital detectors available in the 1990s (Bland-Hawthorn et al. Reference Bland-Hawthorn, Shopbell and Malin1993). This, of course, did not remedy analog photography’s low sensitivity, nonlinearity, and not-born-digitality.
When Boyce formulated his critical assessment in 1977, a consensus developed that CCDs – invented in 1969, but still at an early stage of development – would soon become dominant. A main driver for their use in astronomy was the plan of NASA, the US National Aeronautics and Space Administration, to build a large Space Telescope. As this Space Telescope was to be operated remotely in a low Earth orbit, using analog photography seemed impractical. Not only would the radiation deflected by the Earth’s magnetic field saturate the film. It would also be difficult to develop and scan exposed film and transmit these data to Earth. Image intensifiers seemed more promising, but their capriciousness remained worrisome. In the 1970s, CCDs were small and sensitive only at short visible wavelengths. But despite their early stage of development, they seemed more promising than any other detector design. The hundred-fold sensitivity of CCDs over classical photography transforms the light collecting power of a 2-meter telescope into that of an imaginary 20-meter telescope. Their “born-digital” output and linear response promised that data could be worked with easily. And what is more, CCD detectors were stable, light, and rugged enough to be flown on spacecraft (Smith and Tatarewicz Reference Smith and Tatarewicz1985).
Robert Smith and Joseph Tatarewicz (Reference Smith and Tatarewicz1985, Reference Smith and Tatarewicz1994) argue that what I call the affordances of CCDs defined a “pull” for their development. But Smith and Tatarewicz note that there was also a “push”: the effort by Bell and other companies to develop CCDs for a broader market, including for military uses. NASA and the US government supported this effort. The development and production of CCDs as commodities resonates with Boyce’s observation that the success of a detector depends not alone on its optical performance, but also on its widespread availability and ease of use. Mass production entails standardization and an increased scale of operations (Hart Reference Hart2001). Produced as commodities, CCDs promised to be suited for the use by a global community of researchers. Initially, some astronomers worried that, in a field of larger economic forces that promoted CCDs as a new commodity, their specialist requirements would be ignored (Illingworth and Butcher Reference Illingworth, Butcher, Crane and Kjär1980). But this did not hinder astronomers from adopting this technology. Carnegie Institution astronomer Vera Rubin put it succinctly: “I took my first CCD spectra in [19]84, and virtually never went back” (Thompson Reference Thompson2019, 181).
1.4 Data Format: FITS, the Flexible Image Transport System
One hallmark definition of “the digital” is that it enables the loss-less encoding and decoding of information (cf. Stetter Reference Stetter1997, 67). But this alone is insufficient to make digital records an effective communication medium. Data makers and users need to define shared standard data formats. First formulated in 1979, the FITS (Flexible Image Transport System) standard became a milestone for the interoperability of astronomical data. By the 2000s, the success of FITS had spread widely. It inspired data standards beyond astronomy, being used, for example, by the Vatican Library as the format to store and process digitized scans of its manuscript and document collection.Footnote 12 How the FITS standard was defined and developed is instructive for an understanding of data-centric socialities. Let us take the viewpoint of optical ground-based astronomers to make sense of how the FITS standard enabled communications between previously autonomous “instrumental communities.”Footnote 13
Throughout the 1970s, formatting data, that is, encoding the recorded information of gridded pixel images as well as the metadata that named and described them, was an individual scientist’s decision. Constrained by their computer’s architecture, they could not pick any format they wanted. Formats differed in how numbers were represented in the binary system, resulting in problems of interoperability. For example, a magnetic tape written on a Digital VAX computer, could not be read easily on an IBM 360, then the other popular mainframe computer (MacKenzie Reference MacKenzie1993).
Otto, one of the Heidelberg team’s senior astronomers, remembers his troubles with deciphering other researchers’ data tapes:
Transcript 1.2
1
Otto: Back then everyone wrote their own format and when you got a tape from someone at times you had to spend a week or so until you could read it.
2
Götz: Which formats were these?
3
Otto: Well … you first had to find out! ((Our systems manager)) once wrote some code … and gave it to me … that made a dump of a tape so you could see how long a record was. What was there … after all? Some folks gave us tapes that were poorly documented. A file that is well organized tells you right away … this the record length … byte number so-and-so means this … byte number so-and-so means that … and so on. And then you had to sit down and write code to read the tape record by record … and fiddle with these records so that you could make anything with it. Whether it was an image or a table or whatever. Often it was quite a hassle to make it usable.
4
Götz: With tapes from observatories?
5
Otto: Yes … or from colleagues who had worked with the data and told us … “Good … here … take my data!” And then we had to fiddle with the tapes.
An informal discussion of Ronald Harten and Donald Wells in 1976 eventually led to a shared astronomical data standard. Harten, a radio astronomer, worked at the Westerbork Synthesis Radio Telescope (WSRT) in the Netherlands, while Wells, an optical astronomer, was at the National Optical Astronomy Observatory at Kitt Peak (Arizona, USA). In the mid-1970s new developments in telescope design made radio astronomers and optical astronomers eager to define a format for sharing digital data. Most older radio telescopes had been single dish antennas capable of making low-resolution maps of the sky only, but now a new generation of radio interferometers became available. With this design, the signals of antennas kilometers apart could be correlated to reveal details comparable with those of optical images. Opened in 1968, the WSRT was the first large radio interferometer, followed by the Very Large Array (VLA) in New Mexico (USA), which became operational in 1976.Footnote 14 Now capable of seeing “the same” sky at different wavelengths, radio and optical astronomers were eager to compare and combine their data. No single organization could produce both radio and optical data, and thus the members of distinct organizations and instrumental communities had to cooperate. The FITS standard was designed to enable this cooperation. Harten and Wells were soon joined by Eric Greisen of the US National Radio Astronomy Observatory that operates the VLA.
FITS was meant to “facilitate the unambiguous transmission of n-dimensional, regularly spaced data arrays” (Wells and Greisen Reference Wells, Greisen, Sedmak, Capaccioli and Allen1979, 446), that is, images, tables, and data cubes. It is not a compression format like JPEG or MP3, but a standard to store and transport scientific data at arbitrarily chosen precision along with textual descriptions and numerical information. FITS files are composed of one or more “header-data units.”Footnote 15 The header is encoded in the ASCII format and thus – unlike files in a binary format – can be read by machines and humans alike. It begins with an identifier of the file type, lists keywords whose values describe the telescope and instrument details, observing date and coordinates, the specific binary format adopted, as well as the dimension of the header-data units’ data portion. Users can define their own keywords and include text of arbitrary length to maximize a file’s “self-documentation” (Wells and Greisen Reference Wells, Greisen, Sedmak, Capaccioli and Allen1979, 446). All records have a length of 23.040 bits (2880 8-bit bytes). The lengths of the header and of each subsequent data unit can be multiples of this record size. Data units are typically stored in a binary format to speed up their processing. Users can specify the binary format in which floating point numbers are represented at a precision of their choice (MacKenzie Reference MacKenzie1993).
Apart from developing this technical description, Wells, Greisen, and Harten suggested principles for how astronomers should use and manage the FITS standard. Greisen (Reference Greisen and Heck2003, 78) argues that, in hindsight, “the decision that no addition to the format should make existing data sets obsolete” was most important. This demand for backward compatibility became known as the Once FITS, always FITS rule. It is what makes the format valuable for archives like the Vatican Library. Despite the commitment to the long-term usability of existing FITS files, frequent changes to the standard were made over years and decades (Scroggins and Boscoe Reference Scroggins and Boscoe2020). These were mandated through communal governance, in which regional FITS user groups collected and debated proposed changes to the standard, to be then endorsed by the International Astronomical Union’s FITS Working Group. Over time, email discussions replaced the regional working groups (Scroggins and Boscoe Reference Scroggins and Boscoe2020, 43). The FITS Working Group includes representatives of main observatories and space agencies. In 1990, NASA endorsed the FITS format for its astronomical data (Hanisch et al. Reference Hanisch, Farris, Greisen, Pence, Schlesinger, Teuben, Thompson and Warnock2001).Footnote 16
1.5 Affordances for the Social Organization of Data Production and Use
Distinguishing an “old astronomy” from a “new” one, as the Professor did, is not about a “material analog” versus an “immaterial digital.” In both “made-digital” analog and “born-digital” photography, data are inherently material. Information is bound to substrates – glass plates, punched cards, magnetic tapes, DVDs, or hard disks.Footnote 17 But digital information is nonrivalrous: “We can share it without dividing it and consume it without diminishing it” (Suber Reference Suber2012, 46). The substrates and formatting of data afford diverse uses.
First, there are the benefits of commensuration, additivity, and experimentation that digital records enable (see also Chapter 4).
Second, different substrates afford distinct practices of data ownership and access. For most North American, European, and Australian researchers in the 1960s to 1990s, doing “old astronomy” meant writing proposals and applying for observing time at national or international observatories (McCray Reference McCray2000). Time allocation committees adjudicated these proposals. If granted some nights of observing time, researchers would travel to an observatory as visiting astronomers. The observatory offered capabilities and services to record data.Footnote 18 Working in the dome at night, using the equipment allocated to them with the help (and often guidance) of night assistants, researchers recorded images and spectra on glass plates, photographic film, or, later, on magnetic tapes. Observing techniques could be idiosyncratic, adjusted to the science case at hand, but were also shaped by visiting astronomers’ limited skills and understanding of the observatory’s technology. Visitors took photographic plates to their home institutions to analyze and digitize them, but did not typically return them to the observatory. Even when some observatories claimed plates as their property, the plates’ return was not usually enforced and neither were breaches sanctioned.Footnote 19 These “makers” seemed to adopt a Lockean notion of private property, which ascribes legitimate ownership to human labor (Locke 1988 [Reference Locke and Laslett1690]), understanding the plates to be the products of visiting astronomers’ labor. Photographic plates and magnetic tapes were at times exchanged and passed on to students – but also stored away without leaving much of a trace, being forgotten or even discarded. If they traveled at all, then it was usually within personal networks.
Third, the additivity and linearity of CCD exposures afford new observing modes. Only around 2000, when CCDs were already dominant, did service-mode observing become an alternative to the visiting mode (see Chapter 2). In service mode, technicians record data for absent researchers. This was meant to improve the data quality and the efficiency of telescope use by scheduling observations for approved projects according to weather conditions at the observatory. It largely removed researchers from the observatory and allowed projects to be split into several components that could be observed over some time. This was possible thanks to the additivity of digital exposures, which enabled their combination; the linearity of CCDs, which allowed calculating necessary exposure times; and the sky’s stability at the timescales of this work.
Fourth, data’s digitality affords holding its producers accountable remotely. Moving from visitor-mode to service-mode observing shifted the responsibility for data quality from visiting astronomers to observatory technicians (Giacconi Reference Giacconi2008, 233), an issue that I examine further in Chapter 2. Note how the born-digitality of data matters here. Faults in born-digital, numerical data can presumably be blamed on the performance of observatory technicians. As data’s digitality offers novel possibilities to hold others to account, this blame can travel far. By contrast, in “old astronomy” photographic plates were often chemically developed and fixated during the observing night itself and approved as “good enough” by visiting astronomers at the place of production. But when scientists work with open data, they, too, can be held to account more easily (see Section 1.6).
Fifth, service-mode observations following standard procedures yield data that can be archived and reused more easily. Into the 1990s, many ground-based optical observatories deemed the costs of setting up archives excessive. Dennis Crabtree and his colleagues (Reference Crabtree, Durand, Gaudet, Hill, Morris, Jacoby and Barnes1996, 207) argue that, in contrast to the expensive operation of space telescopes, at ground-based observatories “the cost of the technology to archive data safely, develop the software for searching and accessing the archives, etc. was too high given the relative cost of redoing an observation.” This argument about costs implies these astronomers’ sense that the sky will be sufficiently “the same” at the time of reobservation. Only when telescope construction and operating costs rose swiftly in the 1990s, did the “cost-per-byte of the data” (Benacchio Reference Benacchio1997, 391) mandate systematic archiving. But initially the value of archives was questionable because many visitors recorded and documented their data idiosyncratically. Piero Benvenuti (Reference Benvenuti, Albrecht and Pasian1994, 3) lamented that an archive of such data would be a “graveyard of zombies” of little benefit for future uses. To make a difference one had to follow standardized observing and archiving protocols – an import from the operation of radio and space observatories.Footnote 20
Sixth, and harking back to my second point, digital data that are thus accessible and usable afford new modes of research collaboration. Data made using different technologies (sensitive to radio, x-ray, optical, and ultraviolet radiation), stored in a single format, are commensurable and combinable. They allow researchers with expertise in different technologies and wavelength ranges to collaborate more effectively than before. Calibrations and analyses of one constituent dataset can retroact on others. The shared access to data archives and repositories facilitates the work of globally distributed research teams. The public availability of data at the end of proprietary periods enables specific temporalities of teamwork, as I will examine later in this book (Chapters 6 to 8).
Seventh, these capacities are expanded with novel architectures for large databases, which “move the analysis to the data” (Szalay Reference Szalay2018, 202). Pioneered by the Sloan Digital Sky Survey (see Chapter 6), these are now widely used beyond astronomy.
These affordances of digital data “conspire” with astronomy’s phenomenal setting, where all scientists observe the “same” stable sky. These affordances structure and define the disciplinary character of astronomical research. Not only are its “born-digital” data amenable to symbol processing. Given that almost all information is due to the sense of vision (versus touch or smell) – or rather, the detection and processing of quantized (“digital”) radiation –, multimodality appears to offer astronomers no insights into their research objects beyond what is visual and measurable. The numerical, computable nature of astronomical data makes such data available to probabilistic inference and suited for machine-learning applications.Footnote 21
1.6 A Digital Middle Ground
In the 1970s and 1980s, when they were early career researchers, the Professor and Otto used a variety of media and apparatuses, including printed catalogs (tables of the measured properties of celestial objects) and atlases, and photographic plates they recorded themselves at the telescope, as well as optical and mechanical machines for analyzing photographic plates exposed at various observatories. They used blink comparators for spotting differences between photographs, x-y measuring machines for determining celestial coordinates, and digitized plates with microdensitometers. Since the 1990s, this machinery of optical, mechanical, and electronic instrumentation has been largely collapsed into computers. Technologies for data production and analysis have converged. Technological convergence is, of course, not exclusive to astronomy.Footnote 22 But compared to other sciences it is particularly pronounced there because astronomers work almost exclusively with recordings of light, whose nature as discrete, countable quanta is commensurate with that of digital detectors and computers, and with being processed as symbols.
We can regard technological convergence in astronomy as a key element of a novel medial middle ground and examine its implications for data-rich science and data-centric socialities. The notion of a medial middle ground is due to historian of science Hans-Jörg Rheinberger (Reference Rheinberger2011), for whom it pertains to mediations characteristic of laboratories, where it is “the apparatus in all its complexity and intricacy that comes to stand between the knowing subjects and the objects of knowledge” (Reference Rheinberger2011, 340; emphasis in original). For him, “the medial world of knowledge-making” (340) includes diverse recording media which enlarge and reduce, speed things up, and slow them down for examination. Rheinberger (Reference Rheinberger2011; Reference Rheinberger2023) suggests that attending closely to how scientists use laboratory equipment is the best way to identify the medial middle grounds of science.
Like Rheinberger I want to understand the workings of specific media and apparatuses, but I extend the notion of middle ground, which I use loosely, beyond individual laboratories to include what they share and what connects them: data, computers, code, networks, and standards (like the FITS format). This makes it a sort of infrastructure, but I also include social practices and resources like diagrams to represent data.Footnote 23 The affordances listed in Section 1.5 mark its scope. For me as an anthropologist, Rheinberger’s “knowing subjects” are unavoidably a differentiated bunch: researchers at various places, at various stages in their education and career, in diverse institutions and collaborations, situated in a variety of networks and communities. What makes astronomy’s digital middle ground unprecedented is not only the technological convergence and the diversity of its human participants, but also the practical aspects of its “flatness,” to borrow journalist Thomas Friedman’s (Reference Friedman2005) term for describing how the internet changed networked global trade. For astronomer Matt Mountain (Reference Mountain2014), it is the public availability of astronomical data that has “flattened the astronomy world,” contributing to a sense of placelessness that some contemporary astronomers notice in their work. As one researcher told me, “to do research in astronomy all you need is a laptop computer and a connection to the Internet.”
Describing the work of early twentieth-century drosophila geneticists, who developed extensive networks for sharing domesticated fruit flies for experimentation, Robert Kohler noticed that “[f]ormal publications spread the word of mapping and the standard fly, but exchange of stocks and know-how spread the work” (Kohler Reference Kohler and Biagioli1999, 252; emphasis in original). Sharing and exchanging digital data, formatted in FITS, is one means for astronomers’ work to meet closer to the “shop floor,” for making data and actions available for inspection, and for holding not only observatory technicians, but also researchers, to account.Footnote 24 In moving from publishing results and arguments to also circulating digital data and software, a medial middle ground enables scientists to build and contest trust, gain interdependence, and grow coordination, learning, and skills in novel and often unnoticed ways. Marshall McLuhan (Reference McLuhan1964) famously argued that media are “extensions of man,” but it seems that, in astronomy, digital data have become social extensions that connect multiple instrumental and epistemic communities, transforming the workings of each. When astronomers contribute to data archives, they care for the needs of future researchers while also creating possibilities that data users will blame them. Thus, a medial middle ground is not merely a technological matter. It is also a space for ethical evaluations, as I will examine in Chapter 2.

 Open access