

INTRODUCTION
The dynamics of directly-transmitted, acute infections are well-described by the Susceptible-Infected-Recovered (SIR) model [Reference Dietz1]. Among acute childhood infections, the epidemic dynamics of measles are perhaps the best understood since it has received extensive study, most notably in England and Wales prior to the start of vaccination. This body of research has shown that the basic epidemic clockwork of measles is driven by the aggregation of children during school terms [Reference Bjørnstad, Finkenstädt and Grenfell2]. Measles dynamics are also tuned by birth rates as modulated by vaccination rates [Reference Earn3]. If both of these factors are encompassed into simple mechanistic models that reflect the SIR, long-term prediction of incidence is possible [Reference Finkenstädt and Grenfell4]. Less is known about the dynamics of other childhood diseases, particularly outside Europe and the United States. Here, we leverage a unique existing dataset to examine the epidemiology and incidence dynamics of six childhood infections – measles, mumps, rubella, varicella, scarlet fever and pertussis – across 32 states in Mexico from 1985 to 2007. The availability of data for each state provides 32 similar populations for comparing varying social and demographic contexts across the six pathogens. We test the extent to which the dynamics of these common childhood infections align with predictions from theory and past findings.
Measles, mumps, rubella, and varicella are viral infections, while scarlet fever and pertussis have a bacterial aetiology. All six are directly transmitted airborne diseases that have highest incidence in children. The pathogens, however, have several important life-history differences. There is considerable variation in the duration of generation times (latent period plus infectious period), transmission rates, the degrees of immunity conferred, and the existence of asymptomatic carriers across the six infections; the main differences and similarities are summarized in Table 1. Our focus is on examining the role of three key epidemiological characteristics of these six common childhood infections in the context of existing theory
Comparison of the six infections [Reference Anderson and May5]

Age profile of infection
The mean age of infection and the age-specific force of infection (FOI) are core epidemiological parameters. The variation of FOI with age has been documented for several childhood diseases [Reference Anderson and May5] and has implications for control efforts [Reference Schenzle6]. Elimination following vaccination is easier if the infection is intrinsically less transmissible in older age groups than it would be if transmission were constant across all ages [Reference Anderson and May5].
In the basic SIR model, at equilibrium, the average age of infection is inversely proportional to the FOI (and the underlying rate of disease transmission) [Reference Anderson and May5]. Thus, we would expect denser states, and those with higher birth rates, to have a lower average age of infection due to higher rates of disease transmission. The mean age of infection could also be associated with socioeconomic factors. For instance, if school attendance rates vary across states, we would expect to see a corresponding variation in the mean age of infection; if fewer children are concentrated in schools, then the transmission rates may be lower, resulting in higher mean ages of infection. Accordingly, we present analysis of how the estimates of the mean age of infection vary with space, demography and socioeconomic factors.
Spatio-temporal patterns in incidence
Given life-history differences for the six pathogens, we may expect to see differences in the infection dynamics. Previous work has suggested that diseases with large values of the basic reproduction number, R 0, tend to exhibit large resonant power (cycles with annual or multiennial periods), while diseases with small amplitude of seasonality or small R 0 tend to exhibit significant non-resonant power (which can occur at any frequency) [Reference Bauch and Earn7]. For instance, measles (large R 0) epidemics are typically strongly annual or biennial, whereas pertussis (small amplitude of seasonality) often exhibits significant non-resonant power. Pertussis also tends to exhibit longer period cycles of 3–4 years due to a longer generation time [Reference Rohani, Keeling and Grenfell8]. Multi-annual cycles with varying periodicity have also been observed for mumps [Reference Anderson, Grenfell and May9], rubella [Reference Anderson and May5], and scarlet fever [Reference Duncan, Duncan and Scott10]; annual cycles have been observed for varicella incidence [Reference Brisson11]. The dynamics of these pathogens have rarely been compared in the same setting over the same time period, which is possible with this unique dataset.
We also examine the epidemic synchrony between states and the timing of epidemics across states. Previous work has suggested that the strong synchronizing effect of seasonally forced transmission should lead to epidemics that are completely synchronized across large coupled areas [Reference Bolker and Grenfell12]. However, travelling epidemic ‘waves’ have been observed for measles in England and Wales, arising as a result of repeated invasions from endemic core areas to the periphery [Reference Grenfell, Bjørnstad and Kappey13]. This is thought to be a result of the coupling of large and small population centres. Travelling waves have also been observed for pertussis in the United States in the 1950s, although no similar spatial pattern was detected during the more recent re-emergence of the pathogen [Reference Choisy and Rohani14]. While our scale of observation (state-level) is too large to detect core-periphery dynamics, we can nonetheless examine the synchrony across states for each disease. Comparing across diseases allows us to comment on the extent to which the strength of seasonal forcing is correlated with synchrony, as predicted by previous theory [Reference Bolker and Grenfell12].
Seasonality in transmission
Many childhood infectious diseases exhibit a marked seasonal pattern in incidence. In the SIR model, for the oscillatory behaviour to persist over a long period, as is observed in incidence data for many pathogens, seasonal ‘forcing’, or variation, in host births [Reference Pitzer15] and/or in transmission is necessary. Seasonal fluctuations in transmission for directly transmitted pathogens can occur for several reasons. These include changes in host behaviour [Reference London and Yorke16], annual variation in environmental conditions [Reference Shaman17, Reference Pitzer18], and variations in host susceptibility [Reference Sultan19]. Environmental conditions, such as temperature and humidity, may affect pathogen survival outside the host and the dispersal of infectious particles [Reference Lowen20]. However, the link between environment factors and disease dynamics has not been shown conclusively for any of the pathogens considered here.
For childhood infections, there is evidence to suggest that changes in host behaviour, rather than environmental conditions, may be the key driver of seasonality in transmission [Reference Hope Simpson21, Reference Ferrari22]. Seminal work on measles in England and Wales, demonstrated that the aggregation of children during school term time was a strong driver of the observed seasonality in incidence [Reference Bjørnstad, Finkenstädt and Grenfell2, Reference Schenzle6, Reference London and Yorke16]. For measles in Niger, the strength of the seasonal forcing of transmission was shown to be uncorrelated with rainfall patterns but correlated with population size [Reference Ferrari22]. This is consistent with the hypothesis of changes in host behaviour (in this case, due to agricultural cycles) driving seasonality in transmission. The evidence for other pathogens, however, is less conclusive. A reduction in the transmission parameter during the summer months has been estimated for other childhood infectious diseases including mumps, varicella, and pertussis [Reference London and Yorke16, Reference Fine and Clarkson23]. Metcalf et al. [Reference Metcalf24] found evidence for school term-time forcing for viral infections (measles, mumps, varicella), but not for bacterial infections (diphtheria, scarlet fever, pertussis) in Copenhagen before the start of vaccination.
To examine seasonality in transmission, we fit a mechanistic model to the incidence data to estimate the unobserved transmission rates. Comparing across different pathogens, with varying transmission rates and mean ages of infection, over the same time period, allows us to better understand the drivers of seasonality for childhood infections. If term-time forcing were driving the seasonality in transmission, then we would expect to see consistently reduced transmission during the long summer holidays.
In addition to quantifying these three key epidemiological characteristics for each infection, we examine whether they are related to the states’ demographic and socioeconomic conditions. Socioeconomic factors may affect disease dynamics for a variety of reasons. For instance, they may affect host susceptibility (children in poorer states are more likely to suffer from malnutrition) or host aggregation patterns (states differ in schooling rates, spatial aggregation patterns, and agricultural practices). Only a few studies have closely examined these hypotheses. Metcalf et al. [Reference Metcalf25] found no association between a states’ socioeconomic characteristics and rubella dynamics in Mexico. On the other hand, scarlet fever epidemics in England and Wales in the nineteenth century were strongly correlated with wheat prices, possibly as a result of malnutrition [Reference Duncan, Duncan and Scott10]. Here, we examine the associations between socioeconomic factors and disease dynamics as a first step towards better understanding the role of these drivers in shaping the observed dynamics.
We first estimate the mean age of infection and the age-specific FOI from the age-structured incidence data. Next, we examine spatio-temporal patterns in the incidence data by examining the periodicity of the epidemic cycles, the epidemic synchrony between states, and the timing of epidemics across states. Last, we fit a mechanistic model to the incidence data for each disease to estimate the unobserved transmission rates, and examine the feasibility of making predictions using this model. We discuss how our results compare with predictions from previous theory and findings. Our analysis reveals interesting epidemiological differences between the six pathogens. With the exception of pertussis, we detect signatures of term-time forcing for all the pathogens.
METHODS
Data
Incidence data for the six infections was obtained from the Yearly Morbidity Report (2008) of the Directión General de Empidemiología, Mexico [26]. The dataset contains monthly counts for the number of infected individuals between 1985 and 2007 for each of the 32 states of Mexico for each infection (Supplementary Figs S1–S6). Figure 1 shows the incidence time-series for all states combined. For measles, data is missing for 1989; for scarlet fever, data is missing for 1985. We also have state-level yearly incidence data between 1990 and 2007 broken down by age groups of 5–10 years (<1, 1–4, 5–14, 15–24, 25–44, 44–64, ⩾65 years) for all the infections, except for measles for which no age-structured data is available. Widespread vaccination for measles and pertussis began around 1991, and reached relatively high levels of coverage [Reference Katz27, Reference McCormick and Czachor28]. The MMR vaccine was introduced in 1998 and supplanted the monovalent measles vaccine [Reference Katz27]. Routine vaccination for varicella is not recommended in Mexico, and there is no vaccine for scarlet fever.
Reported incidence for all states in Mexico from 1985 to 2007 for (a) measles, (b) mumps, (c) rubella, (d) varicella, (e) scarlet fever, and (f) pertussis. Approximate vaccination start date is indicated with the red line for measles, mumps, rubella, and pertussis. The monovalent measles vaccine and the pertussis vaccine were introduced in 1991; the MMR vaccine (which supplanted the monovalent measles vaccine) was introduced in 1998.

We obtained demographic information and socioeconomic indicators for each state from the Instituto Nacional de Estadística y Geografía. In our analysis, we used population size, population density, and crude birth rate (averaged over the time period) as our demographic variables for each state. We used the average of the estimated poverty rates (measured as food poverty and asset poverty) in 1990, 2000 and 2010 as our main socioeconomic indicator.
Age profile of infection
We estimated the age-specific FOI for mumps, rubella, varicella and scarlet fever from the age-structured data (for all states combined) using the ‘catalytic framework’ described in detail in [Reference Grenfell and Anderson29]. There is no age-specific data available for measles, and the age-specific data for pertussis is too sparse for accurate estimation of the mean age of infection. We used a piecewise constant model to estimate the age-dependent FOI, assuming a constant FOI within pre-determined age intervals. We assumed a binomial distribution for the proportion infected at each age, and numerically maximized the likelihood to estimate age-dependent values of FOI that best fit the age-structured prevalence data. Using the estimated age-specific FOI, we can also estimate the mean age of infection for each disease for all states combined.
We also used the age-specific incidence data to estimate the mean age of infection for mumps, rubella, varicella and scarlet fever for each state separately. While the approach described above works well for all states combined, the maximum-likelihood estimates are difficult to obtain when the data is sparse. To estimate the state specific mean ages of infection, we estimated the cumulative distribution function by fitting a cubic smoothing spline to the cumulative proportion of cases at each age (calculated by summing the data over age and dividing by the total sum). We estimated the derivative of the fitted curve to obtain an estimate of the probability density by age (scaled to sum to one). The mean age of infection can then be calculated as the numerical mean of the probability density curve.
We used ordinary least squares to estimate associations between the mean age of infection and the district's population size, population density, crude birth rate, and poverty rates. We examined the associations of mean age of infection with each of these factors separately, but also included them as multiple predictors in the same regression model. We also examined any spatial gradient in the estimated mean age of infection.
The estimates of the average age of infection also allows us to calculate a rough estimate of the basic reproduction number, R 0, for each disease in every district. Assuming a constant FOI and Type I mortality (constant survivorship over age until life expectancy is reached), R 0 = μ −1 /A, where μ is the per capita birth rate and A is the mean age of infection [Reference Anderson and May5]. Although this estimate of R 0 may be biased due to many factors [Reference Farrington, Kanaan and Gay30], it provides an independent estimate that can be compared with the time-series susceptible-infected-recovered (TSIR) estimate of R 0, to ensure that the model fit is producing reasonable estimates.
Spatio-temporal analysis
We used wavelet analysis, described in detail in [Reference Torrence and Compo31], to examine the period of oscillations in the incidence data over time. Unlike Fourier analysis, wavelet analysis can capture the non-stationarity in the period of recurrent outbreaks over time. This allows us to describe how the period of incidence cycles vary over time and across diseases. We log(x + 1)-transformed the incidence time-series to dampen the amplitudes. We used a Morlet wavelet and applied the wavelet transform to the transformed incidence data to compute the power as a function of period and time. Statistical significance was tested against red noise background (signal noise produced by random-walk motion).
We also examined the synchrony in recurrent epidemics between states for each disease. We defined epidemic synchrony between two states as the Pearson correlation coefficient between the two incidence time-series. The incidence time-series was square-root-transformed to stabilize the variance. We examined how synchrony was related to distance between states (as measured by the latitude and longitude of the centre of the state) by estimating spatial correlation functions [Reference Grenfell, Bjørnstad and Kappey13, Reference Bjørnstad, Ims and Lambin32]. We used a nonparametric spline function to estimate the correlation functions, and computed confidence limits using bootstrapping (with 500 resamples) [Reference Bjornstad33]. For diseases where vaccination was implemented during the observed timeframe we computed the spatial correlation functions separately for pre-vaccination and vaccination-era data. For each disease, we also computed the cross-correlation coefficient between all states and the Federal District (Mexico City), to see if there were any lags between the incidence time-series.
To examine any spatial gradient in the timing of epidemics, we computed the ‘centre of mass’ of the incidence time-series. The centre of mass represents the average month in the year in which the most cases occurred over the entire observation time period. Bootstrapped confidence intervals were computed with 1000 resamples, by computing the maximum-likelihood estimate for the mean of a von Mises distribution [Reference von Mises34] for each resampled dataset. We examined the correlation between the centre of mass for each state and the latitude and longitude of the centre of the state, and repeated the analysis for each disease.
The TSIR framework
To estimate seasonal transmission rates we used the TSIR model developed by [Reference Finkenstädt and Grenfell4]. The TSIR model is a stochastic, discrete time analogue of the classic SIR model. The time-series of number of infected and the number susceptible are described by a set of difference equations. At each time step, the expected number of infected cases is given by
 $$E[I_{t + 1}] = \displaystyle{{\beta _{s\;} I_t^\alpha \; S_t} \over {N_t}},$$
where E[I t+1] is the expected number of infected individuals one infection generation time in the future; I t and S t are the numbers infected and susceptible at time, t, respectively; N t is the total population size at time, t; β s is the seasonal transmission factor; and α captures heterogeneities in mixing, not captured by the seasonality, and the effects of discretization.
Assuming all individuals eventually become infected, the number of infected individuals tracks the births, B, and the number of susceptible individuals is defined by:
 $$S_{t + 1} = S_t + B_t - I_t + u_t.$$
Here, u t is additive noise, with E [u t ] = 0. By reducing the susceptible population, vaccination has the same effect as lowering births. Vaccine coverage levels were assumed to be 80% for measles, mumps and rubella, and 90% for pertussis. Accordingly, the number of births in the TSIR model was discounted by 0·8 for measles, mumps, and rubella, and 0·9 for pertussis following the introduction of vaccination. Our main model results also hold over a range of assumed vaccination rates for these infections.
If the number of susceptible individuals fluctuates around a mean, then $S_t = \; \bar {S} N_t + \; Z_t$
, where
$S_t = \; \bar {S} N_t + \; Z_t$
, where $\bar {S} $
is the average proportion of susceptible individuals in the total population, N
t
, and Z
t
is the unknown deviation around the mean number of susceptible individuals. We can rewrite the susceptible difference equation in terms of the deviations, Z
t
, and iterate successively with an initial starting condition, Z
0. This yields:
$\bar {S} $
is the average proportion of susceptible individuals in the total population, N
t
, and Z
t
is the unknown deviation around the mean number of susceptible individuals. We can rewrite the susceptible difference equation in terms of the deviations, Z
t
, and iterate successively with an initial starting condition, Z
0. This yields:
 $$\mathop \sum \nolimits_{k = 0}^{t - 1} B_k = - Z_0 + \mathop \sum \nolimits_{k = 0}^{t - 1} I_k + Z_t + u_t.$$
Assuming u t is small, Z t can be estimated as the residuals from the locally varying regression of the cumulative number of births on the cumulative number of cases. We can then rewrite equation (1) as:
 $$E[I_{t + 1}] = \displaystyle{{\beta _{s\;} I_t^\alpha \; \left( {\,\bar {S\;} N_t + Z_t} \right)} \over {N_t}}.$$
The mean proportion of susceptible individuals, $\bar{S\;}$
, can be estimated using marginal profile likelihoods from estimating equation (4) for a range of values of
$\bar{S\;}$
, can be estimated using marginal profile likelihoods from estimating equation (4) for a range of values of $\bar{S\;}. $
We used a quasi-Poisson generalized linear model to estimate equation (4). We constrained the estimated
$\bar{S\;}. $
We used a quasi-Poisson generalized linear model to estimate equation (4). We constrained the estimated $\bar{S\;}$
to have an upper limit of 0·8 (i.e. 80% of the population). Conditional on the estimated
$\bar{S\;}$
to have an upper limit of 0·8 (i.e. 80% of the population). Conditional on the estimated $\bar {S\;} $
, the seasonal transmission rates, β
s
, were estimated using a quasi-Poisson generalized linear model with monthly or biweekly-specific factors (and no intercept). Since the TSIR model is not age-structured, here we are estimating the ‘effective’ seasonal transmission rates that encompass age structure [Reference Bjørnstad, Finkenstädt and Grenfell2].
$\bar {S\;} $
, the seasonal transmission rates, β
s
, were estimated using a quasi-Poisson generalized linear model with monthly or biweekly-specific factors (and no intercept). Since the TSIR model is not age-structured, here we are estimating the ‘effective’ seasonal transmission rates that encompass age structure [Reference Bjørnstad, Finkenstädt and Grenfell2].
We first corrected the incidence time-series for under-reporting using methods described in [Reference Finkenstädt and Grenfell4]. Assuming that all children eventually become infected in the absence of vaccination, the reporting proportion can be estimated as the slope of the regression line relating cumulative number of births to cumulative number of cases (see [Reference Finkenstädt and Grenfell4] for details). To allow for local variation in the regression of cumulative number of births on cumulative number of cases, we used a cubic smoothing spline. This allows for temporal variation in the reporting proportion. Having corrected the incidence data for under-reporting, we then fitted the TSIR model to the mumps and pertussis time-series using monthly time steps, which is close to the estimated generation times for these pathogens [Reference Anderson and May5]. As a robustness check, we also used biweekly time steps for mumps (generation time is estimated to be between 16 and 26 days [Reference Anderson and May5]), and the main results remained unchanged (Supplementary Fig. S10). For measles, rubella, varicella and scarlet fever, we fitted the TSIR model to the incidence time-series using biweekly time steps to match their shorter generation times. To convert the observed monthly incidence into biweekly time steps we used linear interpolation to produce observations for 24 time points in the year. This method maintains the peaks in the incidence data, although our results are robust to using cubic interpolation. Assuming that the time step used in the TSIR model is the true average time from infection to recovery, the estimates of the seasonal transmission rates, β s , correspond to the seasonally varying basic reproductive number, R 0. We fit the TSIR model to the incidence data for all states combined, as well as for each state separately.
Although our main focus was to analyse seasonal patterns in transmission, we also explored the ability to predict long-term incidence dynamics using the TSIR parameter estimates. For each disease, we fitted the TSIR model to the reported cases after correcting for under-reporting. We used the corresponding estimates of the seasonal transmission rates to forecast incidence for the observed time period. Predictions were made by sampling the incidence, I t+1, from a negative binomial distribution:
 $$I_{t + 1} \sim NB\left( {\displaystyle{{\beta _{s\;} I_t^\alpha \; S_t} \over {N_t}},\; I_t} \right),$$
with mean $E[I_{t + 1}] = \displaystyle{{\beta _{s\;} I_t^\alpha \; S_t} / {N_t}}$$
and shape parameter I
t
. We used the observed I
0, corrected for under-reporting, and estimated S
0 as the initial conditions, and allowed the simulation to continue until the end of the observed time-series. To assess the accuracy of the predicted incidence time-series, we calculated the normalized root mean squared error (NRMSE) between the predicted incidence and the actual incidence (normalized by dividing the root mean squared error by the average incidence over the observed time period).
$E[I_{t + 1}] = \displaystyle{{\beta _{s\;} I_t^\alpha \; S_t} / {N_t}}$$
and shape parameter I
t
. We used the observed I
0, corrected for under-reporting, and estimated S
0 as the initial conditions, and allowed the simulation to continue until the end of the observed time-series. To assess the accuracy of the predicted incidence time-series, we calculated the normalized root mean squared error (NRMSE) between the predicted incidence and the actual incidence (normalized by dividing the root mean squared error by the average incidence over the observed time period).
RESULTS
Age profile of infection
The mean age of infection estimated from age-structured case data for all states combined was 6·47 for mumps, 6·52 for rubella, 6·78 for varicella, and 5·46 for scarlet fever (Fig. 2). The age-specific FOI was highest in the 4–14 years age group for mumps and scarlet fever. This is in the same range as what has been found for other childhood diseases in the past [Reference Anderson and May5, Reference Grenfell and Anderson29]. The estimated mean age of infection for varicella was within the 5–14 years age range that has been estimated in the past [Reference Anderson and May5, Reference Brisson11]. The FOI, however, was highest in the 1–4 years age group for varicella. Somewhat surprisingly, for rubella, the highest FOI was in the 0–1 years age group, although the confidence intervals for the estimates are largest for rubella. The 4–14 years age group has the second highest FOI for rubella.
Top row: Estimated force of infection (FOI) by age for (a) mumps, (b) rubella, (c) varicella, and (d) scarlet fever for all states combined. Bottom row: Cumulative proportion of cases by age for (e) mumps, (f) rubella, (g) varicella, and (h) scarlet fever for all states combined. For the same age, the different points correspond to different years. The piecewise fit is shown in red. Mean age of infection, A, for each disease was calculated from the fitted model.

The mean age of infection estimated separately for each state, by fitting a smoothing spline to the cumulative proportion of cases by age, were lower than the mean age of infection estimated for all states combined using the catalytic framework. This is likely because there is less year-to-year variation in the cumulative proportion of cases by age within states (as opposed to when we look at all states together), and the spline function is overfitting to the initial increase in the cumulative proportion of cases from the 0–1 to 1–4 years age group. The mean age of infection, estimated separately by state, was not significantly associated with population size, density, or the crude birth rate. However, we found significant geographical variation in the mean age of infection (Figs 3 and 4). The mean age of infection estimated separately for each state was significantly associated with the longitude of the centre of the state for mumps [A = 12·39 (1·81) + 0·06 (0·02) longitude; P = 0·001, r 2 = 0·27, s.e. in parentheses], rubella [A = 11·32 (2·78) + 0·08 (0·03) longitude, P = 0·008, r 2 = 0·19, s.e. in parentheses], varicella [A = 14·31 (1·94) + 0·10 (0·02) longitude, P = 0·00001, r 2 = 0·46, s.e. in parentheses], and scarlet fever [A = 8·35 (2·02) + 0·05 (0·02) longitude, P = 0·023, r 2 = 0·13, s.e. in parentheses]. There were also significant associations of mean age of infection with latitude for all four infections, although the strength of the association was weaker. The association between latitude/longitude and the mean age of infection remained significant, and of similar magnitude, even after controlling for the population size and density. The mean age of infection was significantly positively associated with (logged) poverty for mumps (estimated association = 0·67, P = 0·005), rubella (estimated association = 0·95, P = 0·008), and varicella (estimated association = 0·76, P = 0·014).
Estimated mean age of infection plotted against longitude for each state. Ordinary least squares regression fit and 95% confidence intervals are shown in red.

Estimated mean age of infection by state. Darker green colours indicate a higher mean age of infection. The key indicates the upper age bound for each colour category. Red circle indicates the location of Mexico City.

The estimated R 0 (averaged over all states) was 6·89 (variance = 0·97) for mumps, 13·26 (variance = 18·4) for rubella, 9·92 (variance = 3·87) for varicella and, 11·83 (variance = 3·68) for scarlet fever. We observe the same spatial gradient in R 0 (controlling for the birth rate and population density) as we do for the mean age of infection, with states in the east having lower R 0 compared to states in the west.
Spatio-temporal dynamics
Timing of outbreaks
Figure 5 shows the median number of cases by month, for consecutive pairs of years (pre-vaccination) for each disease for all states combined. Measles and pertussis had the greatest variance in monthly incidence over the observed time period. Measles and varicella, and to some degree, rubella, show clear annual patterns, while the other pathogens exhibit a slightly more complicated pattern. For all of the infections, incidence fell during the summer school holidays. With the exception of mumps, all infections had peak incidence in the spring around April. For mumps, we observed biannual peaks. There was a second peak just at the start of summer holidays, with the second peak being higher than the April peak every other year. For scarlet fever, the annual peak incidence switched from April to June every other year.
Median number of cases by month (and interquartile range) for consecutive pairs of years in the pre-vaccination time-series for each disease (for all states combined). Approximate school holidays are shown in grey. n, number of years of data used for each infection.

All diseases had similar epidemic centres of mass, around April. Measles incidence had the earliest centre of mass (mid-March), and rubella incidence had the latest centre of mass (late April). Overall, we found no evidence of a relationship between the epidemic centre of mass and demographic factors. However, centre of mass (CoM) was significantly negatively correlated with longitude (Fig. 6) for measles [CoM = −0·85 (0·58) – 0·02 (0·01) longitude, P = 0·001, r 2 = 0·29, s.e. in parentheses], varicella [CoM = 0·92 (0·18) – 0·004 (0·001) longitude, P = 0·016, r 2 = 0·15, s.e. in parentheses] and, scarlet fever [CoM = −0·22 (0·58) – 0·02 (0·01) longitude, P = 0·007, r 2 = 0·19, s.e. in parentheses]. The centre of mass was significantly positively associated with poverty (even after controlling for population size and longitude) for rubella (estimated association = 0·08, P = 0·029), varicella (estimated association = 0·05, P = 0·044), and scarlet fever (estimated association = 0·18, P = 0·032). Combined with our earlier findings, this result indicates that states that had higher rates of poverty, on average, had higher mean ages of infection (i.e. lower rates of disease transmission) and experienced epidemics later in the year (Supplementary Fig. S7).
Centre of mass against longitude for (a) measles, (b) mumps, (c) rubella, (d) varicella, (e) scarlet fever, and (f) pertussis. Ordinary least squares regression fit and 95% confidence intervals are shown in red.

Periodicity
Figure 7 shows the wavelet power spectra for the six infections. Measles dynamics are erratic, exhibiting annual, biennial and multiennial cycles. Rubella (pre-vaccination), varicella and scarlet fever had a dominant annual periodicity. The annual periodicity of rubella disappeared after the introduction of vaccination. Mumps incidence exhibited a mixture of annual and multiennial cycles, particularly in the earlier years. The 4-year period was dominant for pertussis. This observed difference between pertussis and other similar childhood diseases such as measles has been described in detail in [Reference Rohani, Keeling and Grenfell8], and the longer cycles for pertussis are likely to be a result of differing response to dynamical noise as a result of a longer infectious period. Pertussis and rubella incidence exhibited significant non-resonant power, while varicella exhibited very large resonant power. This is consistent with previous work that has suggested that diseases with large R 0 (such as measles and varicella) typically exhibit large resonant power (annual or multi-annual dynamics), while diseases such as pertussis (small amplitude of seasonality) and rubella (small R 0) also exhibit non-resonant power due to transient dynamics [Reference Bauch and Earn7].
Wavelet power spectra of the incidence time-series for all states combined for (a) measles, (b) mumps, (c) rubella, (d) varicella, (e) scarlet fever, and (f) pertussis. Lighter shades of grey indicate greater power.

Synchrony
To characterize spatial patterns we examined the synchrony between states for each disease, which reflects correlations between states in both amplitude and timing of epidemics (Fig. 8). Epidemic synchrony declines with distance for measles, mumps, rubella but the decline is not statistically significant at the 95% level. For scarlet fever, the epidemic synchrony drops significantly with distance. Measles epidemics became less synchronized with the introduction of vaccination, a pattern that has also been documented for cities in the UK [Reference Rohani, Earn and Grenfell35].
Estimated spatial correlation functions showing epidemic synchrony (Pearson correlation coefficient) between states as a function of distance (as measured by the latitude and longitude of the centre of the state) for (a) measles, (b) mumps, (c) rubella, (d) varicella, (e) scarlet fever, and (f) pertussis, along with 95% confidence intervals. Red indicates pre-vaccination and blue indicates post-vaccination era epidemics (1991 onwards for measles and pertussis; 1998 onwards for mumps and rubella). The dashed horizontal line represents the average correlation across all states.

Rohani et al. [Reference Rohani, Earn and Grenfell35] found a reverse pattern, i.e. greater synchrony following the introduction of vaccination, for pertussis epidemics in the UK. Interestingly, in Mexico, mumps and rubella epidemics became more synchronized in the vaccination era, while the synchrony for pertussis was not significantly different pre- and post-vaccination. Synchrony in varicella epidemics remains relatively high and constant with distance. This could be the result of the strong seasonality in varicella transmission (discussed below) synchronizing epidemics across the country.
The cross-correlation coefficients between all states and the Federal districts confirmed that epidemics were synchronized across Mexico for all diseases, except pertussis. The zero time-step lag was highest for all districts for measles and varicella, for 30/31 districts for mumps, and for 25/31 states for rubella and scarlet fever. For pertussis, the zero time step lag was the most common (for 6/31 states), followed by a lag of two months (for 5/31 states; epidemic occurring two months earlier in the Federal District).
Seasonal variation in transmission
Table 2 shows the results of fitting the TSIR model to the incidence data for each of the six infections, for all states combined. There was a great deal of variation in the estimated $\bar {S} $
for each infection, with the lowest estimated for pertussis (
$\bar {S} $
for each infection, with the lowest estimated for pertussis ( $\bar {S} $
= 0·05) and the highest estimated for scarlet fever and varicella (
$\bar {S} $
= 0·05) and the highest estimated for scarlet fever and varicella ( $\bar {S} $
= 0·8). The estimated reporting proportion was low for all six infections, particularly for scarlet fever and pertussis. A few studies, looking at measles reporting, have estimated the reporting proportion in Mexico to be as low as 3% during the 1980s [Reference Katz27]. Our estimated reporting proportion for some infections, such as pertussis, is quite a bit lower. Errors in our estimates of the reporting proportion and the mean proportion susceptible will affect the estimated magnitude of the seasonal transmission rates. This makes it difficult to compare the magnitude of the seasonal transmission rates across diseases and states, as the uncertainty in the estimated
$\bar {S} $
= 0·8). The estimated reporting proportion was low for all six infections, particularly for scarlet fever and pertussis. A few studies, looking at measles reporting, have estimated the reporting proportion in Mexico to be as low as 3% during the 1980s [Reference Katz27]. Our estimated reporting proportion for some infections, such as pertussis, is quite a bit lower. Errors in our estimates of the reporting proportion and the mean proportion susceptible will affect the estimated magnitude of the seasonal transmission rates. This makes it difficult to compare the magnitude of the seasonal transmission rates across diseases and states, as the uncertainty in the estimated $\bar {S} $
and reporting proportion will vary. For scarlet fever and varicella,
$\bar {S} $
and reporting proportion will vary. For scarlet fever and varicella, $\bar {S} $
was estimated to be 0·8 which is at the upper bound of our constraint on
$\bar {S} $
was estimated to be 0·8 which is at the upper bound of our constraint on $\bar {S}. $
These estimates are most likely biased upwards, and has the effect of downward biasing the magnitude of the estimated seasonal transmission rates.
$\bar {S}. $
These estimates are most likely biased upwards, and has the effect of downward biasing the magnitude of the estimated seasonal transmission rates.
Infection characteristics estimated by the TSIR model. The approximate generation time of each infection determines the discrete time step used in the TSIR model
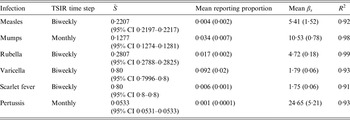
TSIR, Time-series susceptible-infected-recovered; CI, confidence interval. $\bar {S} $
is the estimated mean proportion of susceptibles in the population (95% CIs in parentheses, derived from the profile likelihood using the χ
2 distribution with 1 degree of freedom). Mean reporting proportion is the mean of the time-varying reported rates estimated using locally varying regression of cumulative births on cumulative cases (standard deviation of the time-varying rates in parentheses). Mean β
s
is the mean value of the seasonal transmission rates estimated via the TSIR model (maximum standard error in parentheses). The R
2 values (on a log scale) for the TSIR fit are measured as 1 – [residual deviance/null deviance].
$\bar {S} $
is the estimated mean proportion of susceptibles in the population (95% CIs in parentheses, derived from the profile likelihood using the χ
2 distribution with 1 degree of freedom). Mean reporting proportion is the mean of the time-varying reported rates estimated using locally varying regression of cumulative births on cumulative cases (standard deviation of the time-varying rates in parentheses). Mean β
s
is the mean value of the seasonal transmission rates estimated via the TSIR model (maximum standard error in parentheses). The R
2 values (on a log scale) for the TSIR fit are measured as 1 – [residual deviance/null deviance].
However, we are most interested in the shape of the seasonal transmission rate which is unaffected by the estimated $\bar {S} $
and reporting proportion. The transmission rates, estimated for all states combined, exhibit a marked decline during the summer for mumps, rubella, varicella, and scarlet fever (Supplementary Figs S8 and S9). We estimate a small decline in transmission for measles; however, the estimates for measles are highly uncertain as we only had a few years of incidence data prior to the start of vaccination. We did not detect any clear patterns in the transmission rate for pertussis.
$\bar {S} $
and reporting proportion. The transmission rates, estimated for all states combined, exhibit a marked decline during the summer for mumps, rubella, varicella, and scarlet fever (Supplementary Figs S8 and S9). We estimate a small decline in transmission for measles; however, the estimates for measles are highly uncertain as we only had a few years of incidence data prior to the start of vaccination. We did not detect any clear patterns in the transmission rate for pertussis.
We also estimated monthly transmission rates for all diseases separately by state (Fig. 9). For pertussis, for 16 out of the 32 states, we were unable to estimate at least one seasonal transmission parameter because there were not enough reported cases for that month. Furthermore, some estimated transmission rates for pertussis were unreasonably large, and we excluded all estimated transmission rates above 50 for our analysis (nine states). The yearly average transmission rate (averaged across all states) was 6·83 for measles, 10·58 for mumps, 4·20 for rubella, 2·19 for varicella, 3·14 for scarlet fever, and 14·54 for pertussis (Supplementary Fig. S11). The surprisingly low estimate of the average transmission rate for varicella may be due to biases in our estimate of $\bar {S}. $
All of the diseases, with the exception of pertussis, exhibited a decline in transmission during the summer months, which is consistent with school term-time forcing. School holidays in Mexico consists of 2 weeks at Christmas, 2 weeks at Easter, and summer holidays from July to mid-August [Reference Metcalf25]. Transmission (averaged across all states) peaked in December for measles, varicella and pertussis; February for rubella and scarlet fever; and in March for mumps. Transmission was lowest in August for measles, mumps, and rubella; July for varicella and scarlet fever; and June for pertussis. There was no significant spatial gradient in the magnitude of transmission or the coefficient of variation in the transmission parameter. For rubella and varicella, we found a negative significant association between the coefficient of variation and density (rubella: estimated association = −0·01, P = 0·011; varicella: estimated association = −0·01, P = 0·028). For rubella, we also found a significant correlation with poverty (estimated association = −0·18, P = 0·004), but not for any of the other infections.
Mean centred seasonal transmission coefficients from the time-series susceptible-infected-recovered fit for (a) measles, (b) mumps, (c) rubella, (d) varicella, (e) scarlet fever, and (f) pertussis for each state (black lines). The red line indicates the seasonal transmission coefficient averaged over all states. Approximate school holidays are shown in grey.

Forecasting epidemics
Finally, although our main aim with the TSIR analysis was to examine seasonal patterns in transmission, we also explored the ability to predict long-term dynamics using the TSIR framework (Fig. 10). Our results, for all states combined, suggest that it may be possible to make reasonable predictions for varicella (NRMSE = 0·33) and scarlet fever (NRMSE = 0·37). The more complex dynamics of mumps (NRMSE = 0·44), rubella (NRMSE = 0·67), and pertussis (NRMSE = 1·38) are not captured as well by the TSIR framework; for measles the model fit is poor since we fit the TSIR model to only a few years of pre-vaccination incidence data (NRMSE = 3·40).
Actual cases corrected for underreporting (in black) and 500 stochastic forward predictions (in red) from the time-series susceptible-infected-recovered fit for (a) measles, (b) mumps, (c) rubella, (d) varicella, (e) scarlet fever, and (f) pertussis for all states combined.

We also examined the ability to predict long-term dynamics of mumps, rubella, varicella, and scarlet fever at the state-level. The results varied widely across states. The NRMSE averaged across states was lowest for varicella (mean NRMSE = 0·75), followed by mumps (mean NRMSE = 0·92), scarlet fever (mean NRMSE = 1·01), rubella (mean NRMSE = 1·60), and measles (mean NRMSE = 4·47). The NRMSE was not significantly correlated with the state's demographic and socioeconomic indicators (P > 0·05 for all associations).
DISCUSSION
Our analysis reveals interesting epidemiological variations across the six infections, but our results are consistent with predictions from a seasonally forced SIR model. All infections, except pertussis, exhibited a seasonal pattern in transmission with a drop during the summer months. This is consistent with the well-defined term-time forcing of directly transmitted childhood infections observed elsewhere, most notably for pre-vaccination measles in the UK [Reference Bjørnstad, Finkenstädt and Grenfell2]. Unlike Metcalf et al. [Reference Metcalf24] who found increased transmission of bacterial infections (including pertussis and scarlet fever) during the summer, we found a reduction in transmission for scarlet fever; for the other bacterial infection (pertussis) we found no change in transmission during the summer.
The four pathogens – mumps, rubella, varicella, and scarlet fever – for which we had age-structured data, all had similar mean ages of infection (around 6 years). Basic compulsory education in Mexico starts at the age of 6, although almost 100% of children are enrolled in formal care and pre-school by age 5 [36]. Net enrolment rate in primary school was 94·3% for Mexico in 1985, and has remained fairly steady (lowest rate was 93·5% in 2006) [37]. On the other hand, fewer than 10% of children aged <3 years are enrolled in any form of formal care. Thus, the estimated mean age of infection, which is between the ages of 5 and 7 years, is consistent with the hypothesis of high transmission in schoolchildren during term time driving the epidemic dynamics.
Our results suggest that there was substantial variation in the epidemiology and dynamics of the six childhood infections in Mexico, and we also found evidence for the role of demography and socioeconomic factors in determining dynamics, at least for some of the infections. All six pathogens had peaks in incidence in the spring and troughs in autumn. Schenzle [Reference Schenzle6] showed, using an age-structured model, that for countries where the school year starts after a long summer vacation, with relatively short interruptions throughout the year, peak measles incidence occurs around March, and then declines throughout the school year as the susceptible populations within schools are depleted. The incidence time-series for childhood infections in Mexico are broadly consistent with this result. This also aligns with our estimates of seasonal patterns of transmission, which are consistent with term-time forcing (see above).
Mumps and pertussis had the most complex dynamics with multiennial cycles. This could be the result of longer generation times interacting with the nonlinear dynamics of transmission, as has been suggested earlier [Reference Rohani, Keeling and Grenfell8]. Rubella and scarlet fever, which have shorter generation times, had annual epidemic cycles. Although the generation time for varicella is similar to that of mumps and pertussis, it has annual periodicity possibly because of higher transmission rates.
Our analysis also reveals interesting spatial patterns. We document lower mean ages of infection for all pathogens around Mexico City, and higher mean ages of infection in the states in the eastern coast. This is consistent with past findings for rubella epidemics in Mexico [Reference Metcalf25]. States with higher poverty rates also had a higher mean age of infection for mumps, rubella, and varicella. Poorer states also experienced epidemics later in the year compared to other states. The observed spatial gradient could be due to biased estimates of the age-specific FOI [Reference Ferrari38]. Another possible explanation could be regional variability in R 0, for instance due to differences in schooling rates and practices across states.
While the longitudinal gradient in the mean age of infection can be partly explained by the spatial gradient in poverty, further work is needed to disentangle whether or not the spatial gradient is driven by socioeconomic factors or perhaps by environmental factors. Environmental conditions, such as temperature and absolute humidity, may affect pathogen survival outside the host and the dispersal of infectious particles [Reference Lowen20]. Scarlet fever epidemics in England and Wales in the mid-nineteenth century were significantly correlated with dry conditions in the spring/summer; this was hypothesized to be the result of changes in host susceptibility and/or better pathogen survival in the environment due to low absolute humidity [Reference Duncan, Duncan and Scott10]. All six pathogens are fomite transmitted, but unlike influenza [Reference Shaman17], the link between environmental factors and diseases dynamics has not been shown conclusively for any of the pathogens considered here. Future work will require a more complete analysis of various drivers using formal techniques such as those described in [Reference te Beest39].
Somewhat surprisingly, we found that states that are further east experienced measles, varicella, and scarlet fever epidemic peaks earlier in the year compared to other states. If the higher mean age of infection observed in these states was being driven by a lower transmission rate, then we would expect the epidemics to occur later in the year compared to other states. This could be due to biases in our estimation in the mean age of infection and corresponding R 0. However, further work is needed to disentangle biases in the data and possible socioeconomic and environmental drivers.
We found that epidemics were synchronized between states for all diseases, with the exception of pertussis. Our scale of observation was too large to detect potential lags in remote areas of the country. Unlike the other infections, pertussis epidemics were not synchronized across the country. The irregular dynamics of pertussis incidence, along with the lack of epidemic synchrony between states, suggests that pertussis epidemics in Mexico were strongly influenced by stochasticity, which is consistent with past findings [Reference Rohani, Keeling and Grenfell8].
Interestingly, despite differences in the dynamics and epidemiology of the infections, five of the six childhood infections had a similar seasonal pattern in transmission rates. The peak transmission varied from December to March for the six infections, but lowest transmission was consistently in July or August (for all infections, except pertussis). For two of the infections, rubella and varicella, we found that states with lower poverty and lower population density had higher variation in the transmission rate through the year. It is possible that term-time forcing is more dominant in those states because of greater proportions of children in school (for the states with less poverty) or because most of the transmission is occurring in schoolchildren (for less dense states). The results from the TSIR simulations suggest that the dynamics of varicella and to some extent, scarlet fever, can be predicted with reasonable accuracy using stochastic simulations. At the state-level the quality of predictions varied greatly, but was not significantly associated with the states’ demographic and socioeconomic indicators.
In conclusion, our results suggest that despite differences in dynamics and epidemiology, five of the six childhood infections studied here, behave in accordance with a seasonally forced SIR model. Term-time forcing is likely to be a major component of seasonal dynamics for measles, mumps, rubella, varicella and scarlet fever in Mexico. Pertussis shows more unpredictable dynamics, possibly due to life history differences such as waning immunity and a longer generation time. While there was a longitudinal gradient in the mean age of infection, the pattern and magnitude of seasonal transmission rates were uncorrelated with longitude. It is possible that our scale of observation (state-level) is too large to capture more erratic local dynamics. Nonetheless, these results suggest that epidemics were fairly synchronized across Mexico for five of the six infections. This has important implications for control efforts and the predictability of epidemics. For infections, such as pertussis, that show less clear patterns of term-time forcing, predicting dynamics becomes difficult. However, for most directly transmitted childhood infections, with varying degrees of transmissibility, generation times, and immunity conferred, term-time forcing appears to be a dominant driver of disease dynamics, leading to more predictable epidemic cycles.
SUPPLEMENTARY MATERIAL
For supplementary material accompanying this paper visit https://doi.org/10.1017/S0950268816002673.
ACKNOWLEDGEMENTS
This work was funded by the Eunice Kennedy Shriver National Institute of Child Health and Human Development (A.S.M., grant no. 5R24HD047879), the National Institutes of Health training grant (A.S.M., grant no. 5T32HD007163), the Bill and Melinda Gates Foundation (C.J.E.M., B.T.G.), the RAPIDD program of the Science & Technology Directorate, Department of Homeland Security and the Fogarty International Center, National Institutes of Health (C.J.E.M., B.T.G.) and a Wellcome Trust Sustaining Health grant (C.J.E.M., grant no. 106866/Z/15/Z).
DECLARATION OF INTEREST
None.


