

Introduction
The ice extent in the Bellingshausen and Amundsen Seas varies seasonally from 0.7 × 10⁶ to 2.8 × 10⁶ km2, the smallest seasonal variability of all the Southern Ocean sea-ice sectors (Reference Gloersen,, Campbell, Cavalieri, Comiso, Parkinson and Zwally.Gloersen and others, 1992). Beginning in 1988, there was a steady decline in the summer ice extent in this region that culminated in a significant anomaly in early 1991 when little sea ice was detected in the Bellingshausen Sea using satellite passive microwave data (Reference Jacobs, and Comiso.Jacobs and Comiso, 1993). These changes coincided with more southerly surface winds, increased cyclonic activity and rising surface air temperatures, which reached historic highs along the west side of the Antarctic Peninsula. Consequently, it was suggested that the Bellingshausen/Amundsen Sea ice anomalies might be useful analogues for future climate change scenarios (Reference Jacobs, and Comiso.Jacobs and Comiso, 1993). Reference Parkinson,Parkinson (1995), drawing attention to a misleading article in the popular press about the sea-ice anomalies and warning about taking them out of their long-term spatial and temporal context, showed that the “anomalous” events in the Bellingshausen Sea were, in fact, part of the normal cycle of ice growth and decay.
Reference Jacobs, and Comiso.Jacobs and Comiso (1993) hypothesized that, as a result of the climatic changes in the Bellingshausen Sea region, the ice temperatures and surface wetness increased due to heavier snowfall and sea-water flooding of the ice surface, leading to the almost complete disappearance of the summer sea-ice cover. The consequences of increased snow accumulation and flooding on sea ice are, however, far from straightforward. Reference Eicken,, Fischer and LemkeEicken and others (1995), using a numerical ice-growth model subject to variable snow-accumulation rates and allowing for snow-ice formation, have shown that, while increased snow accumulation rates do lead to a thinner, more porous and thus weaker ice cover, they might also enhance snow-ice formation once sea-water flooding has occurred and contribute to the survival of perennial sea-ice covers in areas such as the western Weddell Sea and the Bellingshausen Sea.
To understand the relationship between sea ice and climate requires a knowledge of the seasonal and regional variability of the snow and ice processes and air – ice ocean interactions that contribute to sea-ice growth and decay. Not all such information can be gleaned from satellites, largely because much remains to be learned about the remote-sensing signatures of sea ice and their dependence on surface properties and processes. Furthermore, direct observations of these processes and interactions as they occur during the ice growth and decay seasons are relatively rare, although they are now increasing in number as research vessels spend more time in the pack ice in all seasons. One alternative to direct observations and measurements is to develop numerical models of sea-ice processes and air ice-ocean interactions. Another alternative is to examine the structure and properties of ice cores which contain a record of some of the conditions and processes that have contributed to ice growth and decay since the initial formation of the ice cover. Such information can, in turn, provide input to numerical models, and improve understanding of sea-ice remote-sensing signatures.
In August and September 1993, ice cores were obtained in the late-winter pack ice in the Bellingshausen and Amundsen Seas. The objective of the study was to improve our knowledge of the conditions and processes that contribute to first-year ice development, by making measurements of ice crystal structure and stable-isotopic composition (18O/16O ratios), as well as investigating the snow cover characteristics (Reference Jeffries,, Morris, Worby and Weeks.Jeffries and others, 1994c) and the snow and ice thickness distribution (Reference Worby,, Weeks, Jeffries, Morris and Jaña.Worby and others, 1994, Reference Worby,, Jeffries, Morris, Weeks and Jaña.1996a). This paper presents (1) the late-winter oxygen-isotope and ice structure data, which allow us to determine the amount of congelation ice, frazil ice and snow ice, and the amount of snow that is entrained in floes by sea-water flooding and snow-ice formation; and (2) data on the thickness of individual layers of snow ice, frazil ice and columnar ice and the implications for the nature of the ice growth environment and the dynamic and thermodynamic processes that contribute to sea-ice development.
The structure and stable-isotopic composition of ice cores obtained from sea ice during the transition from first-year to multi-year ice in this region in late summer 1992 were discussed by Reference Jeffries,, Shaw, Morris, Veazey and KrouseJeffries and others (1994a). In light of the results of the late-winter 1993 core analysis, a reassessment of the 1992 structure and stable-isotope data provides a secondary focus for this paper. This relates to (1) the new identification of superimposed ice, which then allows the remaining granular ice to be differentiated into snow-ice and frazil-ice categories using stable isotopes; (2) the contributions of superimposed, frazil and snow ice plus that of congelation ice to ice development; and (3) the amount of snow that is entrained in floes by snow-ice and superimposed-ice formation. The 1992 and 1993 results are discussed and compared with similar data from elsewhere in the Southern Ocean sea-ice cover.
2. Study Area and Methods
The study of the late-winter sea ice was conducted from the R.Y. Nathaniel B. Palmer, which operated for 37 d in August and September 1993 in the Bellingshausen and Amundsen Seas between latitudes 66.75 ° and 70.3 ° S, and longitudes 77 ° and 110 ° W (Fig. 1). During the course of the cruise, 63 ice cores with a diameter of 0.1 m were obtained for structural and isotopic analysis from 50 different ice floes at different locations along the ship’s track. On being removed from the ice, the base of each core was examined for the presence of a friable skeletal layer before being returned to the ship for crystal-Structure analysis in the science freezer. This involved cutting 2 – 3 mm thick sections along the length of each core and examining them between crossed polarizing filters. Samples (total: 524) were then cut from each core based on structural variations in the ice, and melted for oxygen isotope analysis. In addition, a total of 155 snow samples from snow pits, and 36 sea-water samples from the upper 15 m of the water column adjacent to the floes from which cores had been obtained, were analyzed for their oxygen isotopic composition. The oxyen isotope analysis was done using standard procedures on a mass spectrometer, and the values are expressed as δ18O in parts per thousand (‰), as described in Reference Jeffries,, Shaw, Morris, Veazey and KrouseJeffries and others (1994a).
Map of the study area, showing the cruise track of the R.V. Nathaniel B. Palmer in August and September 1993 in the park ice, represented by the location of each site where ice cores were obtained (solid circles). The Julian day (JD) at a number of sites is given. The three open circles annotated with the abbreviation BSS show the locations where 12 cores were obtained from different floes in three days in March 1992 as the USCGC Polar Sea passed through the late-summer pack ice. At that time, the ice edge was at approximately 70 °S.

The late-summer cores that are considered in this paper were obtained in the southwestern Bellingshausen Sea in early March 1992. Twelve cores with a diameter of 0.1 m were obtained at three sampling locations (Fig. 1) and analyzed using procedures described in Reference Jeffries,, Shaw, Morris, Veazey and KrouseJeffries and others (1994a). The procedures differed from those described above in only one respect: the thickness of sub-layers comprising major layers of granular ice was not measured. The oxygen isotopic composition of snow and surface sca-water samples was also analyzed. Reference Jeffries,, Shaw, Morris, Veazey and KrouseJeffries and others (1994a) believed that most of the 1992 cores were from first-year floes that had just survived their first summer. Thus, in relative terms, many of the 1992 floes were older when they were sampled than were the 1993 floes.
The δ 18O data are used to differentiate between granular snow ice and granular frazil ice and to determine the fraction of snow contributing to the snow-ice layers and to the entire ice thickness. Reference Lange,, Schlosser, Ackley, Wadhams and Dieckmann.Lange and Others (1990) described a model to determine the fraction of snow and meteroric ice in Weddell Sea ice. Here we use a simplified version of that model that was used to determine the snow fraction and meteoric ice fraction of late-summer ice cores in the Bellingshausen/Amundsen region (Reference Jeffries,, Shaw, Morris, Veazey and KrouseJeffries and others, 1994a).
The model has the form
where f s is a snow fraction, f sw is a sea-water fraction, δ s is the mean δ 18O value of the snow, δ is the mean δ 18O value of the ice layer for which the snow fraction is being determined, and δ sw is a sea-water δ 18O value. For δ s we use values of −17‰ −13.2‰ and −9.4‰ (i.e. the mean snow δ 18O value ± 1 s.d. (−13.2 ± 3.8‰)) to calculate f s values. We do this to allow for the variability of snow δ 18O values that arises from atmospheric processes that affect the isotopic ratio of the moisture prior to and during precipitation events, and from factors such as metamorphism, wind erosion and redeposition that affect the isotopic composition of the snow cover once it has been deposited on the floes. Although the mean δ 18O value of the sea-water samples was −0.9‰, we use a value of 0.0‰ for δ sw. This allows for isotopic fractionation (α = 1.0009) during the formation of snow ice, which is implicit in our choice of 0.0‰ as the isotopic criterion for differentiating between snow ice and frazil ice.
3. Ice Structure and Oxygen Isotopic Composition, Winter 1993
3.1 General Structural Characteristics
The ice cores were composed primarily of granular and columnar ice and it was typical for the cores to be composed of many layers of one or both ice types. This multiple layering of each ice type was a characteristic structural feature of the majority of the cores regardless of spatial sampling scale, i.e., it was observed in multiple cores obtained from a single floe and in cores obtained from floes spaced hundreds of kilometres apart (Fig. 2). Furthermore, any given layer of granular or columnar ice was often composed of numerous sub-layers stacked one upon the other. In granular ice, the sub-layers were distinguished from one another by differences in crystal size and/or sharp boundaries. For an illustration of sharp boundaries between granular ice sub-layers that characterize a pancake formed by rafting, see Reference Lange,, Ackley, Wadhams, Dieckmann and EickenLange and others (1989, Fig. 3).
(a) Structure diagrams and δ18O profiles for selected ice cores along a 125 m long ice thickness transect on a single ice floe on Julian day 262 (19 September 1993). (b) Structure diagrams and δ18O profiles for selected ice cores from four different floes spaced 4 – 6 km apart on Julian day 245 (2 September 1993). FRAG, fragmented ice. (c) Structure diagrams and δ18O profiles for selected ice cores from floes spaced tens to hundreds of kilometres apart between Julian days 240 and 255 as the ship proceeded southwestward and then westward through the central and western Bellingshausen Sea.

Composite δ18O profiles of the August/September 1993 ice cores in three thickness categories for the Bellingshausen/ Amundsen Seas. Each profile represents an average of all the ice-core δ18O profiles in each thickness category. Note that the depth scale is normalized. Each data point represents the mean δ18O value, and the horizontal bars the standard deviation of all the δ18O values in each of eleven 0.1 m bins.

The boundaries between the columnar-ice sub-layers were often evident as sharp discontinuities in crystal growth and changes in column width, that suggested that the original columnar-ice layer had been fractured and the resultant sub-layers had been stacked on top of each other. Columnar-ice layers tilted over at an angle were observed occasionally. For examples of tilted congelation-ice layers see Reference Jeffries,, Shaw, Morris, Veazey and KrouseJeffries and others (1994a, figs 5 and 8). Twenty nine (46%) of the cores had a basal layer of columnar ice, but only six of those had a basal skeletal layer that indicated that there was active ice growth at the time of sampling. The sites with skeletal layers had very little else in common; ice thickness varied between 0.3 and 0.93 m, snow depth between 0.03 and 0.22 m, snow/ice interface temperatures between −10.1 ° and −2.2 ° C and snow surface temperatures between −22.5 ° and 0 ° C.
Graphical representation of the thickness of surface snow-ice layers, and the thickness and position of buried snow-ice layers in the cores for which δ18O data are available.

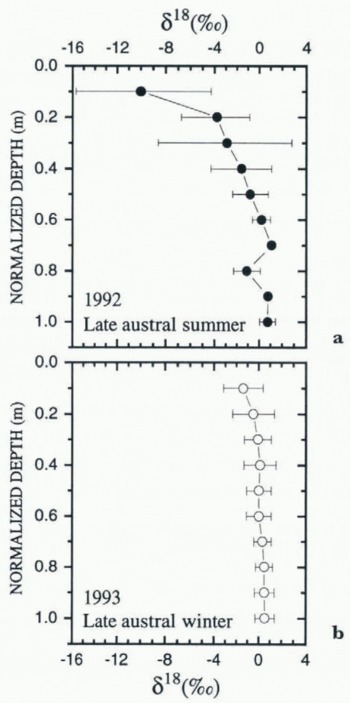
Composite δ18O profiles for (a) all the 1992 ice cores and (b) all the 1993 ice cores. Each profile represents an average of all the ice-core δ18O profiles each year. Note that the depth scale is normalized. Each data point represents the mean δ18O value, and the horizontal bars the standard deviation of all the δ18O values in each of eleven 0.1 m bins.
A few cores contained layers of poorly consolidated granular ice sandwiched between layers of fully consolidated granular ice (Fig. 2b). The cores of the poorly consolidated granular ice remained intact, but the ice was very porous. Individual grains were still visible as the ice crystals were still freezing together and consolidating, making the cores sufficiently weak that they could be crushed by hand. Some cores contained thin layers of fragmented ice composed of angular, randomly oriented crystals that appeared to be fragments of columnar ice that had lost its original structure. Cavities were also encountered within some floes and some had vertical dimensions exceeding 0.5 m (e.g. core I. floe 253; Fig. 2a). Occasionally, a skeletal layer was observed growing down from the roof of a cavity, evidence that columnar-ice growth was occurring.
3.2. δ 18O Profiles
The δ 18O values in all but one of the ice cores varied between −6.6‰ and +2.0‰. The δ 18O profiles of individual ice cores show that the most negative δ 18O values occurred primarily in granular-ice layers in the uppermost parts of the cores (Fig. 2). There were also numerous cases where the most negative δ 18O values occurred in granular-ice layers some distance below the surface, often sandwiched between columnar- and granular-ice layers with more positive δ 18O values (e.g. core 2 on floe 253 (Fig 2a) and core 240-1 (Fig. 2c)). In one case (core 5 on floe 253; Fig. 2a), the most negative δ 18O values are in granular ice at the base of a core that is otherwise composed of columnar ice.
The ice thickness distribution represented by the ice-core lengths has three distinct modes: <0.5, 0.5 – 1.0 and > 1.0 m. Average δ 18O profiles for each of these categories show a trend from moderately negative δ 18O values in the surface layers to more positive δ 18O values at the base of the ice (Fig. 3). The highest standard deviation values (e.g. at 0.3 and 0.4 m in the >1.0 m category; Fig. 3c) are due to numerous subsurface layers with more negative δ 18O values.
δ 18O values lower than −6.6‰ occurred in only one core (248 - 4b) which had a single 0.2 m thick layer with a mean δ 18O value of −10.4‰ almost 1 m below the ice surface (Fig. 4). This very negative δ 18O value occurred in granular ice with textural characteristics that were significantly different from all other granular ice: the ice was almost inclusion-free, with polygonal crystals typically 5 – 10 mm, but sometimes as much as 15 mm, across. Structurally and isotopically similar ice was reported in late-summer cores in the Bellingshausen Sea (Reference Jeffries,, Shaw, Morris, Veazey and KrouseJeffries and others, 1994a, figs 3, 4 and 10). Other than this single layer, with its distinctive structural and isotopic signature, core 248-4b is composed of multiple thin layers of columnar and granular ice with isotopic signatures similar to those in all the other cores.
δ18O profile and structure diagram for core 248-4. The legend for the ice types is the same as for Figure 2. POL denotes a layer of large crystals with polygonal outlines and diameters of as much as 15 mm.

3.3 Ice-Core Structural Composition, Layer Thickness and Snow Fractions
3.3.1 Identification of Snow Ice and Frazil Ice
The snow cover and the sea-water samples collected during the cruise had mean δ 18O values of −13.2 ± 3.8‰ (1 s.d.) and −0.9 ± 0.4‰, respectively. The moderately negative δ 18O values in the majority of the ice cores are intermediate between these values, and indicate that snow has been entrained into the ice. In view of the fact that these moderately negative δ 18O values occur primarily in the uppermost layers of the cores (Fig. 3), the δ 18O data suggest that the snow was entrained into the floes by sea-water flooding and snow-ice formation. This is consistent with the observation that negative freeboard values occurred at 35 (56%) of the ice-core sampling sites, and at 18% of the drillholes along the ice thickness transects (Reference Worby,, Weeks, Jeffries, Morris and Jaña.Worby and others, 1994, Reference Worby,, Jeffries, Morris, Weeks and Jaña.1996a).
To identify the snow-ice layers in each core requires stable-isotope data, since it is difficult to differentiate unambiguously between snow ice and frazil ice, as they both have similar granular crystal textures (Reference Lange,, Schlosser, Ackley, Wadhams and Dieckmann.Lange and others, 1990). The isotopic approach also requires that isotopic fractionation be taken into account. The isotopic fractionation that occurs during freezing can be as much as 3‰, i.e., the δ 18O value of the ice can be 3‰ greater than that of the parent water (Reference O’Neil,O’Neil, 1968). However, under natural conditions, the fractionation factor, α, is generally <1.003 because of non-equilibrium processes, the inclusion of liquid within the bulk ice mass, the input and output of water to and from the parent water reservoir, variations in freezing rates, and whether freezing occurs in an open or closed system (Reference Jouzel, and Souchez.Jouzel and Souchez, 1982; Reference Souchez, and JouzelSouchez and jouzel, 1984).
Since we do not know how much isotopic fractionation occurred during the formation of the ice observed in the cores, the amounts of snow ice and frazil ice have been determined according to four different isotopic criteria. Criterion 1 assumes that no isotopic fractionation (α = 1) occurs during freezing, i.e., any granular ice layer with a δ 18O value of <−0.9‰ (the mean δ 18O value of the sea water) is snow ice. Criterion 2 assumes that any granular ice with δ 18O value of <0% is snow ice, an approach taken by other investigators (Reference Lange,, Schlosser, Ackley, Wadhams and Dieckmann.Lange and others 1990; Reference Worby, and MassomWorby and Massom, 1995). Criterion 3 assumes that any granular ice with a δ 18O value of <0.7‰ (the mean δ 18O value of columnar ice) is snow ice. The results of a fourth criterion, i.e. maximum isotopic fractionation (α = 1.003) occurred during freezing, can be dismissed immediately since all the granular ice is identified as snow ice and this is implausible, as it suggests that frazil-ice formation and the pancake cycle did not contribute to the development of the does that formed earlier in the winter, and contradicts our observations of widespread pancake-ice development in the outer regions of the pack ice during the cruise.
The 63 cores that were analyzed for structure and isotopic composition have a total length of 52.08 m. The contributions of frazil ice and snow ice to this total core length for the three isotopic criteria are summarized in Table 1. The premise of criterion 3 is that the columnar-ice mean δ 18O value represents the maximum isotopic fractionation that may have occurred during the formation of columnar and frazil ice observed in the cores. However, since columnar-ice growth is slower than frazil-ice growth, the fractionation factor during columnar-ire growth will be greater than during frazil-ice growth; hence, the amount of frazil ice is probably underestimated. The results of using criterion 4 having been dismissed as implausible, the results of criterion 3 provide a plausible upper limit for the amount of snow ice in the cores. Criterion 1 provides a lower limit for the amount of snow ice.
Amounts of snow ice and frazil ice identified in the late-winter 1993 cores according to three different isotopic criteria. Each value represents the contribution to the total length of core analyzed

All subsequent analysis and discussion is based on the identification of snow ice and frazil ice according to criterion 2, which provides an intermediate value for the amount of snow ice and allows for a small degree of isotopic fractionation (α = 1.0009). It also yields results that can be compared with the results of Studies elsewhere that have used the same criterion. Snow ice identified according to criterion 2 has a mean δ 18O value of −1.7 ± 1.5‰.
3.3.2 Ice Type Amounts and Layer Thickness
As described in section 3.2, some moderately negative δ 18O values were observed in subsurface granular ice layers. According to the δ 18O threshold value of 0‰, all of these layers qualify as snow ice. These “buried” snow-ice layers, which occurred in 15 cores and have a mean δ 18O value of −0.8 ± 0.8‰, are probably a result of rafting (Reference Lange,, Hubberten., Maeno, and HondohLange and Hubberten, 1992). All of the poorly consolidated granular-ice layers (e.g. Fig. 2b) described in section 3.1 have δ 18O values of ≥0‰. Consequently, they were probably composed of frazil-ice crystals that were still in the process of Consolidating to form solid ice rather than being partially formed snow ice. The contributions of columnar ice, fragmented ice and cavities, plus snow ice and frazil ice, to the structural composition of the cores are presented in Table 2. Cavities, although they are not ice, are part of the total ice thickness and thus are included in the calculation of the structural composition of the ice floes. The floes are dominated by granular ice of frazil origin, while the amount of columnar ice only slightly exceeds the amount of granular ice of snow-ice origin.
Contributions (%) of different ice types as a function of the total length of core analyzed in 1992 and 1993 in the Bellingshausen and Amundsen Seas according to case 2 in which all granular-ice layers with a δ18O value of <0 ‰ are considered to be snow ice

The thickness of the many thin layers of granular and columnar ice that make up ice cores in the East Antarctic pack ice and the Bellingshausen/Amundsen Seas has been presented as evidence of the important role of dynamic processes in thickening the ice cover (Reference Worby, and MassomWorby and Massom, 1995; Reference Worby,, Jeffries, Morris, Weeks and Jaña.Worby and others, 1996a). With the aid of stable isotopes we can distinguish between granular snow ice and granular frazil ice, determine their thickness distributions and, using these and the columnar-ice layers’ thickness distribution, better determine the relative roles of both the dynamic and thermodynamic processes that contribute to the development of the pack ice.
The thickness of the surface and buried snow-ice layers in each of the 51 cores in which they occur is illustrated in Figure 5. Snow ice makes up 1 – 100% of these cores. The average amount of snow ice in the set of 63 cores is 24.5 ± 23.3%. The thickness distributions for the surface and buried snow-ice layers are shown in Figure 6a and b; the layer thickness distributions are similar, the majority of values being <0.4 m, and there is no significant difference between the mean values. The thickness distributions for the sub-layers that make up the columnar- and frazil-ice layers are shown in Figure 6c and d. Most values are <0.2 m and the mean layer thickness of the frazil and congelation ice is about 60% of the snow-ice layer thickness.
3.3.3. Fraction of Snow in Snow-Ice Layers and Ice Cores
The isotopic mass-balance model (Equations 1 and (2)) is applied to each granular-ice layer With δ 18O value of <0‰ (i.e. each Snow-ice layer), to obtain the f s value for that layer. The f s values are illustrated in Figure 7, and the mean values vary between 7% and 13%, depending on the choice of snow δ 18O value (Table 3).
Variability of the snow fraction (fs) of surface ( a, c and e) and buried ( b, d and f) snow-ice layers in three different ice thickness categories in 1993. Each triplet of bars represents the fs values for each core calculated using snow δ18O values of −17‰ (left bar), −3.2‰ (centre bar) and 9.4‰ (right bar), i.e. the mean snow δ18O value ± 1 standard deviation, as input to the isotopic model described in section 2.

Mean snow fractions (fs) of the snow ice and their contribution to the snow fraction (Fm) of the late-winter 1993 ice cores as a function of using different snow δ18O values as input to Equations 1 and (2)

The snow fraction of the total core, F m, is calculated according to

where f s is the snow fraction of the snow ice, h i is the thickness of the snow-ice layer, and h c is the core length. The mean F m values vary between 2% and 1%, depending on the choice of snow δ 18O value (Table 3).
Probability density functions and descriptive statistics of the thickness of layers of (a) surface snow ice, (b) buried snow ice, (c) frazil ice in the 1993 cores, and (d) congelation ice in the 1992 and 1993 cores. These data have been derived using a combination of isotopic and crystal-structure criteria to identify the layers of the different ice types.

4. Ice Structure and Oxygen-Isotopic Composition, Summer 1992
4.1. δ 18O Profiles and Surface Ice Layers
The mean δ 18O profile for all the late-winter 1993 cores contrasts sharply with that for the 12 late-summer 1992 cores: while moderately negative δ 18O values occur at the top of the late-winter cores, they are much more positive than those at the top of the late-summer cores (Fig. 8). The very negative δ 18O value at the top of the summer core profile represents the coarse, granular ice with few inclusions and polygonal outlines that was illustrated by Reference Jeffries,, Shaw, Morris, Veazey and KrouseJeffries and others (1994a, figs 3, 4 and 10). This ice was originally interpreted as snow ice, and all the remaining finer-grained granular ice as frazil ice. We now believe this interpretation to be incorrect and propose a new interpretation for the origin of the coarse-grained ice.
The coarse-grained ice with very negative δ 18O values is structurally and isotopically similar to ice of glacial origin that has since been reported in fragments in sub-surface layers of Bellingshausen Sea ice cores (Reference Haas, and Thomas.Haas and Thomas, 1995). However, the coarse-grained ice was observed only at the top of each core at the end of summer 1992, which suggests a different origin than the processes that entrain glacial brash ice (Reference Haas, and Thomas.Haas and Thomas, 1995). As noted in a previous section, the coarse, polygonal, granular ice was observed in only one core in late winter 1993 (Fig. 4). Since then, on three winter cruises throughout the Pacific sector of the Southern Ocean, we have observed such ice only occasionally and only in the outer pack ice after the passage of warm, moist air masses that caused melting of the snow cover. Minor amounts of structurally and isotopically similar ire derived from snow melting have been reported also in the East Antarctic pack ice (Reference Worby, and MassomWorby and Massom, 1995). This ice also strongly resembles the “iced firn” that contributes to the upward growth of the Ward Hunt Ice Shelf in the Canadian high Arctic where the snow cover is rapidly transformed into ice each summer by melting and refreezing (Reference Jeffries, and Weeks.Jeffries, 1985).
We are now convinced that the isotopically very negative, coarse-grained, polygonal ice in the late-summer 1992 cores is superimposed ice that resulted from melting and refreezing of the snow cover. That this should occur in the pack-ice zone in summer is not unreasonable, in view of the fact that it has been observed to form in summer in landfast ice zones at the coastal margin of Antarctica (Reference Panov, and FedotovPanov and Fedotov, 1977; Reference Kawamura,, Ohshima., Ushio and TakizawaKawamura and others, 1993). Superimposed-ice layers occurred at the top of all the late-summer cores and varied in thickness from 2.5 to 20.0 cm. Superimposed ice made a 4.6% contribution to the total length of core examined (Table 1), with an average of 8.1 % in each core. The mean δ 18O value of the superimposed ice is −12.1‰.
The isotopically very negative layer of coarse-grained ice below the surface in core 248-4b (Fig. 4) may be a fragment of glacial ice, as described by Reference Haas, and Thomas.Haas and Thomas (1995). Alternatively, it may be superimposed ice that formed earlier in winter 1993 during a warming event and snow melting, which were followed by further snow accumulation, sea-water flooding and snow-ice formation. The δ 18O values in the granular ice above the superimposed ice are all <0‰ and thus meet the criterion for snow ice. Or, the isotopically very negative layer may be superimposed ice that formed one summer at the ice surface, which was subsequently flooded leading to snow-ice formation. The formation of snow ice upon a summer ice layer would suggest that core 248-4, the longest core obtained during the 1993 cruise, was from a multi-year floe.
4.2. Snow-, Frazil- and Columnar-Ice Amounts and Layer Thickness
The 12 summer cores that were analyzed for structure and isotopic composition have a total length of 22.48 m. After identification of the superimposed ice, the same isotopic criterion that was used in identify snow ice and frazil ice in the winter cores is used to identify those ice types and their amounts in the summer cores, i.e., all granular ice layers with a δ 18O value of <0‰ are snow ice.
Snow-ice layers were found in every core, with an average contribution of 27.6 ± 24.8%, not significantly different from the late-winter value. The mean δ 18O value of the snow ice is −3.6 ± 3.0‰, a sharp contrast to that of the superimposed ice (−12.1 ‰). The mean contribution and δ 18O values of the snow ice are similar to those of the late-winter cores. The amounts of snow ice, frazil ice, columnar ice, fragmented ice and cavities as a function of the total length of core analyzed are summarized in Table 2. The values for all ice types, particularly frazil and columnar ice, are similar to those in the late-winter 1993 cores.
The mean snow-ice layer thickness is 0.28 ± 0.21 m. about 40% thicker than the late-winter snow-ice layers. The distribution of columnar-ice sub-layer thicknesses is shown in Figure 6d; they are about 25% thicker than the late-winter values, but are dominated by values <0.2 m, as occurs in the late-winter cores. No frazil sub-layer thickness data are given, since the 1992 cores were not analyzed to the same level of detail as the 1993 cores.
4.3. Fraction of Snow in Snow-Ice Layers and Ice Cores
Using δSW and δs values of −1.1‰ and −13.5 ± 2.4‰ (−15.9‰, −13.5‰, −11.1‰), respectively, for samples collected in 1992 (Reference Jeffries,, Shaw, Morris, Veazey and KrouseJeffries and others, 1994a), the snow fraction, f s, of the snow-ice layers in the late-summer 1992 cores was calculated. The results, illustrated in Figure 9, show that values vary between 18% and 26% (Table 4), these being a little higher than the winter values (Table 3). The F m values contributed by the snow-ice layers, illustrated in Figure 10a and b, vary between 4% and 5% (Table 4), these being very close to the winter values. Assuming that the superimposed ice has an f s value of 100%, F m values representing the total snow fraction contained in the superimposed-ice and snow-ice layers have been calculated (Fig. 10c and d; Table 4). The superimposed ice roughly triples the snow fraction of the entire ice thickness.
Variability of the snow fraction (fs) of snow-ice layers in two different ice thickness categories in 1992. Each graph has the same vertical scale. An explanation of the triplets of bars is given with Figure 7.

Mean snow fractions (fs) of the snow-ice and superimposed-ice layers and their contribution to the snow fraction (Fm) of the late-summer 1992 ice cores as a function of using different snow δ18O values as input to Equations 1 and (2)

Graphs (a) and (b) illustrate the variability of the snow fractions (fs) illustrated in Figure 9 as a function of the length of each core, i.e. Fm values. Graphs (c) and (d) illustrate the variability of Fm values when the superimposed-ice layer at the top of each core is included in the calculation. Each graph has the same vertical scale. An explanation of the triplets of bars is given with Figure 7.

5. Discussion
5.1 Ice Growth Conditions and Processes
The amounts of frazil and of congelation ice observed in the 1992 and 1993 cores (Table 1) are similar to those observed in other sea-ice zones of the Southern Ocean (Reference Gow,, Ackley, Weeks and Govoni.Gow and others, 1982, Reference Gow,, Ackley, Buck and Golden.1987; Reference Jacka,, Allison, Thwaites and WilsonJacka and others, 1987; Reference Lange,, Ackley, Wadhams, Dieckmann and EickenLange and others, 1989; Reference Jeffries, and Weeks.Jeffries and Weeks, 1992; Reference Allison, and Worby.Allison and Worby, 1994). Much of the frazil ice that forms elsewhere on the Southern Ocean contributes to the “pancake cycle” which plays a key role in the development of the ice cover (Reference Wadhams,, Lange and Ackley.Wadhams and others, 1987; Reference Lange,, Ackley, Wadhams, Dieckmann and EickenLange and others, 1989). Pancake ice and rafting were widespread in the outer parts of the pack ice during the 1993 cruise, and the many thin sub-layers of frazil ice in the cores suggest that pancake formation and rafting played an important role in the development of the ice floes that were studied.
The many thin congelation-ice sub-layers observed in the cores probably resulted from the rafting of nilas and young ice, as occurs elsewhere in Antarctica within a short time of initial ice formation on leads and polynyas (Reference Eicken, and Lange.Eicken and Lange, 1989; Reference Allison, and Worby.Allison and Worby, 1994). In the Weddell Sea, the typical congelation-ice layer thickness in first-year ice is 0.2 – 0.3 m (Reference Lange, and EickenLange and Eicken, 1991b). The congelation-ice layers in the Bellingshausen/Amundsen cores (Fig. 6d) are thinner than those in the Weddell Sea ice, perhaps indicating that they are rafted even sooner after initial formation than those in the Weddell Sea. The frazil- and congelation-ice layers are equally thin (Fig. 6c and d), which suggests that pancakes also do not develop to a significant thickness before being rafted.
The ice-thickness profile of floe 262 (Fig. 2a), with a relatively even top surface and much rougher bottom surface, is typical of most of the floes that were investigated in this study. These characteristics are typical of Antarctic ice floes in general (Reference Lange, and EickenLange and Eicken, 1991a;. Reference Andreas,, Lange, Ackley and WadhamsAndreas and others, 1993) and reflect the role that rafting plays in thickening the ice cover. Core 5, floe 262 (Fig. 2a), with a snow-ice layer at the base rather than the surface of the ice, probably represents a block of ice that was up-ended completely during the deformation of the floe. The “buried snow ice” layers observed in the cores, plus the occurrence of congelation ice layers with their columns tilted to one side, the fragmented ice and the cavities are additional evidence of deformation.
Based on their work in the Weddell Sea, Reference Lange, and EickenLange and Eicken (1991b) concluded that “sea-ice development in Antarctica is dominated by a high degree of rafting and ridging activities”. The Bellingshausen/Amundsen Sea ice cores contain ample evidence that deformation plays an important role in ice development in this region, where the ice growth environment is dynamic and subject to frequent change. We had first-hand experience of these dynamic conditions when a swell propagated through the pack ice continuously between 28 August and 1 September 1993. From the ship’s bridge we estimated the wavelength of the swell to be 400 m and the height to be 2 – 3 m. It completely broke up the consolidated ice cover of large to massive floes into small floes typically 10 – 20 m across separated by newly formed brash and frazil ice (Fig. 11). The swell was often clearly visible on the ship’s radar screen, and subsequently, using ERS-1 synthetic aperture radar images, was found to have a wavelength of 500 m and to have penetrated a distance of 400 km from the ice edge (Reference Morris, and JeffriesMorris and Jeffries, in press). During those 5 d, the average wind speed was 9.0 ms−1 (17.6 knots). The average wind speed during the entire cruise was 9.15 ms −1 (17.8 knots). If such ocean and atmospheric conditions are typical of this region, then it is to be expected that the 1993 cores are as structurally complex as the 1992 cores, which were considered to be evidence that “the sea ice develops by multiple mechanisms in a turbulent environment” (Reference Jeffries,, Shaw, Morris, Veazey and KrouseJeffries and others, 1994a).
View aft from the starboard bridge wing of the R.V. Nathaniel B. Palmer, showing the many small floes and brash/frazil slush that were created as formerly large/massive floes disintegrated under the influence of a swell that propagated through the pack ice of the western Bellingshausen Sea in late August 1993.

The dynamic nature of the ice growth environment and the important role of deformation in ice development in the Amundsen/Bellingshausen Seas was also evident in the ship-based and in situ observations of ice thickness and the distribution of ice during the 1993 cruise (Reference Worby,, Jeffries, Morris, Weeks and Jaña.Worby and others, 1996a). The situation in the Amundsen/Bellingshausen pack ice is probably similar to that in the East Antarctic pack ice, Where a cycle of cold southerly winds and warmer northerly winds over the pack results, respectively, in periods of divergence and new ice growth, followed by periods of convergence, ridge building and deformation (Reference Worby,, Bindoff, Lytle, Allison and Massom.Worby and others, 1996b). A cycle of synoptic systems creating alternating warm and cold conditions is certainly evident in the complex nature of the snow cover throughout the Pacific sector of the Southern Ocean (Reference Jeffries,, Morris, Worby and Weeks.Jeffries and others, 1994c; Reference Sturm,, Morris and Massom.Sturm and others, 1995), and we propose that it also has a significant effect on the ice growth environment and the development of the ice cover. Since the climatology of Southern Hemisphere extratropical cyclones shows that a high density of cyclone systems is common right around the Antarctic coast in all seasons (Reference Jones, and SimmondsJones and Simmonds, 1993), it is likely that the conditions that affect the East Antarctic pack ice are representative of processes that occur throughout the Southern Ocean pack ice.
5.2. Contribution of Snow to Sea-Ice Development
5.2.1. Snow-Ice Formation and Fs Values
The oxygen isotope data for the Bellingshausen/Amundsen cores are in stark contrast to the results of the first investigation of the oxygen isotopic composition of Weddell Sea ice where few negative δ 18O values were observed (Reference Gow,, Ackley, Buck and Golden.Gow and others, 1987). The frequent occurrence of moderately negative δ 18O values in the late-winter Bellingshausen/Amundsen cores is similar to subsequent Weddell Sea (Reference Lange,, Schlosser, Ackley, Wadhams and Dieckmann.Lange and others, 1990; Reference Eicken,, Lange, Hubberten and WadhamsEicken and others, 1994, Reference Eicken,, Fischer and Lemke1995) and East Antarctic pack-ice investigations (Reference Allison, and Worby.Allison and Worby, 1994; Reference Worby, and MassomWorby and Massom, 1995). These moderately negative δ 18O values in the late-winter ice are a consequence of sea-water flooding and snow-ice formation.
Snow-ice formation contributes a smaller amount to the total ice mass than frazil-ice formation, but about the same amount as columnar-ice growth (Table 2). However, the larger quantities of frazil ice and the columnar ice occur in a greater number of thinner sub-layers than the snow-ice layers (Fig. 6). Although the initial formation of the frazil-ice and congelation-ice layers represents thermodynamic thickening, the amount and multiple layering of frazil and congelation ice observed in the cores is primarily the result of dynamic processes, i.e. rafting and ridging. The occurrence of a number of thinner sub-layers in the snow-ice layers indicates that they are built up by multiple flooding events. Each sub-layer of snow ice that is added when the sea-water/snow slush freezes contributes to the thermodynamic thickening of an ice floe. The greater thickness of the snow-ice layers compared to the frazil- and congelation-ice sub-layers indicates that, by late winter, snow-ice formation has made a greater contribution to the thermodynamic thickening of the total ice mass than frazil- and congelation-ice formation.
Depending on the choice of snow δ 18O value used as input in Equations 1 and (2), the stable-isotope data analysis reveals that the late-winter snow-ice layers comprise as much as 13% snow (f s), and the late-summer snow-ice layers as much as 26% snow. Reference Eicken,, Lange, Hubberten and WadhamsEicken and others (1994, Reference Eicken,, Fischer and Lemke1995) reported a similar contrast in f s values between different ages of ice in the Weddell Sea and attributed it to the greater snow load on the older ice and thus an increased probability of flooding and snow-ice formation. This explanation probably also applies to the data from the Bellingshausen/Amundsen region where the late-winter snow had a mean depth of 0.23 m (Reference Worby,, Weeks, Jeffries, Morris and Jaña.Worby and others, 1994) compared to a late-summer mean snow depth of 0.34 m (Reference Jeffries,, Veazey, Morris and Krouse.Jeffries and others, 1994b). This assumes that the same seasonal contrast in snow depth applied prior to the entrainment of snow into the floes and the resultant reduction in snow depth.
The f s values in the Bellinghsausen/Amundsen snow-ice layers are not significantly different from those reported in the Weddell Sea (7 – 11%: Reference Eicken,, Lange, Hubberten and WadhamsEicken and others, 1994, Reference Eicken,, Fischer and Lemke1995).The F m values contributed by the snow ice vary between 2% and 4% in the late-winter ice cores and between 3% and 5% in the late-summer cores. There is no statistically significant seasonal difference in the F m values and they too are very similar to those observed in the Weddell Sea (Reference Lange,, Schlosser, Ackley, Wadhams and Dieckmann.Lange and others, 1990; Reference Eicken,, Lange, Hubberten and WadhamsEicken and others, 1994, Reference Eicken,, Fischer and Lemke1995). However, the mean contribution of snow ice to individual cores (25%) in the Bellingshausen/Amundsen Seas is greater than amounts reported elsewhere; it is over three times that reported in the eastern Weddell Sea in July and August (7%; Reference Lange,, Schlosser, Ackley, Wadhams and Dieckmann.Lange and others, 1990) and greater than most of the average values reported from four cruises in the East Antarctic pack ice in May (9%), October (23% and 30%) and November (19%) (Reference Allison, and Worby.Allison and Worby, 1994; Reference Worby, and MassomWorby and Massom, 1995).
Flooding the ice surface and the base of the snow cover is a prerequisite for snow-ice formation and the entrainment of snow into the floes. The potential for flooding and snow-ice formation increases as the length of the ice growth season increases (Reference Eicken,, Fischer and LemkeEicken and others, 1995) as snow accumulates and its depth increases relative to the ice thickness. The greater amount of snow ice in the Bellingshausen/Amundsen region might, therefore, reflect the later time of sampling and greater amount of snow accumulation compared to the Weddell Sea. Reference Eicken,, Fischer and LemkeEicken and others (1995) also demonstrate that higher snow accumulation rates increase the potential for flooding and snow-ice formation. Current evidence suggests that snow accumulation rates are higher on the west than on the east side of the Antarctic Peninsula (Reference Eicken,, Lange, Hubberten and WadhamsEicken and others, 1994; Reference Jeffries,, Veazey, Morris and Krouse.Jeffries and others, 1994b).
Snow is an effective thermal insulator; consequently, higher snow-accumulation rates increase the ice temperatures, resulting in higher brine volumes, porosity and permeability (Reference Cox, and Weeks.Cox and Weeks, 1975, Reference Cox, and Weeks.1988; Reference Eicken,, Fischer and LemkeEicken and others 1995). When brine volumes exceed 5%, brine pockets coalesce, gravity drainage occurs and, as brine drains out of the ice at the base, it may be replaced by sea water. This brine exchange will bring sea water to the snow/ice interface if the entire ice thickness has brine volumes of >5%, and it will be enhanced by the increased density of the brine that is rejected as snow ice forms at the ice surface (Reference Gloersen,, Campbell, Cavalieri, Comiso, Parkinson and Zwally.Fritsen and others, 1994).
Of the 63 sampling sites investigated in August and September 1993, 52 (82%) had brine volumes of >5% through the entire ice thickness. Of those 52 sites, the entire ice thickness was warmer than −5 ° C at 47 sites. These data indicate that there was considerable potential for flooding by vertical brine exchange. As noted in section 3.3.1, negative freeboard values were common at the ice-core sampling sites and along the ice thickness transects. Some of that flooding may have occurred as a consequence of the ice thermal regime as well as the presence of fractures in the ice. An equally warm ice thermal regime and/or brine volumes maintained at >5% throughout the ice prior to the time of sampling might explain the large amount of snow ice that was observed in the cores.
Snow ice is the major ice component at a number of core sites (Fig. 5). In some cases this is due to rafting and the creation of buried snow-ice layers, e.g. cores 236-1 and 255-1. In other cases, the surface snow-ice layer alone exceeds 50% of, and in one case equals, the core length. This might be a function of the isotopic criterion used to differentiate between snow ice and frazil ice, but it does not completely explain why snow ice preponderates in some cores. For example, (1) core 219-1 is composed of 80% snow ice according to both criteria 1 and 2; and (2) snow ice makes up 100% of core 232-1 according to criterion 2 and remains preponderant (66%) according to criterion 1.
Over half the cores had no basal columnar-ice layer, and the majority of cores had no basal skeletal layer. The general absence of skeletal layers indicates not only that there was no active congelation-ice growth, but that there was actually bottom melting. This would remove both frazil ice and congelation ice, and lead to a relative increase in the snow-ice component and its contribution to the thermodynamic thickening of the ice cover. Furthermore, thinning the ice would effectively increase the snow load and increase the potential for further flooding and snow-ice formation. In time, this “coineyor belt”, in which ice is melted off the bottom and snow ice is added at the Surface, could lead to a situation where snow ice is the major component of the total ice thickness, as has been observed in the Weddell Sea in late winter (personal communication from S. F. Ackley and V. Lytle, 1995).
5.2.2. Superimposed Ice and Fm Values
There are many similarities between the 1992 and 1993 cores, including the multiple layers of ice, the amounts of congelation ice and frazil ice and the significant contribution of snow-ice formation to the thermodynamic development of the ice cover. Some of the differences between the 1992 and 1993 cores, e.g. between the congelation-ice layer thicknesses (Fig. 6) and between the snow fractions of the cores (Tables 3 and 4), may be related to differences in growth conditions. Or, some differences may be seasonal and related to the differences in the relative ages of the ice; as pointed out in section 2, most of the 1992 cores were from first-year floes that had just survived their first summer, while the 1993 floes were only reaching the end of their first winter. The most obvious seasonal difference betwen the 1992 and 1993 cores is the occurrence of superimposed ice in 1992.
Previous studies of the role of the snow cover in the development of Antarctic pack-ice floes have focussed on sea-water flooding and snow-ice formation. The ice structure and isotope data for the summer 1992 cores indicate that the refreezing of freshwater from melting snow also can add a significant amount of snow as superimposed ice at the snow/ice interface. It is reasonable to propose that this occurs in the summer in view of the fact that there is now ample evidence for the occurrence of melting in the snow cover even in winter in the Weddell Sea (Reference Massom,, Drinkwater and HaasMassom and others, in press) and throughout the Pacific sector of the Southern Ocean (Reference Jeffries,, Morris, Worby and Weeks.Jeffries and others, 1994c; Reference Sturm,, Morris and Massom.Sturm and others, 1995). Furthermore, Reference Worby, and MassomWorby and Massom (1995) observed superimposed ice in early winter (April) on first-year ice floes in the East Antarctic pack ice, just as we have observed it in winter in the outer zones of the Pacific sector pack ice, as noted in section 4.1.
Superimposed-ice formation has been reported in East Antarctic landfast ice areas near Mirny (Reference Panov, and FedotovPanov and Fedolov, 1977) and Syowa station (Reference Kawamura,, Ohshima., Ushio and TakizawaKawamura and others, 1993), but not, as far as we are aware, near the Australian stations in the same region. Within the East Antarctic pack ice, the superimposed ice observed in April made a very small contribution (0.3%) to the total ice mass (Reference Worby, and MassomWorby and Massom, 1995). The average amount of superimposed ice in each of the Bellingshausen summer cores (8.1%) is much greater than that reported in the East Antarctic pack ice and essentially the same as the average amount of snow ice reported in the Weddell Sea (7 – 11%: Reference Eicken,, Lange, Hubberten and WadhamsEicken and others, 1994, Reference Eicken,, Fischer and Lemke1995). The formation of superimposed ice increases F m values by a factor of 3 (Table 4) and the proportion of the ice mass formed as a consequence of snow-cover processes to 21% (Table 2).
6. Conclusion
The structure and stable-isotopic composition of late-winter ice cores obtained in the Bellingshausen and Amundsen Seas have been described, and the structure and Stable-isotopic composition of the first set of cores obtained from the Bellingshausen Sea in late summer 1992 have been reassessed. The results indicate that, in terms of frazil- and congelation-ice formation, sea-ice development in this region is similar to that in most other Antarctic sea-ice zones. The main difference between ice development in the Bellings-hausen/Amundsen Seas and other Antarctic sea-ice zones is in the role of sea-water flooding and snow-ice formation. The main findings of the study can be summarized as follows.
1. Frazil-ice and pancake development (44%) makes a greater contribution to the total ice mass than congelation-ice growth (25%), as is observed in most other Antarctic sea-ice zones. Pancakes and congelation ice develop thermodynamically to an average thickness of only 0.12 m before dynamic processes such as rafting and ridging become the main cause of thickening of these ice types in the late-winter ice. The layer thickness values arc generally lower than those found elsewhere in the Antarctic pack ice, perhaps indicating that more dynamic conditions prevailed in the Bellingshausen and Amundsen Seas in austral winter 1993. Since the amount of frazil ice exceeds the amount of congelation ice, it appears that the turbulent conditions that promote frazil-ice formation and pancake-ice development were more common and prolonged than the relatively calm conditions required for congelation-ice growth.
2. Sea-water flooding and the snow cover played a key role in the thermodynamic development of the ice cover in austral winter 1993. This is evident from the quantities of snow-ice (24 – 27% ) that exceed most of those observed elsewhere in the Antarctic pack ice, and the greater thickness of snow-ice layers (mean 0.2 m) compared to those of the frazil- and congelation-ice layers in this region and elsewhere in the Antarctic pack ice. The large amount of snow ice may be due to a number of factors, such as high snow accumulation and a high snow load by the end of winter, the ice thermal regime and its role in promoting brine exchange between the bottom and the surface of the ice, and bottom melting losses being compensated by further snow-ice formation at the surface. These processes entrain moderate amounts of snow into the underlying floes; the snow-ice layers are composed of 7 – 26% snow, which amounts to 4 – 15% of the total ice mass.
3. In summer, the role of the snow cover in the thermodynamic development of the sea ice can extend to the formation of superimposed ice, as meltwater percolating down through the snow cover freezes at the snow/ice inter-face. This process roughly tripled the amount of snow that was added to the underlying ice, and the superimposed ice itself made up almost 5% of the total ice mass in austral summer 1992. Although modest, this is a greater amount than has been reported elsewhere in the Antarctic pack ice and indicates that melting in the snow cover can reach a more advanced stage than has been previously understood to occur.
Acknowledgements
The late-summer and late-winter studies were supported by the U.S. National Science Foundation (NSF) Office of Polar Programs grants 8915863 and 9117721, respectively. C. Fritsen, R. Jaña, R. Nilson, T. Quakenbush and Chuah Teong Sek assisted with ice-core drilling and numerous other aspects of the late-winter research program. Captain J. Borkowski, the officers and crew of the R.V. Nathaniel B. Palmer, and Antarctic Support Associates personnel contributed to the success of the late-winter cruise. NSF, the Australian Antarctic Division and the Antarctic Cooperative Research Centre made it possible for A.P.W to participate in the study. S. Cushing and B. Hurst-Cushing, both Supported by Research Experience for Undergraduates supplements, assisted with data analysis and preparation of figures. We thank Dr H. R. Krouse for the 18O/ 16O measurements made in the Stable Isotope Laboratory, University of Calgary. I. Allison and S. Ackley offered much advice and encouragement during the course of this study, and the anonymous reviewers made a number of useful suggestions that have improved the content and organization of the paper.


