


The passing of the 2000 Agricultural Risk Protection Act (ARPA) included two provisions that were directed to benefit producers in organic and diversified crop systems in the United States. First, the portfolio of crop insurance policies expanded to include organic insurance policies that allowed for organic producers to capture a higher price guarantee than their conventional counterparts. Second, whole farm insurance was originally introduced as Adjusted Gross Revenue (AGR) and later changed to Whole-Farm Revenue Protection (WFRP). Both of these programs offered crop insurance to a group of agricultural producers who, at the time, were relatively underserved with regard to federal crop insurance benefits. Since that time, both products have expanded to include contract marketing prices, new products, higher price guarantees, and increased farm expansion factors. While these products have grown in popularity and experience growth in insurance participation, relatively low participation rates in federal crop insurance among organic and diversified crop producers remain.
Demand for organic food has experienced double-digit growth over the past tenyears, reaching over $50 billion dollars in 2018 (OTA 2018). Organic food products are available nationwide in nearly 20,000 “natural” food stores and in three out of four conventional grocery stores (USDA ERS 2019). Despite significantly higher prices for organic field crops and the potential for greater profitability of organic field crop production, organic field crop farmers are not producing highly demanded products at rates commensurate with opportunities. Current organic field crop farmers seem to be somehow inhibited from supplying increasing demand (Delbridge and King Reference Delbridge and King2018; Delbridge et al. Reference Delbridge, King, Short and James2017). While the number of certified organic farmers has increased annually since the National Organic Program was established in 2001, the number of U.S. organic farmers has not been able to consistently supply the national demand for many organic crops and livestock products.
Delbridge et al. (Reference Delbridge, Fernholz, King and Lazarus2013) provide results that suggest that farm size and cost differences between organic and conventional farms in the upper Midwest do not fully explain the relatively slow growth in organic production. In contrast, Uematsu and Mishra (Reference Uematsu and Mishra2012) use the 2008 Agricultural Resource Management Survey (ARMS) to evaluate the impact of organic certification on farm income and production to find that organic producers earn higher revenues but incur higher production costs, particularly in the areas of labor, marketing, and crop insurance. Other potential reasons for the slow growth in organic production cited by Kuminoff and Wossink (Reference Kuminoff and Wossink2010) include the cost of organic transition and uncertainty about future returns. Another suggestion posited in this research is the degree to which organic production is limited by the availability and use of federally subsidized crop insurance.
The lack of adequate federally subsidized revenue crop insurance for organic diversified and specialty crop farms has been suggested as one important limit to organic production expansion. There has been limited research effort on this issue, but it has been the topic of recent public policy actions (Belasco et al. Reference Belasco, Galinato, Marsh, Miles and Wallace2013; Ligon Reference Ligon2011; Singerman, Hart, and Lence Reference Singerman, Hart and Lence2012). Importantly, this issue was addressed by the U.S. Congress in the passage of the 2014 farm bill.
To implement new U.S. crop insurance programs, the Risk Management Agency is mandated to administer crop insurance products to be rated actuarially fair based on historical loss experience data (Coble et al. Reference Coble, Knight, Goodwin, Miller, Rejesus and Duffield2010). One notable shortcoming of past studies that have evaluated organic crop insurance policies (e.g., Watts and Associates 2010) is that they include only those organic producers who participate in crop insurance programs and also grow conventional products. Adverse selection, which occurs in insurance when the insurance pool is biased toward riskier participants because of asymmetric information, is more likely to occur when participation rates are low. For example, Rothschild and Stiglitz (Reference Rothschild and Stiglitz1976), demonstrate how the high-risk participants in an insurance market are more likely to participate in an insurance market where asymmetric information occurs and the insurance company cannot distinguish between the high- and low-risk groups. Further, Makki and Somwaru (Reference Makki and Somwaru2001) show that this issue can lead to mispricing the high- and low-risk farmers, such that an insurance pool would only exist of low-risk farmers. Clearly, it is important to avoid this selection bias in the present analysis of riskiness regarding organic and conventional farming.
To overcome this potential bias, this study uses a panel of farm-level production and financial data to evaluate the effectiveness of utilizing WFRP insurance in diverse farming operations. Farms were selected in Minnesota that grow two or more products in order to focus on farms that would potentially be good candidates for WFRP. Hypothetical premiums are computed, and the performance of WFRP is computed through actual farm performance figures. Farms are split between those that produce certified organic products and conventional farms in order to examine the relative riskiness between those production systems. This study provides two major contributions. First, this is the first study to evaluate the effectiveness of WFRP by using farm-level data. Second, this is also the first study to evaluate the relative riskiness between organic and conventional farms and their comparative performances within crop insurance utilization by examining all farms and not limiting the analysis to only those that purchase crop insurance. Empirical evidence is provided to support the claim that organic farms appear to be less risky than conventional farms, as measured by lower loss ratios. This finding may provide some insight into the lack of crop insurance participation by organic producers, as lower risk producers tend to have a more elastic demand for crop insurance (Goodwin Reference Goodwin1993).
Data and Methods
Data were collected from the Farm Financial Management Database (FINBIN), which is supported and provided through the Center for Farm Financial Management at the University of Minnesota, and include a panel series of production and financial information for farms across participating states across time. Producers who participate provide actual farm-level data to farm business consultants in order to complete a farm business analysis. Data are provided for 590 Minnesota farms, which includes 51 farms that produce some amount of certified organic production and 539 conventional farms that have no certified organic production. Each farm provides crop-specific details, including acreage planted for each crop, yields, and average price per crop that can be tracked from between five and eight years, which is sufficient to establish a revenue guarantee and an appropriate premium rate under most crop insurance programs. In addition to crop-specific information, farm-level demographic, production, and financial information are provided and are summarized in Table 1.
Hypothetical Insurance Performance Results, by Production Type
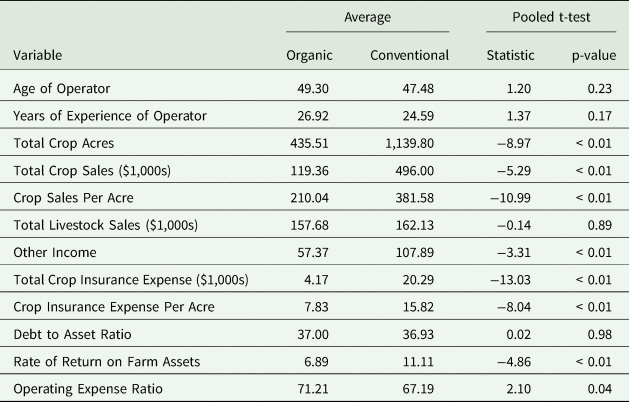
In order to initially examine the relative differences between organic and conventional production systems and their relative performance of crop insurance, it is important to understand the unique differences between the two groups. As shown in Table 1, a pooled t-test is used to show which variables have a statically different mean. Based on that test, we find that organic farms tended to be smaller, in both acreage and sales, had lower crop sales per acre, and had lower off-farm income. Each of these indicators fall in line with past findings that organic farms demand more labor inputs and therefore tend to take place on a lower scale with less off-farm work opportunities (Delbridge et al. Reference Delbridge, Fernholz, King and Lazarus2013; McBride et al. Reference McBride, Greene, Foreman and Ali2015).
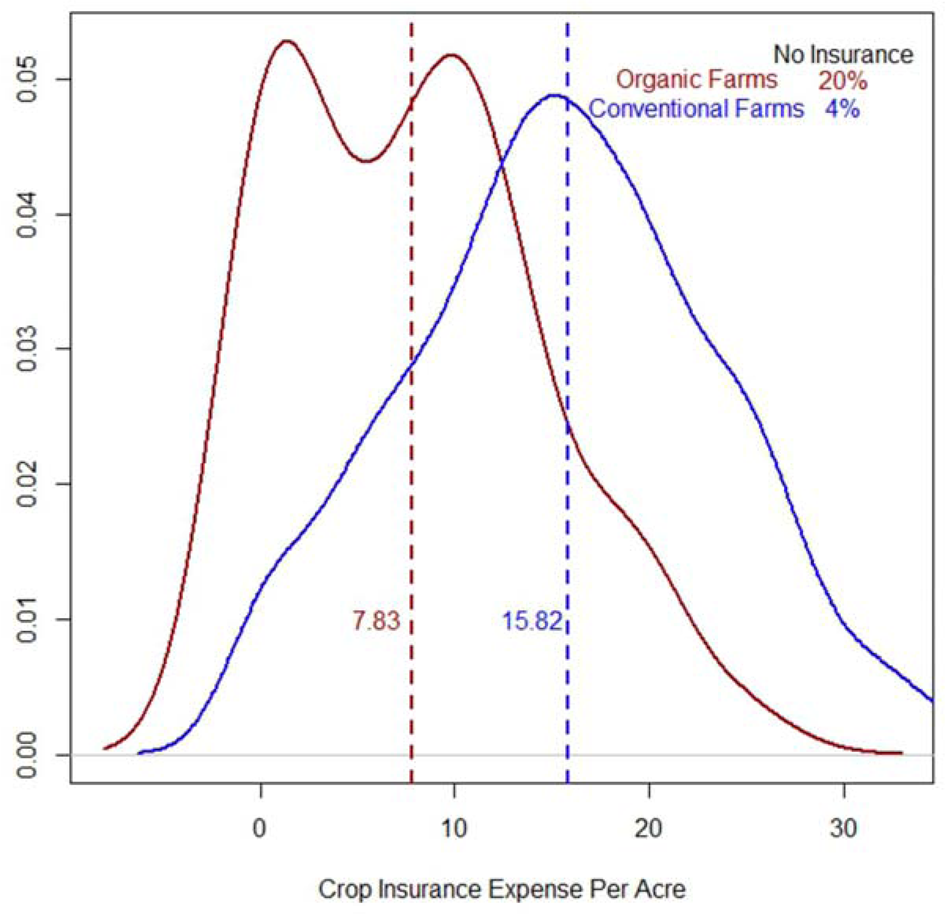
Crop insurance expenses, which include all out-of-pocket expenses for crop insurance (excluding subsidies), are shown to be lower, on a per acre basis, among organic farms. As shown in Figure 1, 20 percent of organic farms did not purchase crop insurance, while only 4 percent of conventional farms did not purchase crop insurance. It is also clear that the mean of the empirical distribution for conventional farms is significantly higher than that of organic farms. Interestingly, debt-to-asset ratios do not appear to be statistically different from one another, even given the differences in scale. Each of these variables indicates the multivariate differences between organic and conventional farms.
Empirical Histogram of Crop Insurance Expense Per Acre, by Production Type
These differences are also demonstrated in Table 2, which demonstrates differences in the share of crop acreage, by commodity. For example, conventional farms devote more than 60 percent of their acreage to corn and soybeans, while another 18 percent is devoted to wheat. These three main commodities comprise 81 percent of the total acreage. For organic farms, the share of these same commodities comprises 49 percent of total acreage. In addition to these commodities, 21 percent is devoted to hay production and eight percent to pasture, while the remainder is spread fairly evenly across other commodities. These differences are likely the result of demands placed on the organic dairy industry for hay and pasture. A Herfindahl Index value was computed for conventional and organic production systems to formally identify the differences in diversification. The Herfindahl Index is computed by summing together the squared percent shares for each commodity. The two boundary conditions, within this context, include 10,000 (indicating monoculture) and 0 (complete diversification). The dramatic drop from 2,464 to 1,422 between conventional and organic production systems indicates a significant increase in the diversification for organic producers.
Percent of Land Devoted to Each Commodity, by Production Type, Average 2006–2013 (n = 590)

Note: Herfindahl Index is computed by summing across the squared percent shares in acres produced. The two boundary values for the Herfindahl Index include 10,000 (monoculture) and 0 (complete diversification).
This panel series allows for an assessment of hypothetical use of crop insurance usage and avoids the problem associated with adverse selection that would be inherent when only those who participate in crop insurance programs are employed. One notable study that compared the crop insurance performance (Watts and Associates 2010) includes only farms with crop insurance, which is a pretty small proportion of organic farms. This study avoids that potential bias in sample selection by simulating the use of crop insurance on existing farm operations. By using this metric, we can compare the use of crop insurance on organic farms to that of their conventional counterparts.
One crop insurance product that is of particular interest is that of Whole-Farm Revenue Protection (WFRP), for a few different reasons. First, since WFRP insures against decreases to gross revenue, it better characterizes farm-level risk than individual crop insurance policies. Second, since many organic production systems have integrated cropping programs with a diverse set of crops and livestock, this likely provides a more accurate assessment of organic agriculture than studies focusing on single-cropping systems. Third, the WFRP has been targeted specifically toward producers who produce a range of crops that are not currently insurable. For these reasons, we use the hypothetical performance of WFRP on organic and conventional farms in order to evaluate their relative riskiness and to evaluate the value of this insurance to those types of cropping systems.
The WFRP program has doubled since its inception in 2015, when 1,128 policies were written to include $1.1 billion in liability. It included 2,537 policies covering $2.7 billion in liability in 2018 (USDA RMA 2019). This growth is particularly notable in places like Minnesota where only two policies were sold in 2015, which has grown to include included 25 policies covering $18 million in liability. Based on data from the Risk Management Agency (RMA), of the total WFRP liability in 2018 for Minnesota insured sugar beets (34 percent), corn (26 percent), soybeans (13 percent), hogs (4 percent), and a range of other crops.Footnote 1 Less than one percent of this liability in Minnesota is devoted to organic crops, which in Minnesota contains only berries and dry beans. Minnesota is also notably diverse in their WFRP policies, where 46 percent of the policies include three crops and 29 percent include four crops, resulting in an average number of 3.6 crops per policy, which is higher than the national average of 3.02 crops per policy.
WFRP is a notable departure from many single-commodity crop insurance policies, including the more popular Revenue Protection and Yield Protection, because WFRP insures total revenue across multiple commodities and encourages diversification through an increasing subsidy and decreased premium rate for farms that are more diverse. Guarantees and actual revenue are established through adjusted gross revenue, as reported in the Schedule F tax form. As with other federal crop insurance products, base rates are estimated by the RMA to achieve a targeted loss ratio of 1.0, where indemnities are equal to total premiums (including farmer-paid premiums and subsidies) (Coble et al. Reference Coble, Knight, Goodwin, Miller, Rejesus and Duffield2010).
In order to compute hypothetical premiums for WFRP in a given year, we collect base rate data from the RMA and derive premiums assuming the following:

where P ic is the premium for individual i and county c. Additionally, CBR ck is the county base rate, which is unique for each combination of county c and commodity k, RevShare is the share of revenue devoted to commodity k for each farm, APH is the average historical revenue and basis for guarantee, EF is the allowable expansion factor, CL is the coverage level selected, and S is the subsidy rate. The allowable expansion factor allows farm guarantees to increase up to 35 percent when proof of expansion is provided. This is particularly notable in this exercise, since Minnesota farms experienced a large amount of expansion in the organic dairy, hay, and corn sectors. Coverage levels are available, as with other crop insurance products, between 50 percent and 85 percent in 5 percent increments. We assume two coverage levels, which include 75 percent and 85 percent coverage levels. The 75 percent coverage level is selected because it has historically been the dominant coverage level selection for WFRP. From 2015 to 2018, 64 percent of all WFRP policies and 60 percent of all WFRP liability has been written under a 75 percent coverage level. The 75 percent coverage level is such a common choice for two reasons: (1) the subsidy rate is 80 percent for all coverage levels between 50 percent to 75 percent, then drops to 71 percent and 56 percent for coverage levels of 80 percent and 85 percent, respectively; (2) 75 percent coverage levels are the maximum coverage level allowable for policies with less than three crops. The 85 percent coverage level is also selected since it is the most commonly selected coverage level for other more popular crop insurance products, including Revenue Protection and Yield Protection.
Table 3 presents the distributional indicators for premium rates per acre and the effective county base rate, which is weighted by the percent of revenue from each crop. These indicators present a higher premium rate per acre and effective county base rate for organic policies, relative to conventional policies. This finding is consistent across the two utilized coverage levels.
Distributional Indicators for Premium Rate Per Acre and Effective County Base Rate, for Organic and Conventional Producers

Note: Effective county base rate is computed based on weighting the crop-specific county base rates and weighting by the percent or expected revenue devoted to each crop.
Premiums (PR) and hypothetical indemnities (I) are provided when the actual revenue (REV) falls below the revenue guarantee (RG), written as
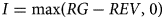
where RG = APH*EF*CL. Hypothetical indemnities and premiums are then added to the actual profits, in order to determine the performance of using WFRP on these operations.
Results
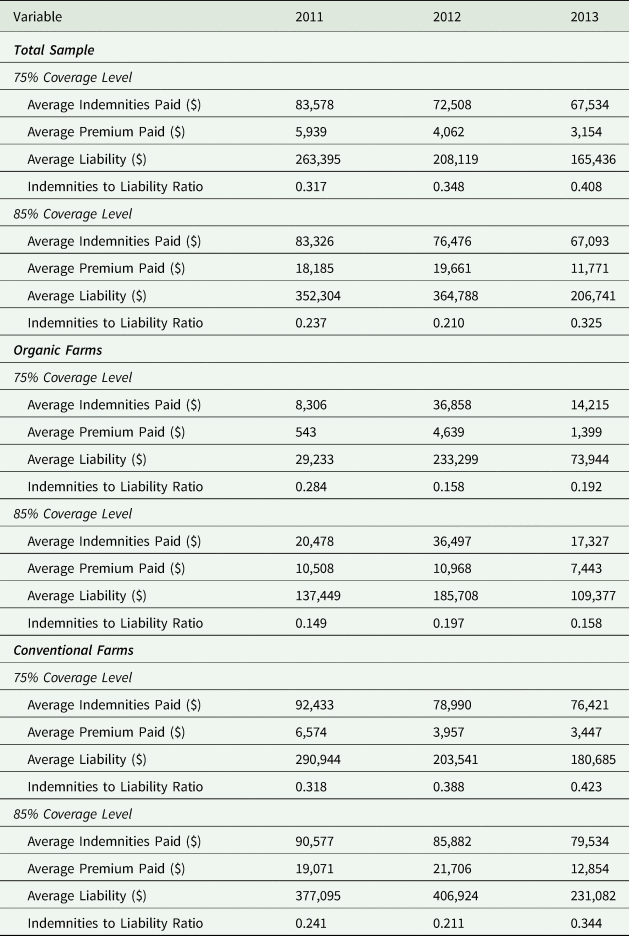
Results from the hypothetical scenario are provided in Table 4 and compare the performance for the total sample, organic farms, and conventional farms for each of the selected coverage levels. Since data from 2002 to 2010 are used to establish a revenue guarantee with the farms, data from 2011 to 2013 are used to evaluate the performance of WFRP. As can be seen in Table 4, some farms dropped out of the survey, as they stopped participating in the program over that time period. That being said, there were 313 farms that participated in all the prediction years. Of those farms, 26 were organic farms, while 287 were conventional farms.
Hypothetical Insurance Performance Results, by Production Type and Coverage Level
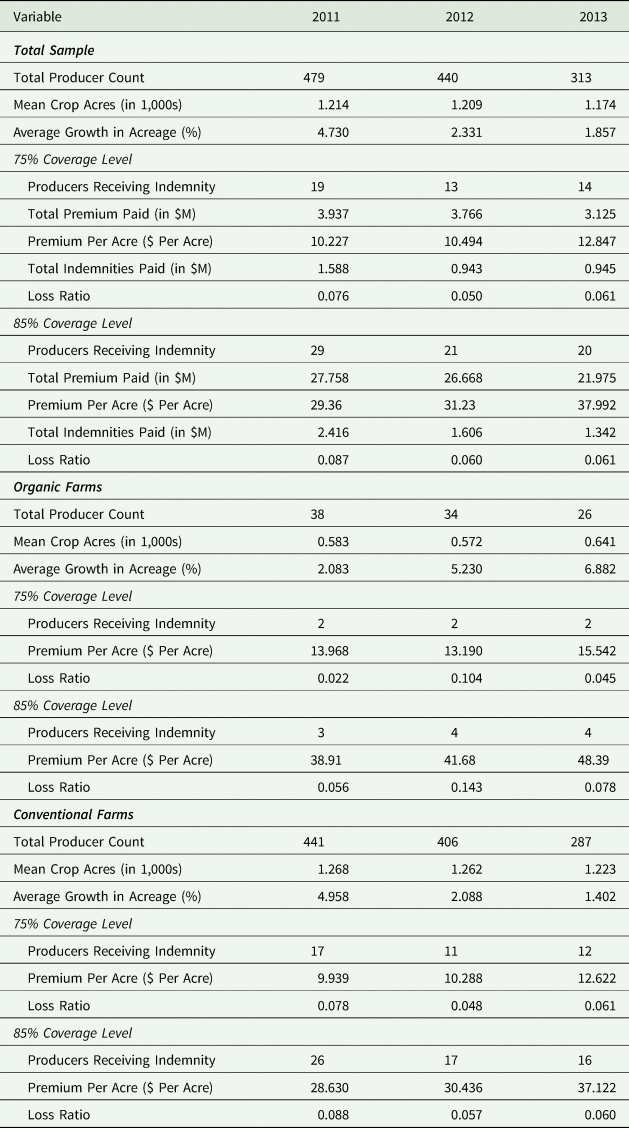
Premiums per acre were about 30 percent higher for organic farms, which is consistent with the premiums organic products receive. While both organic and conventional farms experienced average growth in all years, organic farms experienced an average of 6 percent growth in 2012–2013. Loss ratios remained strikingly low throughout this period. While the Risk Management Agency has a loss ratio target of 1.0 in an effort to ensure programs are actuarially fair, loss ratios during this period were substantially low, which is likely due to the relatively high prices and acreage expansion resulting from growing demand for organic grains throughout Minnesota. For example, in 2011 the loss ratio for all organic farms was 0.022 under a 75 percent coverage level and 0.056 under an 85 percent coverage level. These loss ratios are lower than the loss ratios of 0.078 and 0.088 for conventional farms under the 75 and 85 percent coverage levels. Results are somewhat ambiguous between lower loss ratios belonging to organic or conventional operations.
Table 5 contains indemnity information only for the farms that received indemnities. One notable indicator to determine the amount of losses experienced is the ratio between indemnities to liability. For example, if this indicator is closer to one, it indicates that losses were nearly equal to the full amount of insured liability. If the indicator is closer to zero, then it indicates relatively small indemnities paid relative to the total liability. During times of losses, the amount of losses is found to be quite high for both organic and conventional farms. For the entire sample, the indemnity-to-liability ratio was never lower than 20 percent for those experiencing losses. However, for organic farms, the losses were significantly smaller, as the proportion of hypothetical indemnities in the final two years under the 75 percent coverage level and all years under the 85 percent coverage level were below 20 percent. This may indicate that organic farms are more resilient to deep losses that can arise from extra attention paid to soil quality and other management tactics used to minimize large losses.
Hypothetical Insurance Performance Results for Those Receiving Indemnities, by Production Type and Coverage Level
Implications
These results provide some insights into the ability to utilize Whole-Farm Revenue Protection insurance on diversified operations and compare the usage for organic and conventional production systems. While past studies have utilized crop insurance participation data to compare the performance of organic and conventional production systems, this analysis avoids the contamination of adverse selection and uses a diverse set of producers across Minnesota, utilizing actual production and financial histories.
While WFRP continues to grow, this application investigates its viability within real farms. This data also present a rare opportunity to observe a panel series of farms long enough to establish revenue histories as well as hypothetical performance under the insurance program. Future research regarding crop insurance for products with relatively low participation rates would be more accurate by performing analysis in a way that avoids any potential adverse selection biases, as described in Rothschild and Stiglitz (Reference Rothschild and Stiglitz1976).
One caveat to this research is that the sample is relatively small and limited geographically to Minnesota. Future analysis using data that are more nationally representative, such as the Agricultural Resource Management Survey (ARMS) is recommended. A larger dataset would provide the opportunity to evaluate more general trends in organic and non-organic production risk, though finding a data source that provides a nationally representative production sufficient to establish insurance guarantees is a major challenge.
A second caveat in this study is that it ignores any potential moral hazard that may exist. For example, farmers who purchase insurance have been shown to make different decisions regarding crop production (Mieno, Walters, and Fulginiti Reference Mieno, Walters and Fulginiti2018), use of credit (Ifft, Kuethe, and Morehart Reference Ifft, Kuethe and Morehart2015), and chemical use (Smith and Goodwin Reference Smith and Goodwin1996).
With these caveats in mind, this study acknowledges the difficulty in evaluating organic production risk, particularly in a diverse setting. For this reason, it is argued that using WFRP is likely the most accurate way to examine the revenue risk facing an organic operation, since diversification is a key element of many organic production systems. This study accounts for this difference and, within the context of the caveats discussed, shows that those risks in an organic system are not larger than under a non-organic system.
While the RMA is mandated to rate policies that are actuarially fair and to maintain loss ratios no higher than 1.0, as organic policies expand and more organic farmers participate in crop insurance, these histories are likely to be more accurately reflected through loss ratio analysis. This study provides cautionary advice against using loss ratio analysis as the only tool for evaluating the accuracy and fairness of rating for crop insurance, particularly in areas of low participation.
Acknowledgments
The authors would like to acknowledge the support from Dale Nordquist and the University of Minnesota Center for Farm Financial Management for providing access to the FINBIN database and their insights on this topic, and the participants of the 2019 NC1177: Agricultural and Rural Finance Markets in Transition.
Funding Statement
Funding for this study was provided by grant #2014-51300-22224 from the USDA National Institute of Food and Agriculture.


 Open access