


Study area
The Henryk Arctowski Polish Antarctic Station was built in 1977 on the western coast of Admiralty Bay on King George Island (South Shetland Islands). Along with its surroundings, it has been the subject of many medium- and large-scale cartographic works created using a wide variety of measurement methods. The first, published in 1980, was a topographical map of Admiralty Bay on a 1:25,000 scale (Furmańczyk & Marsz, Reference Furmańczyk and Marsz1980) created using analogue aerial images taken from a helicopter during the 1978/1979 Antarctic summer. Subsequent cartographic studies produced topographical maps on a 1:50,000 scale in 1980 and 1990 (Battke, Reference Battke1980, Reference Battke1990a) using classical topographical measurements. In 2002, a topographical map on a 1:12,500 scale was produced for the Site of Special Scientific Interest No. 8 (SSSI-8) (Pudełko, Reference Pudełko2002, Reference Pudełko2003) based on measurements taken using Global Positioning System (GPS) technology during the 25th Polish Antarctic Expedition (2000/2001). The latest work, published in 2007, is an orthophotomap on a 1:10,000 scale representing the Antarctic Specially Protected Area ‘western shore of Admiralty Bay’ (ASPA No. 128, formerly SSSI-8) (Pudełko, Reference Pudełko2007, Reference Pudełko2008). It was created based on the aerial images collected in 1979 and georeference data obtained via GPS measurements taken during the 31st expedition. Another cartographic study worth mentioning is the complete topographical map of Arctowski Station on a 1:2,500 scale from 1989 (Battke, Reference Battke1990b), although this has never been published.
Here we present the results of measurements taken by the staff of the Faculty of Geodesy and Cartography at Warsaw University of Technology during the 39th Polish Antarctic Expedition in March 2015, commissioned by the Institute of Biochemistry and Biophysics from the Polish Academy of Sciences. The aim of the survey was to deliver data and visualisations to be used in the creation of a plan for conversion of the existing station or construction of a new one. A map on a 1:500 scale and a 3D model of the landscape and buildings of Arctowski Station were created from the collected survey data. These measurements deliver the most detailed and precise visualisations of the Polish station thus far.
This map is on a larger scale than other topographical maps. The scale of this cartographic product qualifies it as a master map, which is a basic map in Poland. Its content is typical of a topographical map, but it provides broader and more detailed information, including local utility networks. Furthermore, since the level of detail is higher on the master map, a different system of graphical symbols is used for cartographic presentation than that used on topographical maps.
Data, methods and results
New geodetic control network in the area surrounding Arctowski Station
A precise two-function geodetic control network was established in the area surrounding the station to enable the survey measurements. The Jasnorzewski Point stabilised on a concrete pillar (Fig. 1) was selected to relate the network to the global coordinate system. This point was previously used for astronomical observations.
Methods for control point stabilisation: Jasnorzewski Point on a concrete pillar (left), ground benchmark mounted on the surface of rock outcrops (top right) and benchmarks with a laser-reflecting tape mounted on the sides of rock outcrops (bottom right) (photographs by M.E. Kowalska and M. Rajner).

The position of the Jasnorzewski Point was determined based on dual-frequency static observations using the Global Navigation Satellite System (GNSS) and registered with a Topcon HiPer Pro receiver at 30 second intervals during a 12 hour period on 14 March 2015. In accordance with the recommendations of the Scientific Committee on Antarctic Research (SCAR), the control network was worked out in the International Terrestrial Reference Frame (ITRF), with the GRS80 (Geodetic Reference System) ellipsoid chosen as the reference surface. Considering the large temporal distance of the recommended implementation of the ITRF2000 system (the 2000.0 epoch), the measurements were adjusted using a newer ITRF2008 system and the positions of the reference station, and were established for the epoch of the mean observation time (the 2015.2 epoch). The observations were adjusted through the AUSPOS Online GPS processing service (http://www.ga.gov.au/bin/gps.pl) in reference to 14 points of the International GNSS Service (IGS) network located in the Antarctic, South America and Australia. The Bernese GPS Software version 5.0, the ephemeris of IGS Rapid Orbit satellites and a 10° mask above the horizon at the observation site were used for processing. Geodetic coordinates of the Jasnorzewski Point (JAS1) were obtained and are shown in Table 1. The coordinates were determined with 6 mm longitudinal and latitudinal errors and a 14 mm vertical error.
Geodetic coordinates and ellipsoidal heights of the points of the geodetic control network.

The control network includes three additional points (GEO2, JAS3 and LAT2) stabilised on rock outcrops with ground markings (Fig. 1) that were used to conduct dual-frequency static GNSS observations in six hour measurement sessions using the same equipment. The observations were processed using Topcon Tools v.8.2 software in relation to the Jasnorzewski Point. The coordinates of these three points were obtained and are shown in Table 1. The coordinates are determined with a 1 mm horizontal error and 2 mm vertical error. To avoid the need to constantly signalise the points of the control network in the form of centred prisms, an additional four control points (GEO1, JAS2, LAT1 and HOT1) were signalised as targets – small round benchmarks with a laser-reflecting tape mounted on the sides of rock outcrops (Fig. 1). Their position was determined based on precise angular and linear observations with a Leica Nova MS50 total station. These observations of all the control points were conducted from four free stations and they created a linear–angular network. Free adjustment of the observations on the X,Y plane was performed using the Pxy software by Waldemar Odziemczyk (Faculty of Geodesy and Cartography, Warsaw University of Technology) relative to the four points determined previously on the cartographic projection plane using GNSS observations. Two projections were applied: the first was the Universal Transverse Mercator (UTM) projection with the central meridian Lo = 57°00′W and a scale factor in the central meridian of mo = 0.9996, and the second was the Gauss-Krüger projection with central meridian Lo = 58°30′W and a scale factor in the central meridian of mo = 1 (referred to as the ARC2015 coordinate system). The obtained mean errors of the X,Y coordinates did not exceed 2 mm. Fig. 2 shows the approximate location of the points of the control network and Table 2 lists the point coordinates in both projections.
Approximate location of the points of the geodetic control network and area covered by the master map on a 1:500 scale (border is shown as a green solid line) with division into sheets (blue rectangles) presented in a fragment of the orthophotomap by R. Pudełko (Reference Pudełko2007).

List of X,Y coordinates of the points of the control network in the UTM projection and the ARC2015 system, and their orthometric heights.
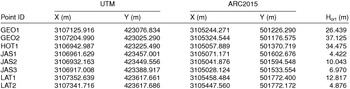
The control network was adjusted in terms of reference level based on long-term observations of sea level conducted at a neighbouring station since 1978, with a benchmark stabilised in a rock outcrop near the lighthouse at Arctowski Station used as a reference point. The orthometric height of this benchmark (3.025 m) was used. This height was determined in relation to the mean sea level in Admiralty Bay, which in turn was determined based on daily recordings of minimum and maximum levels taken between 1998 and 1999 (Battke, Reference Battke2000). The trigonometric levelling method was applied to establish the height of the control network points. The adjustment of the observations was conducted using the Pwm software by Waldemar Odziemczyk. The maximal vertical error was calculated as 2 mm. Table 2 also shows the orthometric heights of the control network points.
Large-scale map
To create the master map on a 1:500 scale, a classical tacheometric survey with a Leica FlexLine TS09 total station and real time kinematic (RTK) satellite measurements, with a Topcon HiPer Pro integrated receivers using own-base transceiver station and radio communication to transmit differential corrections was applied. Fig. 2 shows the area covered by the measurements. The total surface was over 24 ha and over 9,000 points were collected to create the map. Discussions on detailed spatial mapping using GNSS RTK technology for polar regions can be found in the literature (Fauzi, Salazar, Kadzim, Burbano, & Hussin, Reference Fauzi, Salazar, Kadzim, Burbano and Hussin2009; Vieira, Ramos, & Garate, Reference Vieira, Ramos and Garate2000).
The measurements were conducted according to Polish standards for this kind of work. The national system of symbols for the master map on a relevant scale was used for cartographic presentation. Contour lines at 0.5 m intervals were used up to the height of 5 m above mean sea level. Above this height, contour lines at 1.0 m intervals were used because of large height differences and subsequent contour densification.
The vector map was prepared in the GEO-MAP terrain information system by GEO-SYSTEM. Figs 3 and 4 show part of the prepared map and an example of the 3D rendering created in the system, respectively. Final vector maps were created in the AutoCAD DWG format.
Fragment of the master map in the GEO-MAP system.

3D rendering of the master map in the GEO-MAP system.

The map was published on a 1:500 scale in two projections: in the ARC2015 system in Polish, and in the UTM projection in Polish and English (Pasik, Kowalska, Łapiński, & Rajner, Reference Pasik, Kowalska, Łapiński and Rajner2016). The map was drawn in two projections because the UTM projection recommended by SCAR is characterised by a significant linear distortion that is an obstacle to using it for design work. The map in the ARC2015 system was published in colour and in black and white, whereas the maps in the UTM projection were only published in colour. The map, atypical for its type, is divided into 100 cm × 140 cm sheets, each of which corresponds to a 500 m × 700 m area. The map in the ARC2015 system comprises two sheets (Fig. 2). Sheet 1 covers the area surrounding Arctowski Station together with the freshwater reservoir and moss carpet formation known as the Jasnorzewski Gardens. Sheet 2 shows a strip of coastline leading to the petrol station and the surrounding area at the mouth of the Ezcurra Inlet. The maps in the UTM projection comprise only one sheet. The Polish version of the map in the UTM projection can be downloaded from the Arctowski Station website (http://www.arctowski.pl/arctowski/biblioteka/antar_mapki/arctowski_500.pdf). The English version of the map has been added to the SCAR Antarctic map catalogue and can be downloaded at http://data.aad.gov.au/aadc/mapcat/display_map.cfm?map_id=14496. Because the symbol system used in the master map differs from the internationally accepted system for topographical maps, a legend was added to explain the symbols.
3D modelling of the station and its vicinity
To create a 3D model of the station, the exterior of the buildings and the surroundings were measured using a Leica Nova MS50 total station (Fig. 5). The interior of the buildings was measured using a Z+F Imager 5006h terrestrial laser scanner (TLS).
Fragment of point cloud representing the buildings of the station and their surroundings.

Additionally, high-resolution digital images were taken with a Canon EOS5D Mark II camera to enable the creation of the 3D models of the station buildings in colour.
The equipment was chosen based on the working parameters and the weather conditions at the time. The expedition took place towards the end of the summer, which meant that the weather was highly changeable, with frequent rain, strong winds and temperatures as low as −10°C. Measurements in such environmental conditions are extremely challenging (Dawson et al., Reference Dawson, Levy, Oetelaar, Arnold, Lacroix and Mackay2009; Gibb, McCurdy, Farrell, Bathow, & Breuckmann, Reference Gibb, McCurdy, Farrell, Bathow and Breuckmann2011); therefore, special equipment and measurement methods are required (Kenner et al., Reference Kenner, Philips, Danioth, Denier, Thee and Zgraggen2011; Kociuba, Reference Kociuba2014). The Leica Nova MS50 selected for these measurements works in temperatures from −20°C to +50°C. It is not a scanner, but is a total station with a scanning function. It has a scanning rate of up to 1,000 points per second (with a range of up to 300 m) using a visible red laser with a wavelength of 658 nm. The 3D positions of the points are measured with an accuracy of 0.3 mgon in a vertical and horizontal direction and 2 mm + 2 ppm for distance. The Leica Nova MS50 allowed a coloured point cloud to be obtained (owing to a built-in camera with a five megapixel CMOS sensor) and enabled an automatic localisation and orientation of individual point clouds in a uniform external coordinate system with an accuracy of a few millimetres based on angular–linear measurements to the control points of the stabilised network. This solution allowed measurements to be taken during good weather without needing to establish an additional network for the referencing scan, which would be difficult to maintain under changeable conditions. This was one of the methods used to integrate the scanning clouds, namely the known coordinate (KC) method (Kociuba, Reference Kociuba2014), which is also known as the control point method (Kenner et al., Reference Kenner, Philips, Danioth, Denier, Thee and Zgraggen2011). The advantage of this method of referencing is that the measured points already had coordinates in the shared system during the scanning process. Thus, the need for manual integration and transformation of individual scans was avoided. This meant that the method was much more efficient than others, particularly in a cold environment.
The obtained point clouds were registered in the ARC2015 coordinate system. The choice of the shared system for developing the map and scans ensured complementary scanning results with the cartographic visualisations. The definition method of the ARC2015 system was also not accidental. The aim of developing scanning without changing the scale naturally led to choosing a system based on a Gauss-Krüger projection with a central meridian in the vicinity of the measured area as the ARC2015 system.
The selection of the Z+F Imager 5006h TLS for scanning the building interiors was motivated by the high efficiency of the device, which, taking into account the high level of detail of the interiors and the relatively short time available for measurements, enabled the task to be completed. This scanner works at temperatures from −10°C to +45°C and registers scans with a velocity of up to 1 million points per second (with a range of up to 79 m).
The obtained point clouds can be used to create 3D models of buildings (Dawson et al., Reference Dawson, Bertulli, Levy, Tucker, Dick and Cousins2013; Gibb et al., Reference Gibb, McCurdy, Farrell, Bathow and Breuckmann2011), projections of elevations, horizontal and vertical cross-sections of the buildings and digital elevation models of the station surroundings with a much greater precision than that obtained through measurements involving tacheometric surveys and the RTK technique.
Multi-sourced elevation data were used to generate digital landscape models of Arctowski Station. Over 27 million points with TLS data and over 9 thousand tacheometric and GNSS RTK points were used to generate two digital elevation models: the digital surface model (DSM) and digital terrain model (DTM). The spatial distribution of TLS points and the density of the point cloud were not homogenous. The density ranged from one to a few thousand points per square metre (Fig. 6). The highest density is seen near the scanner positions and in overlaps of point clouds. There are also places where no TLS points were collected. This was due to the flat area near the station and water on the planar surface around the station, which led to a reduction of the scanner's range or made measurements impossible. The GNSS RTK and tacheometry data were used to fill in the gaps in elevation data. The combinations of the TLS and other methods, such as aerial photogrammetry (Bitelli, Dubbini, & Zanutta, Reference Bitelli, Dubbini and Zanutta2004) and airborne laser scanning (Bremer & Sass, Reference Bremer and Sass2012), have already been used successfully to create digital elevation models in cold climate environments.
The density of point clouds from TLS data (in points per square metre) and the location of complementary GNSS RTK and tacheometric survey data (black dots).

To generate the DSM, low points, which are classified as gross errors from the TLS, were automatically filtered out using the Trimble Inpho software. The results of the DSM created for Arctowski Station in ArcGIS by Esri is presented in Fig. 7. For this area, a DTM was also generated after manual filtering of points over the ground. To verify the correctness of the DTM, in areas where it was based solely on the TLS data, the heights that were interpolated from the elevation model were compared to those from GNSS RTK and tacheometric measurements. The average height difference was 0.03 m and root mean square (RMS) was 0.05 m. The height differences are mostly due to the much lower accuracy of the GNSS RTK technology in relation to the TLS method. These differences are at the level of the accuracy of GNSS RTK measurements. The resolution of elevation models is 0.2 m. Such a high resolution is justified only in places where coverage of the TLS points can be noticed. To unify these products for the study area, this resolution was selected for the whole DTM.
DSM of the vicinity of Arctowski Station generated from integrating TLS and combining GNSS RTK and tacheometry methods.

The potential of a DTM with such a high spatial resolution is particularly visible in the hillshade representation of the elevation model. Fig. 8 presents the 3D rendering of the hillshade DSM with fragments generated from TLS data in contrast to those where GNSS RTK and tacheometry measurements were the main elevation data source where TLS data were very sparse or lacking. On one hand, this figure shows the potential of modern surveying data, but it also exposes the problem of the low-resolution point density and its impact on the less detailed information in the DTM. There is no doubt that the elevation model is essential for the modernisation and development of Arctowski Station, but it can also be a source of information for professionals from other fields such as geomorphologists and geologists (Kociuba, Reference Kociuba2014; Kociuba, Reference Kociuba2015; Kociuba, Kubisz, & Zagórski, Reference Kociuba, Kubisz and Zagórski2014).
3D rendering of the hillshade DSM with two fragments of the model from the TLS data (top) and from GNSS RTK (bottom).

Coastline changes near Arctowski Station
Interesting information on coastline changes was obtained by recording the position of the sea at high and low tides as part of the measurements performed in the vicinity of the station. Measurements of the coastline were taken on 22 March 2015 at 12:00 UTC for high tide and on 26 March 2015 at 9:00 UTC for low tide. The mean elevation values for the survey points during these extreme water levels were 1.14 m and −0.52 m, respectively. Thus, the largest tide range registered at the station during the study amounted to about 1.7 m. Due to the duration of the measurements and surface waves on the sea, the maximum differences between the elevations of the lines representing these levels amounted to 0.3 m in relation to the aforementioned means. The times when the extreme water levels occurred were established based on tide forecasts available at http://tides.mobilegeographics.com/locations/44.html. For safety reasons, extreme water levels were only measured when they occurred in the daylight.
Owing to the precision of visualisation stemming from the scale, a map on a 1:2,500 scale from 1990 by Battke (Reference Battke1990b) was compared with a map on a 1:500 scale described in this paper representing the current state of the coastline to analyse changes. Because of the differences in scale, reference ellipsoids and projections, the map by Battke was transformed using constant characteristic points presented on both maps. Fig. 9 shows part of the coastline comparison at different sea levels. This comparison confirms changes that have occurred over the last 25 years.
Coastline in 1988/1989 and 2015. HL 2015, highest tide in March 2015; LL 2015, lowest tide in March 2015; MHL 2014–2015, estimated mean high tide level for 2014–2015; MHL 1988–1989, mean high tide level in 1988/1989.

Differences in the data presented on the maps makes interpretation of any changes in the coastline difficult. The map from 1990 shows the mean low tide level and the mean high tide level calculated from the daily low tides and daily high tides, respectively, between 7 January 1988 and 8 February 1989. The short time over which the measurements were taken in March 2015 (11–31 March 2015) prevented a similar analysis from being undertaken, and only the highest and lowest water levels for this period were recorded. Thus, the coastlines presented on the maps are ambiguous. From the perspective of assessing coastline changes, the high tide level is most important. Consequently, an attempt was made to remove the ambiguity by determining the mean high tide level for 2015 based on archival tide forecasts between 22 March 2014 and 22 March 2015. Data analysis showed the high tide level forecast for 22 March 2015 was about 0.23 m higher than the mean high tide level from the year before. Therefore, the mean high tide level can be estimated at approximately 0.90 m. A coastline corresponding to this level was reconstructed based on the DTM created during the making of the map. As a result, the coastline moved backwards by a maximum of 2–3 m compared with the high tide recorded in March 2015.
The coastlines shown in Fig. 9 corresponding to the mean high tide levels from 1988/1989 and 2014/2015 indicate a significant recession of the land. The clearest recession of the coastline in the area, amounting to about 30 m, was found in the central part of Arctowski Cove, where the station is located. This translates into a threat to the main building, dubbed ‘the Airplane’ because of its shape, which is only 6 m from the coastline at high tide. Assuming that progression is consistent, the erosion of the coastline at this site is occurring at a rate of about 1 m per year. Thus, the building may be damaged or destroyed within the next several years. Furthermore, taking into account that the surrounding terrain is only 1 m above sea level at high tide, the building already falls within the threat zone during extreme weather conditions (strong winds or storms), which, in fact, was the motivation for conducting the survey described in this paper.
The reasons for the coastline changes lie in the abrasive activity of the sea, as has been previously established for the western coast of Admiralty Bay in a study of King George Island (Battke, Marsz, & Pudełko, Reference Battke, Marsz and Pudełko2001). Further research on the subject requires continuous monitoring of the sea level together with regular observations of the coastline.
Conclusions
The creation of a master map on a 1:500 scale and a 3D model of Arctowski Station will enable planning for the conversion of the existing station or construction of a new one. The established geodetic control network will not only enable potential construction work in the area, but also constitutes a starting point for any geodetic works and interdisciplinary research that needs to be tied to global spatial reference systems. The analysis of changes in the coastline presented here confirms that the sea poses a direct threat to the main building of the station and that action should be undertaken to convert the station. It should be emphasised that at the current rate of coastal erosion other areas of the station, for example, the laboratory, the meteorology building and the freshwater reservoir, may also be under threat within the next decade. The high compliance of the digital elevation models created based on TLS and GNSS data confirms their usefulness in modelling the topography in a cold climate environment. Undoubtedly, the data presented here provides important information for the future development of Arctowski Station and for future research projects that will be conducted in the region.
Acknowledgements
The data used in the paper were collected during our stay at Henryk Arctowski Polish Antarctic Station. Thanks are due to the station host, the Institute of Biochemistry and Biophysics of the Polish Academy of Sciences. We wish to heartily thank Zbigniew Battke for providing his private material from his years of research at Arctowski Station. We also wish to thank Leica Geosystems for lending us the measurement equipment used during the research described in this paper.
Financial support
This research received no specific grant from any funding agency or from commercial not-for-profit sectors. The publication is partly financed by the statutory funds of the Faculty of Geodesy and Cartography Warsaw University of Technology
Conflict of interest
None.



