


Introduction
Oxidation zones form at the interface between hypogene, usually sulfidic ores and the oxidised portion of the pedosphere and bedrock (Williams, Reference Williams1990). The formation of the oxidation zones is controlled by a complex suite of inorganic and biogenic reactions that convert the primary minerals into the secondary phases.
Weathering of sulfide minerals was investigated extensively (Koski et al., Reference Koski, Munk, Foster, Shanks and Stillings2008; Lindsay et al., Reference Lindsay, Moncur, Bain, Jambor, Ptacek and Blowes2015; Courtin-Nomade et al., Reference Courtin-Nomade, Grosbois, Marcus, Fakra, Beny and Foster2009). Many of the weathering reactions proceed inorganically, even though they may be modified by biological activity. Among the common sulfides, pyrrhotite tends to oxidise and decompose faster than chalcopyrite or pyrite. These minerals can supply metals (Fe, Cu) into the aqueous solution, develop acidity and mobilise additional metals (e.g. Pb, Zn) or metalloids (e.g. As, Sb) into the solutions (Rodríguez-Galán et al., Reference Rodríguez-Galán, Baena-Moreno, Vázquez, Arroyo-Torralvo, Vilches and Zhang2019). Carbonate minerals, if present, are able to buffer the acidity and contribute to the formation of neutral mine drainage (Marmier et al., Reference Marmier, Plante, Demers and Benzaazoua2025). In chalcopyrite, weathering reactions commence at the surface of the minerals (de Lima et al., Reference de Lima, Duarte and Pettersson2018), proceed along fractures to produce secondary Cu sulfides (Hatert, Reference Hatert2005) and terminate with replacement of the sulfide by Fe oxides, mostly goethite (Koski et al., Reference Koski, Munk, Foster, Shanks and Stillings2008). There is an interplay between the redox chemistry of Cu and Fe in aqueous solution (González et al., Reference González, Pérez-Almeida, Santana-Casiano, Millero and González-Dávila2016) with inorganic acceleration of Fe oxidation. Iron and Mn precipitate as Fe and Mn oxides that uptake anions (e.g. phosphate and arsenate) and cations (e.g. Ba and Co), respectively and control the elemental mobility in oxidation zones and waste piles. If the adsorption capacity of Fe and Mn oxides is exceeded, phosphate and arsenate can form separate minerals, e.g. libethenite or olivenite.
In currently weathering material, a biological contribution has been well documented. Common examples include acceleration of weathering of pyrite or pyrrhotite (Jambor et al., Reference Jambor, Nordstrom and Alpers2000; Nordstrom et al., Reference Nordstrom, Alpers, Ptacek and Blowes2000) or oxidation of manganese (Tebo et al., Reference Tebo, Bargar, Clement, Dick, Murray, Parker, Verity and Webb2004) to form copious masses of Fe and Mn oxides. In fossil oxidation zones, however, such a contribution is not so clear although it must be assumed that it existed. Herein lies the questions addressed in this work. It is also known that biological activity can supply some of the elements for the secondary minerals in the oxidation zones. For example, carbon can be sourced from the soil profiles above the oxidation zones (Melchiorre et al., Reference Melchiorre, Criss and Rose1999; Melchiore, Reference Melchiorre2022) to form carbonates. Phosphate may be supplied into the oxidation products to produce minerals such as pyromorphite (Burmann et al., Reference Burmann, Keim, Oelmann, Teiber, Marks and Markl2013). Biominerals may precipitate simply because the organisms change physico-chemical conditions of their environment (e.g. pH or Eh) or they attempt to de-toxify their surroundings. Doing so, they may induce precipitation of secondary minerals of zinc (Podda et al., Reference Podda, Medas, De Giudici, Ryszka, Wolowski and Turnau2014), arsenic (Drahota et al., Reference Drahota, Mikutta, Falteisek, Duchoslav and Klementová2017) or uranium (Wufuer et al., Reference Wufuer, Wei, Lin, Wang, Song, Liu, Zhang, Pan and Gadd2017). Some oxidation zones worldwide have been shown to be created by low-temperature hydrothermal fluids (Berni et al., Reference Berni, Heinrich, Wälle and Wall2019) and the secondary minerals may form from gelatinous precursors (Lambiel et al., Reference Lambiel, Dold, Spangenberg and Fontboté2023) or follow a complex evolution path in the pH-Eh space (Poot et al., Reference Poot, Buelens, Dekoninck, Rochez and Yans2024).
There are four deposits with rich oxidation zones in the Tatric and Veporic units in central Slovakia. They are the localities Ľubietová-Podlipa, Ľubietová-Svätodušná, Poniky-Farbište and Špania Dolina-Piesky (Table 1) (named after the village and the site; hereafter, we will use mostly the names of the sites). All other ore deposits and occurrences (Fig. 1) in this area, on the other hand, have diminutive and poorly developed oxidation zones. This difference holds, irrespective of the primary mineralogy, even for occurrences with essentially identical primary minerals as in Podlipa, Svätodušná, Farbište and Piesky.
Geological map of part of central Slovakia, with the positions of the four rich oxidation zones and other sites that have no or negligible oxidation zone developed. The geological map is simplified after Lexa et al. (Reference Lexa, Bezák, Elečko, Mello, Polák and Potfaj2000). The positions of the ore deposits and occurrences are taken from http://apl.geology.sk/geofond/sbd/. The sites discussed in this work are highlighted by red circles and numbered: 1 – Ľubietová-Podlipa, 2 – Ľubietová-Svätodušná, 3 – Poniky-Farbište, 4 – Špania Dolina-Piesky. The inset of the right-hand side of the figure shows the position of the geological map within the Slovak Republic.

Overview of the locations and mineralogy of the ore deposits with the rich oxidation zones in the Tatric and Veporic units of the Western Carpathians. The positions of these sites relative to the geological units is shown in Fig. 1

In this work, we addressed the questions of biological vs. geological contribution to the oxidation zones, with focus on the oxidation zone in Podlipa. We investigated this site specifically because the underground spaces there are accessible, allowing for in situ sampling and understanding of the relationships among the minerals. At the other sites, only samples from dumps can be collected, offering limited information. At Podlipa, field observations and multiple analytical techniques, including stable-isotope measurements and radiometric age determination, were employed to appraise the aspects of geological history and geochemical contribution. We assess the biological contribution based on the evaluation of isotopic (O, C) systems even though the organisms responsible for these signals have long vanished.
The secondary mineralogy in the oxidation zones is correlated to the chemistry of the primary minerals and competition with the biological input. The contributions were separated in terms of formation and in terms of preservation of the oxidation zones. We also seek the reasons why the four oxidation zones are so unusually rich whereas hundreds of similar sites in this region have negligible or no oxidation zones at all.
Geological evolution of the study area
The area studied is a part of the Central Western Carpathians (CWC), a complicated system of thick- and thin-skinned thrust sheets the assembly of which was finalised during the Cretaceous (Plašienka, Reference Plašienka2018). The thick-skinned sheets include the Variscan basement and its sedimentary cover (if not removed by erosion); the thin-skinned sheets consist only of the sedimentary rocks, mostly of Permian to Cretaceous age. Of the three thick-skinned sheets in CWC, only the Tatric and Veporic units are present in the study area. Most of the ore deposits and ore occurrences in the study area (Fig. 1) are hosted by the Variscan basement of the Tatric and Veporic units (Chovan et al., Reference Chovan, Slavkay and Michálek1996). The basement consists of voluminous Devonian–Carboniferous granitoid rocks (Kohút and Larionov, Reference Kohút and Larionov2021) and high-grade metamorphic rocks (Kohút et al., Reference Kohút, Anczkiewicz and Boczkowska2023; Kriváňová et al., Reference Kriváňová, Vojtko, Droppa and Gerátová2023). The Veporic Variscan rocks experienced strong retrograde Alpine metamorphism (Jeřábek et al., Reference Jeřábek, Lexa, Schulmann and Plašienka2012); the Tatric Variscan rocks underwent little or no Alpine metamorphism (Danišík et al., Reference Danišík, Kadlec, Glotzbach, Weisheit, Dunkl, Kohút, Evans, Orvošová and McDonald2011; Plašienka, Reference Plašienka2018). Some of the ore mineralisations considered here are hosted by the Late Palaeozoic volcanic rocks (Ondrejka et al., Reference Ondrejka, Vojtko, Putiš, Chew, Olšavský, Uher, Nemec, Drakou, Molnárová and Spišiak2022) or sediments of the Fatric unit (Fig. 1). These sediments could have been the sedimentary cover of the Veporic unit or could have originated in a basin between the Tatric and the Veporic unit (Plašienka, Reference Plašienka2018). The higher nappes, represented by the Hronic and Silicic units (Fig. 1), rarely host ore mineralisations.
To understand the formation and evolution of the oxidation zones, the youngest geological history of the area is of greater interest. The Veporic unit is in the area shown in Fig. 1 represented by its northernmost portion. Even though the northern and southern parts of the Veporic unit experienced significantly different Alpine metamorphism (Jeřábek et al., Reference Jeřábek, Lexa, Schulmann and Plašienka2012), their youngest evolution was convergent. In this description, we therefore refer primarily to the work of Vojtko et al. (Reference Vojtko, Králiková, Andriessen, Prokešová, Minár and Jeřábek2017) even though this work was done in the southern part of the Veporic unit. The Veporic unit experienced slow Eocene and Oligocene cooling down to 60°C. The cooling was related to the last stages of exhumation and erosion of the cover nappes. The erosion was responsible for the first planation of the surface and deep weathering associated with kaolinisation in the Eocene. In the Oligocene, the Veporic units were covered temporarily by thin sedimentary cover (Pulec, Reference Pulec1966). The second planation took place in the Miocene, in the times of tectonic quiescence. It was also accompanied by development of lateritic profiles and intensive kaolinisation of the granitic rocks (Kraus, Reference Kraus1989). The tectonic stability during the Early Miocene was replaced by lithospheric stretching during the Middle Miocene and the formation of several large stratovolcanoes (Konečný et al., Reference Konečný, Konečný, Kubeš and Pécskay2015a, Reference Konečný, Konečný, Kubeš and Pécskay2015b). Subsequent erosion removed a large proportion of the volcanoes; some are only discernible from their final remnants. The last, subordinate period of kaolinisation followed (Gaál, Reference Gaál2008). During the Pontian to Pliocene (∼6–3 Ma), the last period of weathering and tectonic quiescence was replaced by exhumation, resulting in erosion of some of the kaolin crusts. This time was marked by accelerated tectonic activity.
In the area shown in Fig. 1, the Tatric unit coincides with a mountain range called Nízke Tatry Mountains (NTM). The crystalline basement of NTM experienced a rapid cooling event during the Eocene, between 50 and 40 Ma (Danišík et al., Reference Danišík, Kadlec, Glotzbach, Weisheit, Dunkl, Kohút, Evans, Orvošová and McDonald2011). The evolution thereafter is difficult to track because of the limited sedimentary record. Younger sediments are located in a basin north of the NTM. There are varied views on the position of the crystalline basement of the NTM up to ∼28 Ma. Gross (Reference Gross2008) suggested that the basement was exposed and eroded during this period whereas Kázmér et al. (Reference Kázmér, Dunkl, Frisch, Kuhlemann and Ozsvárt2003) proposed that the basement was covered by a thick pile of Paleogene sediments. The lack of Neogene sediments is explained by a scenario in which the basement of the NTM was not affected by the Neogene transgression (Kováč, Reference Kováč2000) and no reheating induced by burial occurred. On the other hand, thermal modelling provided evidence for a Miocene regional thermal event (Danišík et al., Reference Danišík, Kohút, Dunkl and Frisch2008). This result agrees with the dating of the last remobilisation of hydrothermal carbonates in NTM to the Paleogene/Neogene boundary (Majzlan et al., Reference Majzlan, Chovan, Kiefer, Gerdes, Kohút, Siman, Konečný, Števko, Finger, Waitzinger, Biroň, Luptáková, Ackerman and Hora2020). Afterwards, the crystalline basement of NTM cooled to the surface temperatures due to continuous uplift.
Materials
Samples for this study were taken in the abandoned underground spaces in the western part of the Podlipa ore field (locally called the Rainer field, 48.74748°N, 19.38497°E) (Table 1, Figs 1, 2, Supplementary Fig. S1), from the outcrops in the vicinity of that mine and from the historical dumps. The ore mineralisation there was exploited by several adits, connected underground by a network of stopes and declines. Many stopes are still accessible, which gave us a unique opportunity to sample the oxidation zone. GPS coordinates for all samples are listed in Table S1 in the supplementary information file.
Detailed geological map of the vicinity of the village of Ľubietová, including the locations of the Podlipa and Svätodušná sites.

Forty five grab samples (L-1 through L-45) with precise locations within the ore body were collected and their locations marked in the mine map (Fig. S1). In addition, 34 samples (labelled L-100 through L-168, Fig. S1) were collected from the loose rocks in the mine at places where the remaining oxidation zone is particularly rich in Cu minerals. Two channel samples (L-51, L-52, Fig. S1) were taken from the upper portion of the ore body. Both channel samples were ∼2 m long and consisted of 25 and 37 kg of material, respectively. Large (20–30 kg) rock samples (L-46 to L-50, L-53, L-54, Table S1) were taken from outcrops in the vicinity of the mine but sufficiently far away so that they contained no ore mineralisation. A few (eight samples, L-71 through L-78) were collected during the many field work campaigns from the dumps that contain the material excavated from the underground space samples in this work (Table S1). Some samples were split during separation into subsamples and were additionally labelled by a capital letter (e.g. L-4 was split into L-4A and L-4B). Some analyses were carried out in duplicates or in repeated runs. Those analyses were marked by a sample name with a lowercase letter suffix (e.g. separates from L-32 are labelled L-32a and L-32b).
Underground surveying was done using a Leica DistoX1 laser distance meter, 3-axis compass and clinometer combined with PDA (Nautiz X8) equipped with PocketTopo application software. Horizontal and lateral projections of the mine with marked sampling locations are shown in Fig. S1.
Methods
The channel (L-51, L-52) and rock (L-46 to L-50) samples were crushed, ground, sieved and homogenised. A representative portion of the resulting powders was separated by quartering and analysed by X-ray fluorescence spectrometry (XRF, University of Jena, Germany; Table 2). 4 g of each sample was mixed with 1 g of wax and pressed into a pellet with a hydraulic press (PW E30) at a force of 294 kN. The pellets were allowed to dry at 45°C for 24 h. Afterwards, the pellets were analysed with a Philips (PW 2404) XRF instrument equipped with a Rh anode and a wavelength-dispersive detector. The instrument was calibrated with an XRF standard JB-3. Repeated measurement on one sample (L-49) showed precision of better than 0.02%. Measurement of another certified standard material (BM) documented accuracy of <0.25% for all oxides except for SiO2; for SiO2, the measurement reproduced the certified value within 0.63%.
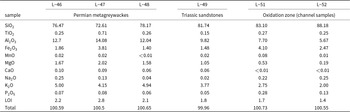
Concentrations of major oxide components and loss on ignition (LOI) for the unmineralised metagreywackes (L-46, L-47, L-48), Triassic sandstones (L-49) and channel samples from the oxidation zone from Podlipa. All values in wt.%. With the exception of LOI, all values were determined by X-ray fluorescence spectrometry. SO3 in all of the analyses is below detection limit (<0.002%)

The rock samples L-53 and L-54 were used for the extraction of apatite crystals. A portion of 10 kg from each sample was crushed and ground to a <1.0 mm fraction. This material was divided into fractions of 0.06–0.08, 0.08–0.15, 0.15–0.30 and 0.30–0.50 mm by sieving. Magnetic minerals were removed using an electromagnetic separator and the remaining material was subjected to gravity separation in bromoform (density 2.85 g/cm3). Afterwards, the heavy fraction was further divided manually by washing in a Petri dish. Apatite crystals were selected visually, based on their morphology, under a binocular microscope.
Grab samples from the mine (Fig. S1) and from the dumps were inspected visually for secondary and primary mineralisation. Minerals or mineral aggregates were separated from the samples and cleaned under the binocular microscope. All grab samples, be they from the mine or from the dumps, were sawn, ground and polished to prepare thin or polished sections for a detailed investigation in transmitted or reflected polarised light. Selected sections were coated with carbon and analysed using a JEOL JX-300 A microprobe, with the parameters listed in Table S2.
Isotopic analyses of the samples
Selected samples were used to determine the isotopic composition of stable (O, H, C) and radiogenic (Pb from U) isotopes. The principal criterion for the sample selection was the possibility of obtaining phase-pure material (i.e. no mineral mixtures) from well documented samples (inspection in the binocular microscope, optical and electron microscopy on sections). Stable isotopes were measured on mineral separates, cleaned under the binocular microscope. The selected samples featured mineral grains large enough to be separated mechanically from other minerals under the binocular microscope. No means of chemical extraction were applied. The radiogenic isotopes were measured in situ in polished sections.
Stable oxygen isotope analyses were performed on the following three materials: (1) CO2 evolved from acid digestion of selected malachite samples (Table 3); (2) bulk oxygen isotope composition in a suite of secondary minerals (Table 4); and (3) phosphate oxygen isolated by the precipitation of silver phosphate (Table 5). All of these methods are described below and the results are referred to in the text as δ18OVSMOWtot, δ18OVSMOWCO2 and δ18OVSMOWPO4, respectively.
Isotopic composition of malachite from Podlipa. The C and O isotopes were measured in the CO2 gas liberated by phosphoric acid digestion (at 70°C), i.e. they do not represent the total O isotopic composition in malachite

Total isotopic composition of pseudomalachite, malachite and libethenite from Podlipa

δ18OVSMOWPO4 values from the PO4 groups for pseudomalachite from the oxidation zone and fluorapatite from the host rocks. The subsamples (e.g. L-53a and L-53b) are separate fluorapatite concentrates derived from one large sample

Carbon (δ13CPDB) and oxygen (δ18OVSMOWCO2) isotopes of malachite were measured using an automated carbonate preparation system Kiel IV coupled to an isotope ratio mass spectrometer (IRMS) MAT253 (ThermoScientific) (Slovak Academy of Sciences, Banská Bystrica). Powdered samples of ∼600–800 µg were evacuated at 70°C and reacted with anhydrous H3PO4. The CO2 yielded was purified cryogenically and measured in dual-inlet mode against the standard gas. The raw isotope values were calibrated using two reference materials with δ18O = –15.30‰ and –2.40 ‰ and δ13C = –9.30‰ and +2.48‰ (all relative to PDB). These have been calibrated by 60 measurements using international reference materials NBS18 (δ13C = –5.014 ‰, δ18O = –23.01 ‰) and NBS19 (δ13C = +1.95 ‰, δ18O = –2.2 ‰). The standard deviations (1σ) on a set of 22 measurements of reference materials were 0.02‰ and 0.03‰ for δ13C and δ18O, respectively.
Hydrogen isotopes (δ2H) were measured using an elemental analyser (FLASH 2000 HT plus) coupled to the IRMS in continuous-flow mode. Powdered samples of ∼250–700 µg were placed in silver capsules and pyrolysed on glassy-carbon chips in a stream of helium at 1400°C. Evolved H2 was purified of other gases on a packed chromatographic column (5 Å mol sieve) and led into the IRMS. The δ2H values were calibrated by international reference materials USGS 57 and USGS 58 with δ2H = –91.5 ± 2.4 and –28.4 ± 1.6 ‰, respectively (Qi et al., Reference Qi, Coplen, Gehre, Vennemann, Brand, Geilmann, Olack, Bindeman, Palandri, Huang and Longstaff2017). The standard deviation (1σ) estimated on a set of 96 measurements of reference materials is 1.73‰ for δ2H; values are reported as δ2HVSMOW.
Oxygen in the phosphate (PO4) ions was measured in Ag3PO4 prepared from the natural phosphates using a modified method developed by Shabaga et al. (Reference Shabaga, Gough, Fayek and Hoppa2018). The dissolution in HF and precipitation of Ag3PO4 in silver ammine solution (0.2 M AgNO3; 0.3 M NH4NO3; 0.74 M NH4OH) was carried out at 25°C to avoid eventual decomposition of CuF2 to Cu(OH)2. The rinsed and dried Ag3PO4 powder was pyrolysed to CO using the same method as with hydrogen isotopes. The δ18O values were calibrated using the same carbonate reference materials as carbonate δ18O and international reference materials NBS127 and IAEA-SO6 with δ18O = +8.7 and –11.3 ‰ relative to VSMOW. The standard deviation (1σ) estimated on 22 analyses of working standards (Ag3PO4) is 0.26‰.
The in situ U-Pb isotopic analyses and dating were done with laser-ablation sector field-inductively coupled plasma-mass spectrometry (LA-SF-ICP-MS) at the Goethe University Frankfurt (GUF). At GUF, a ThermoScientific Element 2 sector field ICP-MS is coupled to a RESOLution S-155 (Resonetics) 193 nm ArF Excimer laser (CompexPro 102, Coherent) equipped with a two-volume ablation cell (Laurin Technic, Australia). Static ablation in a helium atmosphere (0.3 L/min) used a spot size of 213 µm and a fluence of ∼1 J cm–2 at 6 Hz. Soda-lime glass, SRM-NIST614, was used as a reference glass together with three carbonate standards to bracket sample analysis. Raw data were corrected offline using a macro-based, in-house MS Excel© spreadsheet program (Gerdes and Zeh, Reference Gerdes and Zeh2009). The 207Pb/206Pb ratio was corrected for mass bias (0.6%/amu) and the 206Pb/238U ratio for inter-element fraction (∼5%). Due to the carbonate matrix, an additional correction of 9% was been applied to the 206Pb/238U, which was determined using the WC-1 carbonate reference material dated by TIMS (254 ± 6 Ma, Roberts et al., Reference Roberts, Rasbury, Parrish, Smith, Horstwood and Condon2017). It was not possible to obtain reasonable data for every sample because of the low U content or unfavourable U/Pb ratio and variability. About half of the carbonate samples used in this study yielded ages; for the other half, no data could be extracted.
Results
Petrography and mineral composition of the host rocks
The host rocks of the Podlipa deposit are green-greyish meta-siliciclastic rocks with mostly massive textures. The weak regional Alpine metamorphism (Vozárová and Vozár, Reference Vozárová and Vozár1988; Polák et al., Reference Polák, Filo, Havrila, Bezák, Kohút and Kováč2003) resulted in schistose textures and various degrees of crushing of quartz grains. The rocks are fine to coarse grained and contain high percentages of angular to subangular grains. The sedimentary protolith was immature and sorting of the framework grains is generally poor.
The host rocks usually have quartzolithic composition with quartz predominant. In addition, they have a large proportion of matrix content (∼40%). The original clay matrix is slightly recrystallised, changed to a mixture of illite and chlorite. These rocks can be classified as lithic metagreywackes. Quartz is the dominant framework component, making up ∼30% and occurring as monocrystalline and polycrystalline grains. Lithic grains make up ∼15%. There are igneous, metamorphic and sedimentary rock fragments. Igneous rock fragments include granite, microgranite, rhyolite and andesite. Metamorphic rock fragments comprise paragneiss, orthogneiss and mica schist clasts. Finally, sedimentary rock fragments involve fine-grained sandstones and various volcaniclastic rocks. Feldspars (K-feldspar, plagioclase) make up ∼10% of the rocks. Feldspars are mostly unaltered but there are a few grains showing a weak degree of illitisation. White mica is generally more abundant than biotite, both constituting ∼5%. The heavy mineral assemblage is characterised by the presence of zircon, tourmaline, monazite, xenotime, apatite, ilmenite and hematite.
Rock-forming minerals (quartz, chlorite, muscovite, illite, feldspars) were also observed in back-scattered electron images but were not analysed. Analyses of apatite determined that all grains belong to fluorapatite, the anion position being completely occupied by F (Table S3). Exploratory WDS analyses of the xenotime (Table S4) confirmed its identity and the prevalence of Y in its structure and probably belongs to xenotime-(Y).
Oxidation zone
The oxidation zone at Podlipa is a steeply dipping (50°), essentially tabular body. The thickness of the body is up to 3 m. It is separated from the footwall and hanging wall by two clayey layers with thicknesses of ∼10 cm each (Fig. 3a). Inside the body, pervasive hydrothermal silicification can be observed. Intensively crushed and fractured quartz forms lenses and veinlets, with no preferred orientation, which intersect the ore body (Fig. 3b). Secondary copper minerals are found in the fractures in quartz and the silicified metagreywackes (Fig. 3c) are found almost exclusively in the ore body and not beyond the clayey layers, either in the footwall or in the hanging wall. Iron and manganese oxides are omnipresent and stain the oxidation zone in reddish, brownish and black colours (Fig. 3a–d).
Photographs of the oxidation zone in the investigated underground spaces. For the locations of where the photographs were taken, see Fig. S1 (supplementary information) with the positions of the samples in each image: (a) mineralised zone with abundant brownish iron oxides and black manganese oxides, separated from the weakly mineralised hanging wall by a white clayey zone (sample L-33); (b) hydrothermal quartz with abundant black manganese oxides and pseudomalachite. Note the numerous fractures in quartz with no preferred orientation. These fractures are commonly mineralised (sample L-20); (c) rich accumulations of zoned pseudomalachite in quartz, together with rusty iron oxides and black manganese oxides (sample L-24); (d) red iron oxides as a replacement of primary chalcopyrite with a small amount of malachite (sample L-9).

Chemical composition of the country rocks and the mineralised zone
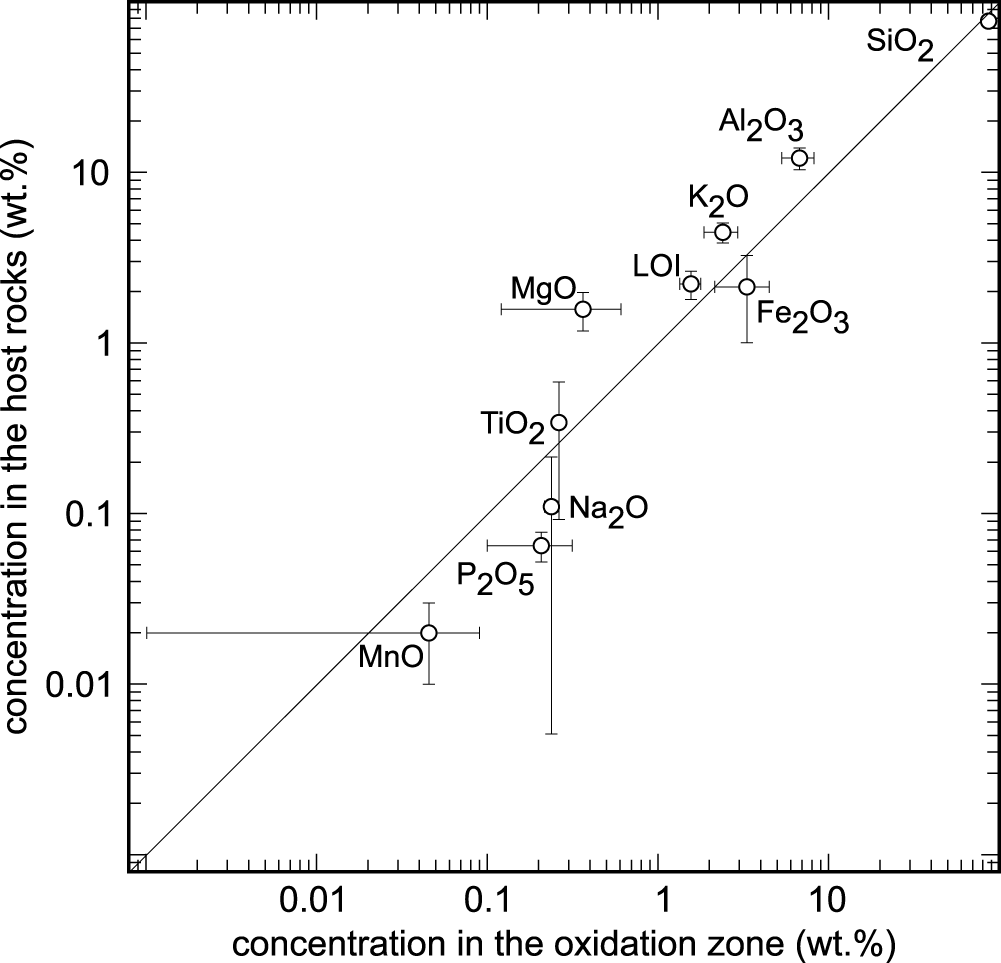
The differences in the chemical composition of the host rock and the ore body were investigated in order to determine element enrichment or depletion during both the hydrothermal and the weathering processes. The concentrations of major and minor elements in the unmineralised rocks and in the channel samples from the oxidation zone in Podlipa are listed in Table 2. Figure 4 shows the differences in the concentrations; only the compositions of the metagreywackes and not the Triassic sandstones, were considered because the mineralisation does not reach the Triassic rocks. The oxidation zone is depleted in Al2O3, K2O, MgO and TiO2 and demonstrates small LOI values. On the other hand, the oxidation zone is slightly enriched in SiO2 and more enriched in Fe2O3, Na2O, MnO and P2O5.
Comparison of the concentration of the major and minor oxide components in the oxidation zone and in the metagreywackes in Podlipa. The error bars represent 1 standard deviation calculated from measurement from oxidation zone (channel samples L-51 and L-52, Table 2) and host rocks (L-46, L-47, L-48, Table 2). CaO is not plotted because in the channel samples from the oxidation zone, its concentration was below the detection limit. SO3 concentration was below the detection limit in all samples. LOI = loss on ignition.

Secondary minerals, their textures, parageneses and chemical and isotopic compositions
The main secondary minerals, observed in this and many previous studies (Table 1) at Podlipa, are malachite, libethenite, pseudomalachite and ubiquitous iron and manganese oxides (Fig. 5). The copper secondary minerals have been the subject of many previous investigations that provided extensive details on their occurrence and chemical composition (Števko et al., Reference Števko, Sejkora and Malíková2016, Reference Števko, Sejkora and Súľovec2017, Reference Števko, Sejkora and Dolníček2021 and references therein). Libethenite forms dark green to greenish black, dipyramidal to short prismatic crystals up to 9 mm across in the fractures of the host rocks and numerous vugs (Fig. 5a). The majority of these vugs are open spaces formed by the dissolution of primary hydrothermal carbonates. Libethenite is close to its nominal formula Cu2(PO4)OH and its molar P/(P+As) ratio rarely drops below 0.98 (Števko et al., Reference Števko, Sejkora and Dolníček2021). Among elements other than Cu, P or As, only traces of Si and Al (up to 0.11 wt.% SiO2 or Al2O3) were detected.
Photographs of secondary minerals from Podlipa: (a) dipyramidal crystals of libethenite with small prismatic truncations in vuggy quartz stained by brownish iron oxides. The hollow spaces were probably occupied by hydrothermal carbonates; (b) botryoidal pseudomalachite growing on a crust of black manganese oxides; (c) radial aggregate of malachite in quartz with crusts and dustings of manganese oxides; (d) alternation of bands of malachite and cuprite. Photographs by László Kupi (a,b,c) and Pavel Škácha (d).

Pseudomalachite is very common throughout the oxidation zone, forming mostly botryoidal, concentric aggregates with sizes up to 5 cm in quartz (Fig. 5b). Pseudomalachite conforms to its formula Cu5(PO4)2(OH)4, with an average molar P/(P+As) ratio of 0.96. Among other elements, only Si was detected in traces, occasionally up to 0.30 wt.% SiO2. The polymorphs of pseudomalachite, ludjibaite and reichenbachite, are much scarcer than pseudomalachite.
Malachite is also common and its chemical composition corresponds to the nominal composition Cu2(CO3)(OH)2. It forms radial aggregates, acicular crystals, fine-grained masses and coatings on quartz and the host rocks (Fig. 5c). Azurite is extremely rare. The deeper parts of the oxidation zone contain rare cuprite (Cu2O) (Fig. 5d) and rare native copper.
A feature that is common to libethenite, pseudomalachite and malachite, is their spatial distribution throughout the oxidised ore body. They are not restricted to the immediate vicinity of the weathered chalcopyrite or the relics thereof. In addition to the spectacular specimens of euhedral crystals or large aggregates, they are common as omnipresent thin coatings and crusts in quartz. No vertical zonality in terms of abundance and distribution of malachite, pseudomalachite and libethenite were observed.
Textural observations, both macroscopic and microscopic, do not allow for the recognition of clearly defined stages of the mineral formation in the oxidation zone. In some cases, libethenite grows on pseudomalachite but the reverse relationship is common, too. Similar conclusions have been reached for malachite or Fe and Mn oxides. Secondary Cu minerals may grow on the oxides or the oxides may coat them. No clear-cut temporal relationship among the secondary minerals was determined or reported in either the older literature or in our >30 y of work at this site.
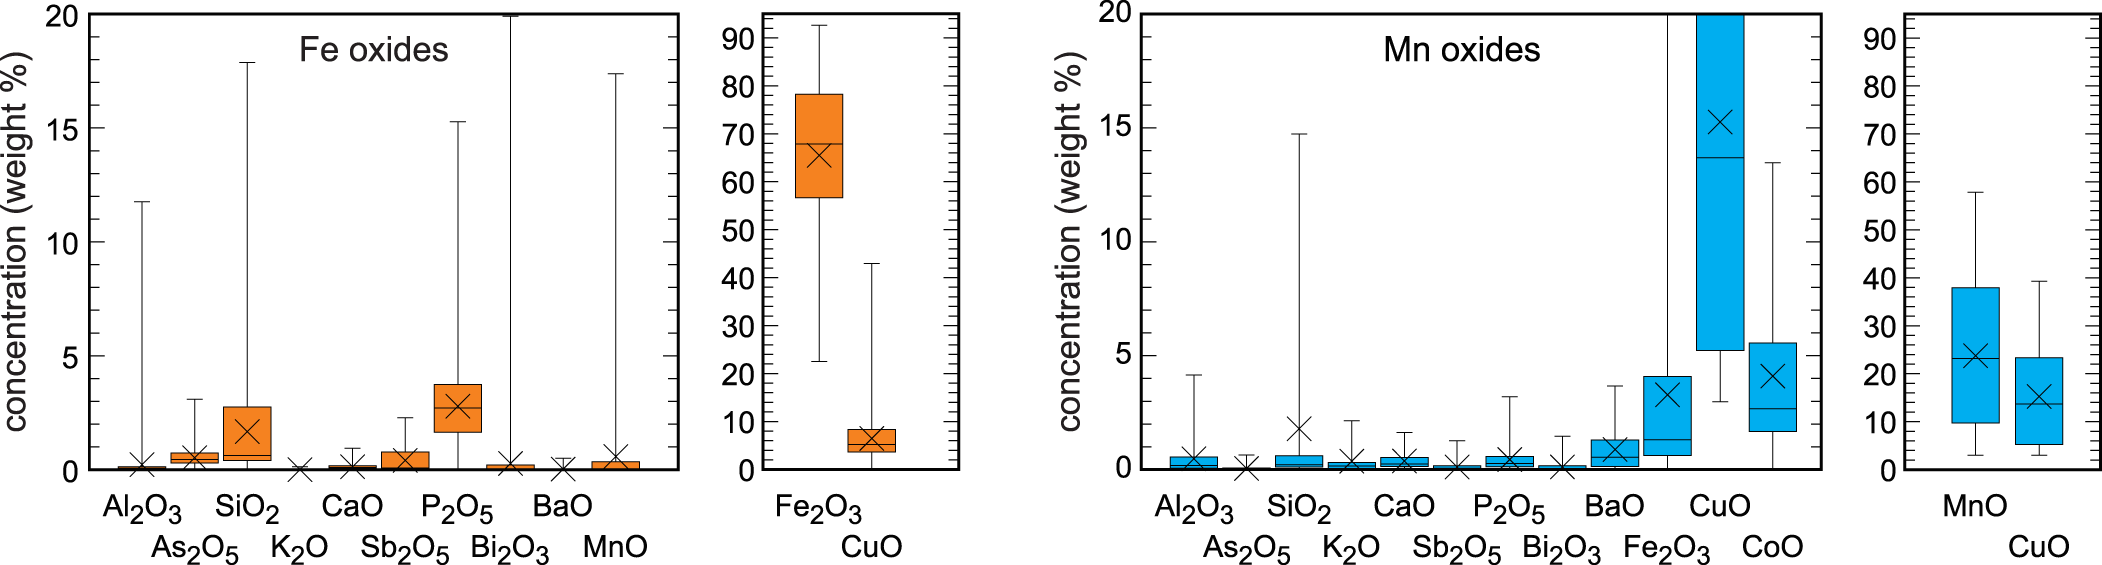
Iron oxides are ubiquitous throughout the oxidation zone of reddish rusty to brown colours. They form fine-grained, earthy masses, up to 10 cm in size (Fig. 3d) and omnipresent coatings on hydrothermal quartz and the host rocks. In the uppermost parts of the oxidation zone, the reddish masses are made almost only of iron oxides. In the deeper portions, they contain cores and relics of chalcopyrite, verifying that these iron oxides are remnants after weathering of chalcopyrite. Powder X-ray diffraction (XRD) identified the reddish iron oxides as hematite and the brown crusts and coatings as goethite. No quantitative analysis of the relative abundance of these minerals is available but our visual estimates throughout the oxidation zone suggest that their amounts are roughly equal. Chemical analyses showed elevated amounts of tetrahedral anions of silicate (1.7±1.8 wt.% SiO2, 1σ) and phosphate (2.7±1.7 wt.% P2O5, 1σ) and elevated concentrations of copper also (6.5±4.8 wt.% CuO, 1σ) (Fig. 6, Table S5). It is not clear, however, if the Cu concentrations relate to Cu associated with Fe oxides or discrete, submicroscopic Cu phases embedded in the masses of Fe oxides.
Box-and-whiskers diagrams of the major and minor oxide components in the Fe oxides and Mn oxides from Podlipa. All data are in wt.% from spot electron microprobe analyses. The horizontal lines in the boxes show the median; the crosses show the average. The upper and lower edges of the boxes represent 75% and 25% percentiles, respectively, and the whiskers show the extrema. All electron microprobe analyses are listed in Tables S5 and S6 (supplementary information).

Manganese oxides are common and distributed throughout the oxidation zone. They are always black and coat the host rocks (Figs 3b, 5b,c). They form small circular aggregates or larger masses but never dendritic aggregates, otherwise typical of Mn oxides. Spot chemical analyses with electron microprobe document high concentrations of CuO (20.5±7.6 wt.%, 1σ), CoO (5.2±3.8 wt.%, 1σ) and BaO (1.0±1.0 wt.%, 1σ) (Fig. 6, Table S6), the cations of which are typically taken up by the Mn oxides to compensate for the charge deficit in the Mn–O frameworks or sheets. The concentration of phosphate (0.5±0.6 wt.% P2O5, 1σ), on the other hand, is less than in the iron oxides. The concentration of silicate is comparable and relatively scattered (2.5±4.1 wt.% SiO2, 1σ).
Stable isotopes
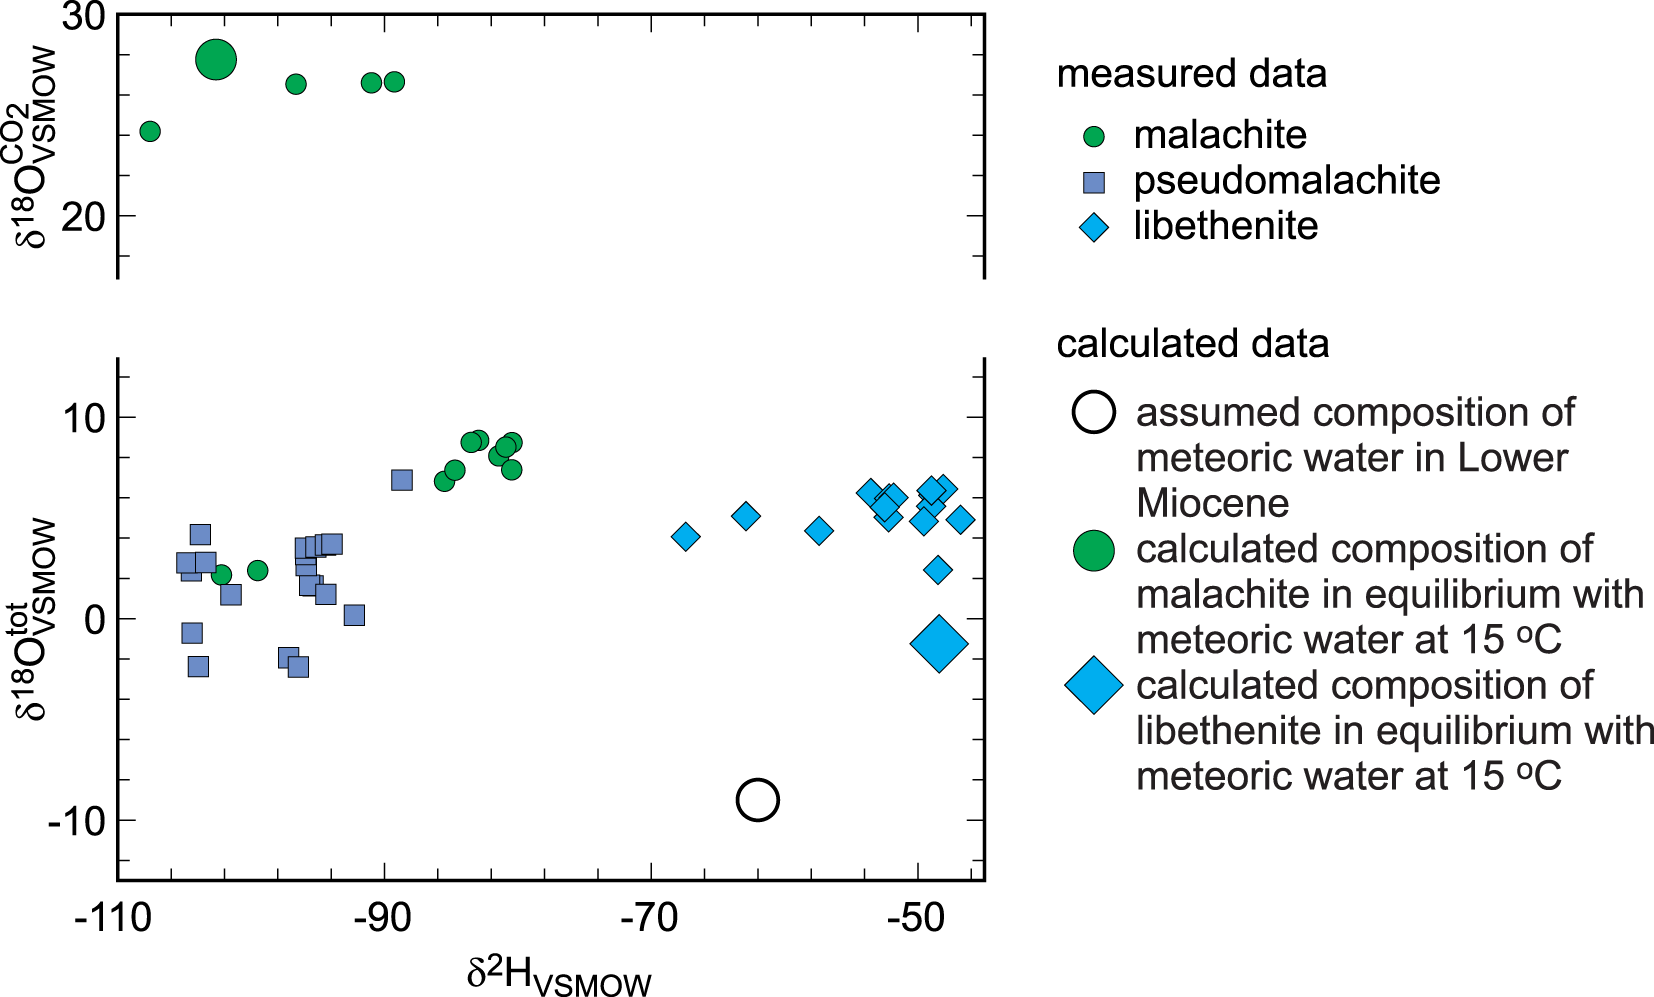
These measurements of O, C and H isotope compositions were achieved with the specific purpose of identifying biogenic signals in the minerals of the oxidation zone. The results are listed in Tables 3, 4 and 5 and summarised graphically in Fig. 7. Note that the figure presents both δ18OVSMOWCO2 and δ18OVSMOWtot for malachite in one diagram. The data for libethenite form a separate cluster with tightly clustered δ18OVSMOWtot values but some scatter in the δ2H values. The data for pseudomalachite form two smaller clusters with a gap between them.
Isotopic composition of the secondary Cu minerals investigated from Podlipa. Note that the vertical axis shows both δ18OVSMOWtot and δ18OVSMOWCO2 for the minerals analysed.

The isotopic composition of the phosphate (PO4) groups from the fluorapatite in the metagreywackes and from the pseudomalachite in the oxidation zone is listed in Table 5. A comparison of the two data sets shows that they are different and they do not overlap with each other, suggesting that these data can be used to track the source of phosphate in the oxidation zone.
LA-SF-ICP-MS dating of secondary minerals from Podlipa
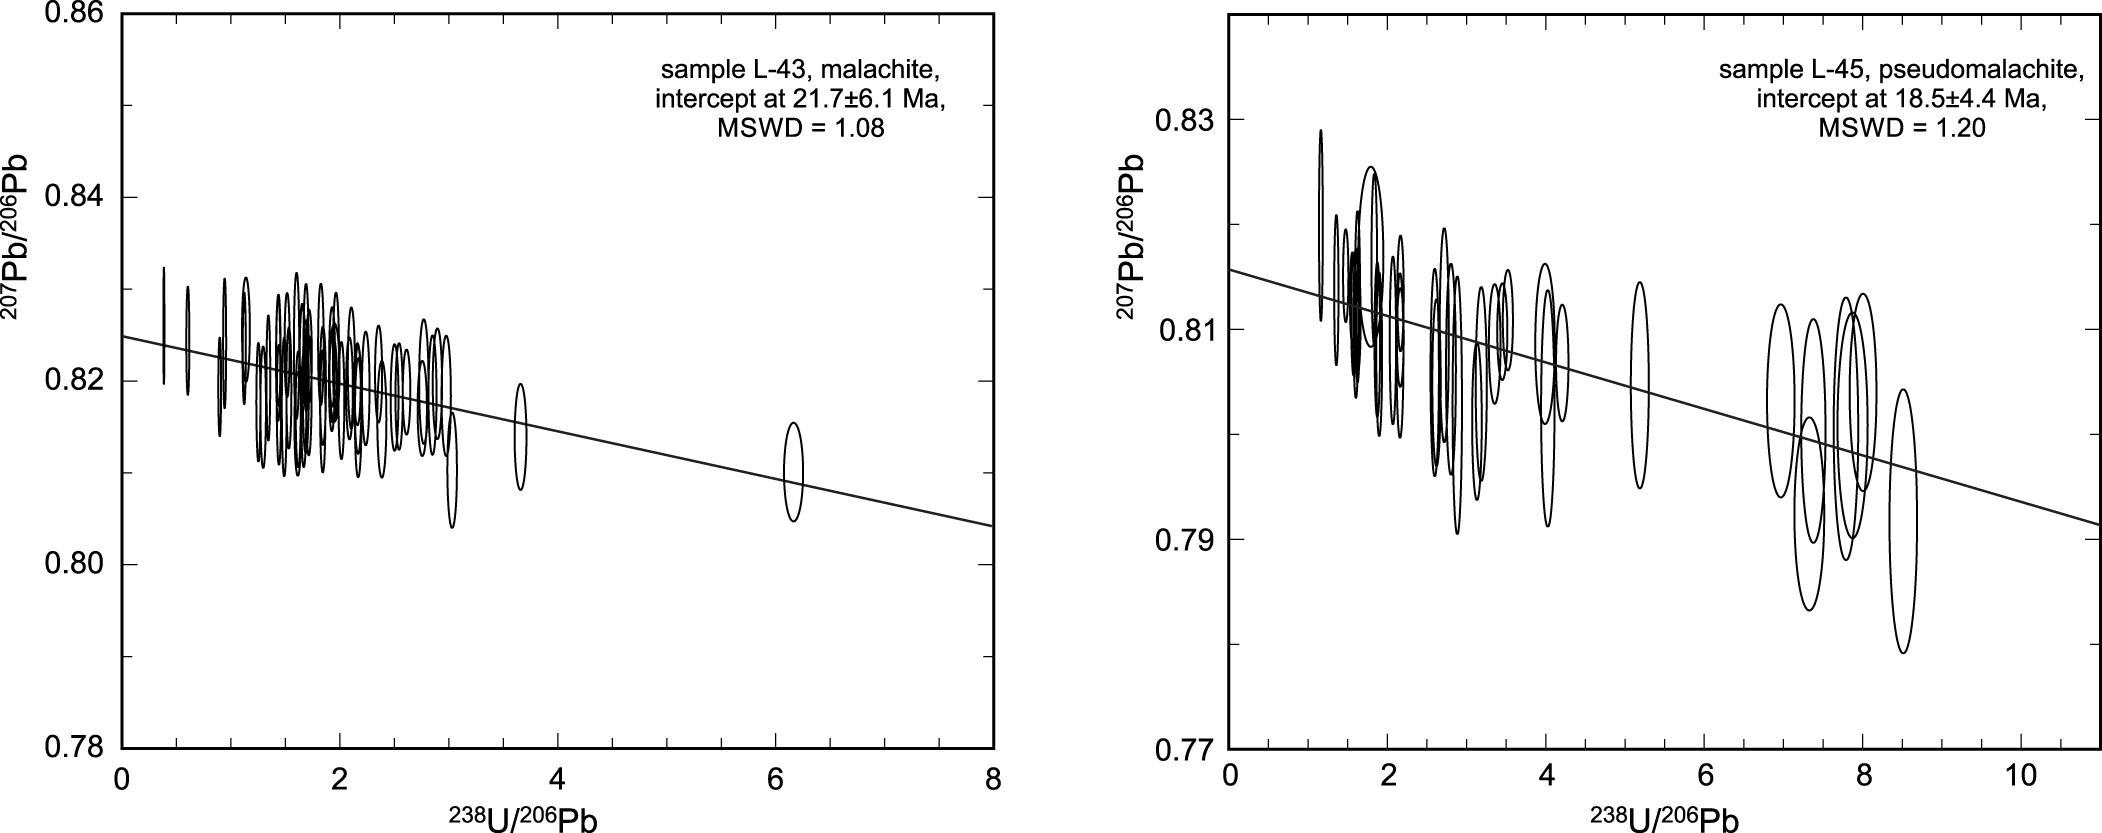
Two samples from the oxidation zone in Podlipa were analysed (L-43, L-45). They returned young ages of 22 ± 6 and 19 ± 4 Ma (Fig. 8), corresponding to the Lower Miocene. The sample L-43 consists of rich massive and acicular malachite aggregates in quartz; sample L-45 consists of botryoidal aggregates of pseudomalachite.
Tera-Wasserburg diagram for the U-Pb isotope analyses on samples L-43 and L-45, showing the age determined for the measured points (with their uncertainties as ellipses).

Discussion
The oxidation zone at Podlipa as a product of hydrothermal overprint
One of the working hypotheses during this work was the assumption that the secondary minerals formed by hydrothermal overprint of the primary mineralisation. The fluids could have been of low temperature (<100°C) and oxidised. This assumption is based on the evidence that the rocks and epithermal ores associated with the Neogene volcanic rocks experienced low-temperature overprint. In the direct vicinity of Ľubietová, such fluids could have been responsible for the deposition of opaline materials (Hvožďara, Reference Hvožďara1971; Polák and Jeleň, Reference Polák and Jeleň2016). In the broader area of the Slovak Neogene volcanic rocks, there is ample evidence of the interaction of late, low-temperature fluids with the precious-metal mineralisations, manifested by supergene enrichment and replacement of electrum by uytenbogaardtite and the formation of secondary Ag minerals (e.g. Chovan et al., Reference Chovan, Kubač, Mikuš, Žitňan and Prcúch2019).
Stable isotopes, however, speak against the hydrothermal origin of the oxidation zone studied. The O and H isotopes (Table 4, Fig. 7) show that the secondary minerals formed from meteoric water under near-surface temperatures. The isotopic composition of the meteoric water at the time of formation (age constrained by U-Pb dating of the secondary minerals) was estimated by Koděra et al. (Reference Koděra, Lexa, Rankin and Fallick2005, see their fig. 14), based on palynological data of Planderová et al. (Reference Planderová, Ziembińska-Tworzydo, Grabowska, Kohlman-Adamska and Konzálová1993) and reconstruction of the volcanic landscape by Konečný et al. (Reference Konečný, Lexa and Hojstričová1995). Using values between their estimated Badenian precipitation of δ2H = –62‰ and δ18O = –9‰, the isotopic composition of the secondary minerals can be calculated for T = 15°C with the fractionation factors for malachite (Melchiorre et al., Reference Melchiorre, Criss and Rose1999; Plumhoff et al., Reference Plumhoff, Mathur, Milovský and Majzlan2021) and libethenite (Majzlan et al., Reference Majzlan, Mathur, Milovský and Milovská2021). The resulting values, plotted together with the isotopic data for the secondary minerals from Podlipa, are depicted in Fig. 7. The expected values lie very close to the measured isotopic composition of malachite and libethenite.
Chemical differences between the host rocks and the oxidation zone at Podlipa
The depletion of the oxidation zone in Al2O3, K2O, MgO, TiO2 and LOI and enrichment in SiO2 (Table 2, Fig. 4) can be explained by pervasive silicification and precipitation of quartz in the ore body during the formation of primary hydrothermal mineralisation. Increased amounts of quartz caused the relative reduction in the concentrations of elements bound in sheet silicates (illite, chlorite, biotite), even if the sheet silicates were not removed by the hydrothermal fluids. The enrichment of the oxidation zone in Fe2O3 and MnO is the result of the weathering process, these elements accumulating as insoluble residua after dissolution of carbonates. Calcium was removed completely and the CaO concentration in the oxidation zone is below the detection limit. The enrichment in P2O5 is the result of weathering, influx of phosphate into the oxidation zone and precipitation of copper phosphates.
The question relevant here is whether the host rocks alone were able to deliver sufficient phosphate for the formation of the oxidation zone. Based on our bulk chemical data, the phosphate enrichment of the oxidation zone relative to the host rock is only three-fold. That means that slow leaching of the host rock could be considered as a substantial phosphate source. We note, however, that the channel samples were taken in the marginal portion of the ore body that was not mined out. It is likely, therefore, that the richest portions of the mined material contained more phosphate in libethenite and pseudomalachite. In this material, the relative enrichment could have reached somewhat higher values, although accurate numbers are impossible to determine.
Biological contribution: Carbon isotopes in malachite at Podlipa
A biological contribution to the oxidation zone is clearly manifested by the C isotopes in malachite (Table 3). The measured values of δ13CPDB of –19 to –17‰ show an input of biologically-derived carbon from the surface. These values, together with the measured δ18OVSMOWCO2 values (Table 3), fall into the range of the global data set presented by Melchiorre et al. (Reference Melchiorre, Criss and Rose1999). Our data fall in the field that Melchiorre et al. (Reference Melchiorre, Criss and Rose1999) marked as “speleothem”. The δ13C values in speleothems are strongly influenced by CO2 released by respiration in soil and malachite samples formed under such conditions have δ13CPDB values of between –10 and –20‰ (Melchiorre et al., Reference Melchiorre, Criss and Rose1999). CO2 derived from plants has a wide range of δ13C values, with typical values of ∼–26‰ for C3 plants and –13.5‰ for C4 plants (Alpers et al., Reference Alpers, Dettman, Lohmann and Brabec1990; Sharp, Reference Sharp2007). Speleothems form in a humid climate, with water percolating through and shaping the vadose zone and the oxidation zones of the ore deposits. Malachite in Podlipa formed in a lithology poor in carbonates (meta-siliciclastic rocks); therefore, the possible contribution of the dissolving and weathering hydrothermal carbonates to the overall CO2 budget must have been minor. The negative δ13C values suggest that the oxidation zone was open to the input from the of plant-derived CO2 reservoir at the surface.
Biological contribution: Source of phosphate in libethenite and pseudomalachite at Podlipa
The source of phosphate is more difficult to constrain. It is possible, however, to analyse the δ18OVSMOW signature in the PO4 group in the rock-forming fluorapatite and the secondary copper phosphates. The data from the present study (Table 5) show that the δ18OPO4 values in the rock-forming fluorapatite are distinctly different from those in the secondary copper phosphates. The values of δ18OPO4 in the rock-forming fluorapatite from Podlipa (–0.4 to +4.0‰) overlap with the range reported previously for igneous rocks and hydrothermal ores (0 to +12‰, Mizota et al., Reference Mizota, Domon and Yoshida1992; Tamburini et al., Reference Tamburini, Pfahler, Bünemann, Guelland, Bernasconi and Frossard2012; Bruand et al., Reference Bruand, Storey, Fowler and Heilimo2019). This information confirms that the fluorapatite (chemical composition determined by EMP analyses, Table S3) from the host rocks is of detrital origin, probably derived from igneous rocks the fragments of which are abundant in the host rocks.
The isotopic composition of the PO4 groups can differentiate the phosphate sources because the PO4 groups exchange their O ligands with the aqueous solutions very slowly, essentially retaining its O isotopic composition over a long time (Boyer, Reference Boyer1978; Blake et al., Reference Blake, O’Neil and Garcia1997). Colman et al. (Reference Colman, Blake, Karl, Fogel and Turekian2005) determined that inorganic O isotope exchange in phosphate requires times that significantly exceed pedogenic time scales (tens of thousands of years) to run to completion. Liang and Blake (Reference Liang and Blake2006, Reference Liang and Blake2009) discovered out that the enzymatic activity facilitates O exchange in the PO4 groups and imparts the isotopic composition of the surrounding solution. Sluggish inorganic exchange is observed under near-neutral conditions but may be enhanced in acidic solutions (O’Neil et al., Reference O’Neil, Vennemann and McKenzie2003). Acidic conditions did not, however, prevail in the oxidation zone in Podlipa, as evidenced by the copious malachite. This mineral would not have formed from acidic solutions.
Pucéat et al. (Reference Pucéat, Jaochimski, Bouilloux, Monna, Bonin, Motreuil, Moriniere, Hénard, Mourin, Dera and Quesne2010) quantified the biological isotopic exchange among the PO4 groups and the aqueous solutions. Their eq. 2: T (°C) = 118.7 – 4.22(δ18OPO4 – δ18Owater) relates the isotopic composition of PO4 groups, water and temperature. Our data for δ18OPO4 in the secondary Cu phosphates scatter widely, from 6.98 to 15.51 ‰. Application of the value of δ18Owater = –9‰, assumed as the isotopic composition of meteoric water during the formation of the oxidation zone (see above), leads to a spread of calculated temperatures from 15 to 51°C. The temperature of 15°C seems to be a reasonable estimate for the formation of the oxidation zone, confirmed also by the total O and H isotopes in the secondary minerals (see above). Temperatures in excess of 50°C can be achieved in oxidation zones (e.g. Melchiorre, Reference Melchiorre2022) but are typical of weathering of massive sulfide lenses, not for the disseminated mineralisation investigated in this work. Hence, the secondary phosphates with high δ18OPO4 values (up to 15.5 ‰) are interpreted as being derived from biogenic phosphate. Progressively lower values (down to 7.0‰) represent mixing of biogenic phosphate and phosphate derived from the dissolution of fluorapatite in the host rocks. A significant biological input for the formation of secondary phosphates was also concluded by Burmann et al. (Reference Burmann, Keim, Oelmann, Teiber, Marks and Markl2013). They investigated the formation of pyromorphite [Pb5(PO4)3Cl] and speculated that, under humid conditions with abundant vegetation, phosphates will form preferentially, whereas under arid conditions, vanadates (vanadinite, Pb5(VO4)3Cl) may be preferred. In that sense, the predominance of phosphates at Podlipa favours the notion of a humid, warm climate during the formation of the oxidation zone. Cycling of P in various ecosystems showed that P losses to the vadose zone are dictated by P concentration in soil and, hence, in the bedrock (Lang et al., Reference Lang, Bauhus, Frossard, George, Kaiser, Kaupenjohann, Krüger, Matzner, Polle, Prietzel, Rennenberg and Willbrock2016). The ‘acquiring systems’ grow on P-rich soils, need not be concerned about P losses and supply more P into groundwater than the ‘recycling systems’. The metagreywackes in Podlipa, relatively rich in fluorapatite with additional monazite and xenotime-(Y), could have supported such ‘acquiring ecosystems’ and thus cycle phosphate from the host rocks, through uptake into the vegetation, into the oxidation zone.
Influence of the composition of the primary mineralisation and the host rocks on the rich oxidation zones: Comparison of Podlipa, Svätodušná, Farbište and Piesky
All of the four rich oxidation zones contain abundant malachite and sometimes also, azurite. There are distinct mineralogical and chemical differences among the four rich oxidation zones. Podlipa is dominated by phosphates, namely libethenite and pseudomalachite (Figuschová, Reference Figuschová1977a; Števko et al., Reference Števko, Sejkora and Malíková2016, Reference Števko, Sejkora and Súľovec2017, Reference Števko, Sejkora and Dolníček2021). Svätodušná and Farbište are characterised by arsenate assemblages, either of olivenite and euchroite or tyrolite/tangdanite (Figuschová, Reference Figuschová1977a; Řídkošil, Reference Řídkošil1981; Števko et al., Reference Števko, Sejkora and Bačík2011). Piesky, the fourth locality considered here, is particularly rich in Cu carbonates, with local enrichment in arsenates (Figuschová, Reference Figuschová1977b). The abundant Cu sulfates at Piesky formed largely post-mining, as a result of accelerated weathering due to mining.
The predominance of arsenates is the easiest case to explain. These oxidation zones contain primary As-bearing minerals, in our case tennantite [nominally Cu12As4S13] (Table 1). This mineral is able to supply copious amounts of arsenate into the oxidation zone and hinders the formation of secondary phosphates or sulfates. A similar situation is encountered at many other oxidation zones. Arsenates, including those of copper, were formed by weathering of tennantite in Tsumeb (Namibia; Southwood et al., Reference Southwood, Števko and Carr2020) or Cap Garonne mine (France; Mari and Rostan, Reference Mari and Rostan1986), weathering of enargite at the Centennial Eureka Mine (Utah, USA; Marty et al., Reference Marty, Jensen and Roberts1993), or weathering of chalcopyrite associated with arsenopyrite at Majuba Hill mine (Nevada, USA; Holmwood, Reference Holmwood2023) and in Cornwall (England; Dines, Reference Dines1956).
A limited supply of bismuth, such as at the study site, Podlipa, can also be explained by the primary ore mineralogy. At Podlipa, the rare Cu-Fe-Bi sulfosalts (kupčíkite, Luptáková et al., Reference Luptáková, Milovská, Jeleň, Mikuš, Milovský and Biroň2016) weathered to equally rare secondary minerals mrázekite, bismutite, Bi and Cu-rich corkite, kintoreite and petitjeanite (Števko et al., Reference Števko, Sejkora and Súľovec2017).
The abundance of post-mining sulfates at Piesky is explained by the composition of the host rocks. They are Permian siliciclastic rocks with intercalations of evaporites composed predominantly of gypsum. Gypsum released the sulfate and Ca necessary for the formation of brochantite, antlerite, devilline and other sulfates at this site. There are a few other studies where devilline is mentioned, although these studies are not specifically devoted to this particular mineral. Devilline can form from primary tennantite deposited in carbonate host rocks (Lengauer et al., Reference Lengauer, Giester and Kirchner2004) together with Cu arsenates. In this case, devilline is the product of the reaction between tennantite, sulfate-rich acid rock drainage and the carbonates. A similar scenario where the attack of acid mine drainage on primary sulfides was proposed at Radzimowice (Poland; Siuda and Kruszewski, Reference Siuda and Kruszewski2013) or at the Chilean copper deposits (Smuda et al., Reference Smuda, Dold, Spangenberg, Friese, Kobek, Bustos and Pfeifer2014, Lambiel et al., Reference Lambiel, Dold, Spangenberg and Fontboté2023).
Geological factors: Preservation of the rich oxidation zones
The biological (supply of CO2 and phosphate) or geochemical factors (supply of arsenate, phosphate, calcium) in the oxidation zones are necessary, but not sufficient, to explain the differences among the rich and the poor oxidation zones of the ore deposits in the studied region (Fig. 1). The explanation lies in the regional geological conditions during and after the formation of the oxidation zones.
The host of the rich oxidation zones at Podlipa, Svätodušná and Farbište, is the Veporic Superunit of the Central Western Carpathians (CWC). The oxidation zone at Podlipa was dated in this work at ∼20 Ma (Lower Miocene). Because of their similarity and geographic proximity, we assume that this age applies also to the oxidation zones at Svätodušná and Farbište.
During the Cretaceous, the Veporic Superunit was over-ridden by the Gemeric Superunit, a thick-skinned sheet lying south of the Veporic Superunit. In the Lower to Middle Miocene, at ∼20 Ma, the Veporic Superunit to the rear of the CWC had already been exhumed. The exposed Variscan basement of the Veporic Superunit underwent a period of tectonic quiescence and intense chemical weathering (Vojtko et al., Reference Vojtko, Králiková, Andriessen, Prokešová, Minár and Jeřábek2017), producing kaolin weathering crusts (Kraus, Reference Kraus1989). The rich oxidation zones studied here are contemporaneous with these kaolin crusts.
It has been assumed (Kraus, Reference Kraus1989) that the kaolin crusts were conserved because they were buried under the products of volcanic activity at 14–12 Ma (Konečný et al., Reference Konečný, Konečný, Kubeš and Pécskay2015a, Reference Konečný, Konečný, Kubeš and Pécskay2015b). Intensive kaolinisation was described also from a drill core that intersected metagreywackes covered by Badenian andesitic pyroclastic rocks (Zuberec, Reference Zuberec1977). These drill cores were located ∼6 km SWS of Podlipa. Hauerová et al. (Reference Hauerová, Blaha, Bartoň, Linkešová, Fodorová, Makuša, Pitoňák, Spišiak, Vybíral, Okál and Obst1989) presumed that the ore bodies at Podlipa continued under the Neogene volcanic cover, to the southeast of the deposits.
These observations together explain the formation of the rich oxidation zones at Podlipa, Svätodušná and Farbište. They formed during times of prolonged geological quiescence, under humid and warm conditions in the Lower Miocene. The abundance or scarcity of primary As-bearing sulfides was a decisive factor in the dominance of arsenates vs. phosphates in these oxidation zones. Afterwards, these oxidation zones were covered and preserved by the Neogene volcanic rocks. In the area of the today’s deposit at Podlipa, the volcanic rocks were eroded away only recently and the remnants of the volcanic rocks lie <1 km from the outcrops of the ore body (Figs 1, 2). It is likely that the volcanic rocks in this area still overlie not only primary Cu ores, but also parts of the oxidation zone of those ores.
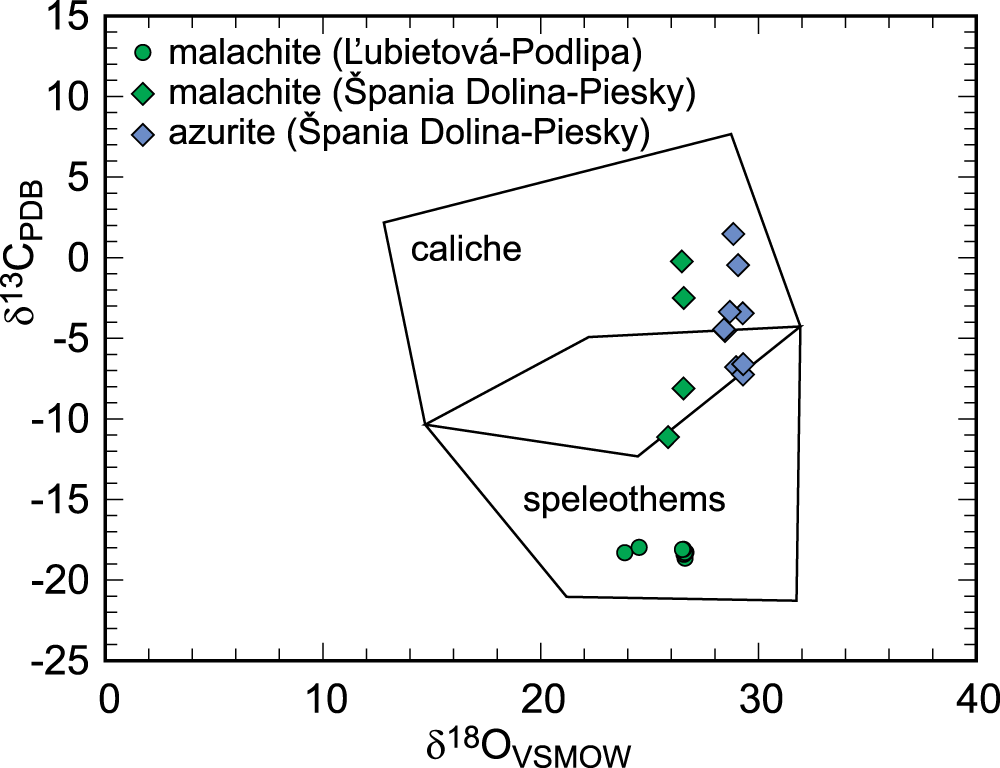
The oxidation zone at Piesky was dated to 2.47 ± 0.86 Ma or 2.67 ± 0.38 Ma (see Majzlan et al., Reference Majzlan, Kiefer, Herrmann, Števko, Sejkora, Chovan, Lánczos, Lazarov, Gerdes, Langhorst, Radková Borčinová, Jamieson and Milovský2018) by the U-Pb method on malachite and azurite. These ages coincide with the onset of the northern hemisphere glaciation (Lisiecki and Raymo, Reference Lisiecki and Raymo2005). We assume that this oxidation zone was created by weathering which preceded the major phases of glaciation. The scatter in δ13C data in malachite and azurite (Fig. 9) could be taken as an indication of fluctuations in climate and vegetation cover in the times of climate change. The differences, particularly in the δ13C values for Cu carbonates between Piesky and Podlipa must be ascribed to the different climatic conditions during weathering. They could be related to variable CO2 soil production in the early glacials and interglacials.
Isotopic composition of Cu carbonates from Podlipa (this work) and Špania Dolina-Piesky (Majzlan et al., Reference Majzlan, Kiefer, Herrmann, Števko, Sejkora, Chovan, Lánczos, Lazarov, Gerdes, Langhorst, Radková Borčinová, Jamieson and Milovský2018), plotted in the fields of speleothems (typical of a humid climate) and caliche (typical of an arid climate). The fields were taken from Melchiorre et al. (Reference Melchiorre, Criss and Rose1999).

The oxidation zones of the other ore deposits in Fig. 1 are diminutive and poorly developed. They are located in the Veporic and Tatric Superunit of the Central Western Carpathians. The Tatric superunit is the northernmost part of the Central Western Carpathians. Because of the NW-vergence of the Alpine orogeny, the Tatric Superunit was subjected to deformation and vertical movement later than the inner Veporic and Gemeric Superunits. The Variscan basement in the Tatric Superunit, uplifted rapidly and eroded during the Pliocene and Quaternary (e.g. Králiková et al., Reference Králiková, Vojtko, Sliva, Minár, Fügenschuh, Kováč and Hók2014), provided inferior conditions for the formation and preservation of oxidation zones. In the Veporic Superunit, the times of tectonic quiescence were replaced by accelerated exhumation during Pontian to Pliocene (∼6 to 3 Ma) (Vojtko et al., Reference Vojtko, Králiková, Andriessen, Prokešová, Minár and Jeřábek2017). These processes are evidenced by erosion and re-deposition of kaolin weathering crusts. Such processes had the capacity to diminish or destroy any exposed oxidation zones, leaving untouched only those covered by the Neogene volcanic rocks.
Conclusions
The oxidation zones at Podlipa and Špania Dolina-Piesky show a significant biological contribution during their formation. This conclusion could be extended to the other oxidation zones in this region but needs to be supported by additional data. The biological contribution is discernible in terms of:
• The carbon isotopic composition in malachite. Carbon was sourced from the soil CO2 and its isotopic signature corresponds to the climate conditions during weathering. At Podlipa, carbon isotopes are compatible with weathering in a steady, warm and humid climate. At Piesky, the scatter in the isotopic composition points at variations in vegetation cover, possibly linked to temperature variations in glacials and interglacials. These interpretations are supported by radiometric dating of the secondary minerals at both sites.
• The oxygen isotopic composition of the phosphate groups in the secondary copper phosphates. Phosphate is supplied from the vegetation above the oxidation zone. Additional phosphate may be sourced from accessory minerals (e.g. fluorapatite) in the host rocks, as indicated by the mixed O isotopic composition in some samples.
The geological (inorganic) contribution is seen clearly in:
• The metal load of the oxidation zones where the primary minerals (chalcopyrite, tetrahedrite-tennantite) deliver Cu, Sb, Fe, Zn and other metals to form the secondary phases.
• Arsenate secondary minerals (e.g. olivenite, euchroite) in some of the oxidation zones investigated (Ľubietová-Svätodušná and Poniky-Farbište). If the primary ores contain sulfides with As (e.g. tennantite), the supply of arsenate into the oxidation zone will swamp any phosphate delivered from biota.
• Sulfate secondary minerals (e.g. devilline, brochantite), especially at Špania Dolina-Piesky. The presence of evaporitic gypsum there may cause local accumulations of secondary sulfates.
The preservation of the oxidation zones is governed by geological factors such as:
• The rates of exhumation and erosion. In the investigated region, they were controlled by the general vergency of the Alpine orogeny to the north. At the time of formation at Podlipa, the crustal block was in a state of tectonic quiescence, with insignificant uplifting and erosion. This state allowed the weathering to proceed deeply into the uppermost zone of the deposits. The deep and intense weathering can be recognised not only in the ore deposits but also in the co-eval kaolin crusts in this region.
• Shielding from erosion by a cover of younger volcanic rocks. After the formation of the oxidation zones at Podlipa, Ľubietová-Svätodušná and Poniky-Farbište, the entire region was covered by Neogene volcanic rocks and underwent significant erosion. The volcanic cover preserved some of the kaolin crusts and some of the oxidation zones which can be observed and investigated today.
Supplementary material
The supplementary material for this article can be found at https://doi.org/10.1180/mgm.2025.10127.
Acknowledgements
This publication is dedicated to the memory of our colleague Jarka Luptáková who devoted much of her time and effort to understanding the mineralogy of this and related localities. She passed away at the age of 45 and will be missed by many of us. We are thankful to three anonymous reviewers for their helpful comments, to Monika Orvošová for the help with underground mapping and to Michael Ude for his assistance with the XRF analyses. This work was supported financially by the Slovak Research and Development Agency project APVV-22-0041.
Competing interests
The authors declare that they have no known competing financial interests or personal relationships that could have appeared to influence the work reported in this paper.
Author contribution
J.M.: Writing, methodology, field work, assistance with laboratory measurements, investigation, data curation, funding acquisition. M.Š., M.C., S.J., S.M.: fieldwork, electron microprobe analyses, mineralogical description. R.M.: stable isotope analyses, interpretation. M.V.: petrography. A.G.: U-Pb isotopic measurements. P.H.: underground mapping.


 Open access