


Notation
- ɛ
General expression for relative permittivity, including ɛ v, ɛ h, ɛ h1, ɛ h2 and ɛ s
- ɛ v
Relative permittivity of the ice core along the vertical as obtained from the analysis of a vertical prism
- ɛ h
Relative permittivity of the ice core along the horizontal plane as obtained from the analysis of a vertical prism
- ɛ h1, ɛ h2
Two components of the relative permittivity of the ice core within the horizontal disk
- ɛ a
Average value of the relative permittivity throughout the volume of the ice core ( = |ɛ v/3 + 2ɛ h/3|) assuming that the permittivity is uniaxially anisotropic around the vertical
- Δɛ
General expression for the dielectric anisotropy, including Δɛ (v−h), Δɛ (h1−h2) and Δɛ s
- Δɛ (v−h)
Dielectric anisotropy between the vertical and horizontal components (=|ɛ v–ɛ h|)
- Δɛ (h1−h2)
Dielectric anisotropy between the two horizontal components (=|ɛ h1–ɛ h2|)
- ɛ p
Tensorial value of the relative permittivity in a single crystal of ice in the principal coordinate, equal to $\left({\matrix{ {{\varepsilon }_\bot } \quad 0 \quad 0 \cr 0 \quad {{\varepsilon }_\bot } \quad 0 \cr 0 \quad 0 \quad {{\varepsilon }_{\rm \Vert }} \cr } } \right)$

- ɛ ⊥
Relative permittivity in a single crystal of ice with an electrical field perpendicular to the c-axis
- ɛ ||
Relative permittivity in a single crystal of ice with an electrical field parallel to the c-axis
- Δɛ s = ɛ || − ɛ ⊥
Dielectric anisotropy in a single crystal of ice
- z
The sampling depth in the ice sheet, m
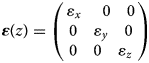
- ${{\boldsymbol \varepsilon} }( z ) = \left({\matrix{ {{\varepsilon }_x\;} \quad 0 \quad 0 \cr 0 \quad {{\varepsilon }_y} \quad 0 \cr 0 \quad 0 \quad {{\varepsilon }_z} \cr } } \right)$
The depth profile of the relative permittivity tensor along the three principal axes x, y and z
- a1(2), a2(2) and a3(2)
The three components of the normalized eigenvalues
- Δa(2)
Eigenvalue anisotropy (=a3(2) − (a1(2) + a2(2))/2) for the single maximum COF

1. Introduction
Crystal orientation fabric (COF) is one of the most important factors determining the physical properties of polar ice sheets, and both the deformation and flow of these sheets are greatly affected by the development of the COF. It is generally accepted that dislocation creep is the primary process responsible for the deformation of ice-sheet ice (see, e.g. Petrenko and Whitworth, Reference Petrenko and Whitworth1999; Cuffey and Paterson, Reference Cuffey and Paterson2010). In the dome regions of ice sheets, the vertical compressional stress resulting from the mass of the ice itself is the main source of the deformation force. Because dislocation creep results in a rotation of the c-axis toward the core axis (i.e. in the vertical direction), the Schmidt diagram for COF often indicates a single-pole maximum pattern as the depth is increased (e.g. Thorsteinsson and others, Reference Thorsteinsson, Kipfstuhl and Miller1997; Azuma and others, Reference Azuma1999, Reference Azuma and Hondoh2000; Wang and others, Reference Wang, Kipfstuhl, Azuma, Thorsteinsson and Miller2003; Durand and others, Reference Durand2007, Reference Durand and Hondoh2009). In addition, several factors related to lateral strain and shear tend to produce complex variations in the COF. As an example, the potential migration of the dome area with changes in climate can give rise to various time-dependent shear stresses, and a horizontal imbalance of the lateral extensions resulting from geometric anisotropy of the dome shape may also modify the COF. Moreover, it has been suggested that ions such as Cl−, F− and NH4+ are active in these layered deformations (e.g. Fujita and others, Reference Fujita2016). Thus, variations in the c-axis distribution along the ice core can provide a record of the deformation history caused by mechanisms such as those described above.
The orientation of the c-axis is commonly determined from thin ice sections using automatic crystal fabric analyzers based on optical (visible light) techniques (hereinafter, ‘optical’ means visible light). Over the last several decades, several automated analyzers have been reported (e.g. Wang and Azuma, Reference Wang and Azuma1999; Wilson and others, Reference Wilson, Russell-Head and Sim2003) involving innovative methods that allow the rapid assessment of large numbers of crystal grains in thin ice sections. Nevertheless, even using these automated techniques, obtaining a continuous COF profile along a lengthy ice core section requires the labor-intensive preparation of many thin sections. Accordingly, the sampling frequency along an ice core is often limited, with typical sampling intervals of at least 5 or 10 m. In addition, even though several hundreds to thousands of crystal grains can be present within each such section, it can be difficult to detect small fluctuations in COF development. Thus, it is preferable to make continuous measurements throughout a bulk ice core sample whenever physically possible.
The present work demonstrates a new approach to assessing the COF in bulk ice core specimens, based on determining the tensorial components of the relative permittivity, ɛ, of the ice using an open resonator. The ɛ values for ice, firn or snow at high frequencies (in the MHz to GHz range) at the temperatures typically encountered in the Earth's cryosphere are correlated with the density of the material (e.g. Evans, Reference Evans1965; Kovacs and others, Reference Kovacs, Gow and Morey1995; Fujita and others, Reference Fujita, Matsuoka, Ishida, Matsuoka, Mae and Hondoh2000). Prior studies have also shown that ɛ is affected by both temperature and crystal orientation (see Fujita and others, Reference Fujita2014, and references therein; see also Appendix A in the present paper). Hexagonal ice crystals exhibit uniaxial symmetry around the c-axis, and the dielectric properties of these crystals are therefore also symmetrical. The ɛ value for ice at the high-frequency limit is ~3.12–3.19 (e.g. Fujita and others, Reference Fujita, Matsuoka, Ishida, Matsuoka, Mae and Hondoh2000; see also Appendix A), and the ɛ values parallel and perpendicular to the c-axis of ice crystals will differ by ~0.031–0.037 depending on temperature (Fujita and others, Reference Fujita, Mae and Matsuoka1993; Matsuoka and others, Reference Matsuoka, Fujita, Morishima and Mae1997; see also Appendix A). As a result of the anisotropic nature of each crystal grain, polycrystalline ice also exhibits macroscopic anisotropy of ɛ in conjunction with the COF (e.g. Hargreaves, Reference Hargreaves1978; Fujita and others, Reference Fujita, Maeno and Matsuoka2006).
In polar ice sheets at depths shallower than the firn-ice transition, the dielectric anisotropy (Δɛ) between the horizontal and vertical directions reflects the geometric structures formed by ice and pore spaces in the firn. Both ice grains and pore spaces in snow and firn are known to develop in the vertical direction (e.g. Alley, Reference Alley1987). The Δɛ value resulting from geometric anisotropy can be as high as ~0.08 (Fujita and others, Reference Fujita, Okuyama, Hori and Hondoh2009, Reference Fujita2014, Reference Fujita2016), which greatly exceeds the Δɛ value resulting from the COF in the polar firn (~0.01) (Fujita and others, Reference Fujita, Okuyama, Hori and Hondoh2009). Therefore, the Δɛ value in firn can be considered as an indicator of the degree of geometric anisotropy. In contrast, because geometric anisotropy is reduced below the firn-ice transition as a consequence of the closing of pore spaces, the Δɛ value for ice in this region reflects the degree of c-axis clustering. Matsuoka and others (Reference Matsuoka, Mae, Fukazawa, Fujita and Watanabe1998) first investigated the dielectric properties of an ice core from Dome Fuji in East Antarctica (Watanabe and others, Reference Watanabe1999; Dome Fuji Ice Core Project Members, 2017) using an open resonator system operating at 33 GHz. In that prior work, Δɛ values were determined for a core sample taken from a depth of 350 m, and the results showed that the Δɛ value between the horizontal and vertical directions at 233 K was 0.0104 ± 0.0004, equivalent to ~1/3 of the Δɛ value for single-crystal ice. Since this first measurement at a single depth, the resonator system has been improved so that it is now possible to perform continuous measurements along lengthy slab-shaped ice core samples (Fujita and others, Reference Fujita, Okuyama, Hori and Hondoh2009, Reference Fujita2014, Reference Fujita2016). In addition, earlier studies using millimeter-wave (30–40 GHz) radiation were only able to assess samples <~10 mm thick. This limitation occurred because the signal became too weak when examining thicker samples due to the high attenuation resulting from vibrations of the ice lattice at far-infrared frequencies (e.g. Warren and Brandt, Reference Warren and Brandt2008). The present work uses a new system based on lower frequencies (14–20 GHz) so as to decrease radio wave absorption losses. Moreover, previous studies investigated Δɛ only around the core axis, and so the Δɛ values in the horizontal direction were not examined.
In the present work, we used Dome Fuji station ice cores to study the Δɛ values in vertical and horizontal sections of the specimens. The Δɛ data indicated the degree of c-axis clustering around the core axis and the anisotropy of the COF in the horizontal plane. In addition, by rotating horizontal and vertical sections of ice core samples about the core axis, we were able to ascertain the effect of core rotation and the reproducibility of this measurement technique. In the case of horizontal section measurements, the resulting Δɛ values were compared with COF data acquired using a modern ice fabric analyzer. In particular, this comparison demonstrated that Δɛ can serve as a direct substitute for the normalized COF eigenvalues. Based on the dielectric properties data acquired during this study, we also discuss the possibility that techniques capable of determining Δɛ could be used as a means of investigating the COF within an ice sheet.
2. Experimental procedures
2.1 Relative permittivity measurements using a microwave open resonator
2.1.1 Basic methodology
The relative permittivity, ɛ, of various specimens was determined using the open resonator method (Jones, Reference Jones1976a, Reference Jonesb; Komiyama and others, Reference Komiyama, Kiyokawa and Matsui1991). In this technique, an electrical field is applied to ice slabs with precisely microtomed parallel planes. This field is obtained by irradiating the sample with a microwave beam having a Gaussian distribution with a half-power diameter of several centimeters. The half-power diameter of microwave beam depends on size and shape of resonators and frequency. This approach allows precise ɛ values to be determined for the cylindrical part of ice specimens penetrated by this beam, simply by selecting the appropriate frequency and sample thickness (Jones, Reference Jones1976a, Reference Jonesb; Cullen, Reference Cullen and Button1983; Komiyama and others, Reference Komiyama, Kiyokawa and Matsui1991). In addition, the angle between the direction of the electrical field and the principal axis of tensorial ɛ within the sample can be adjusted. If the ice core specimen possesses homogeneous dielectric characteristics along the electrical field direction, a single resonance peak will be observed and a unique ɛ value will be obtained. In contrast, if the media's dielectric properties are anisotropic, two resonance peaks will be obtained because the electromagnetic wave will have two resolved components, based on the same physical principle responsible for optical birefringence in uniaxial crystals. By evaluating the resonance of microwaves associated with these two components, we can derive the two components of ɛ simultaneously with a single frequency sweep. Herein, we define ɛ v and ɛ h as the relative permittivities at microwave frequencies with electrical fields in the vertical and horizontal planes, respectively. The feasibility of employing dielectric anisotropy, Δɛ (=ɛ v–ɛ h), as a substitute for the COF was examined on this basis.
2.1.2 Summary of the new resonator
In preparation for this work, we designed a new type of open resonator, operating at frequencies between 14 and 20 GHz. This open resonator was a semi-confocal type with a flat mirror and a concave mirror having a 250 mm radius of curvature, set 225 mm apart. The Gaussian beam at the sample insertion position between the two mirrors had a half-power diameter of 38 mm. The frequency was selected so that attenuation of the radio waves was significantly reduced compared with the resonator used in our previous work over the range of 30–40 GHz in conjunction with a half-power diameter of ~22 mm. Note that the diameter of the microwave beam is determined unambiguously depending on size and shape of the resonator and frequency used (Jones, Reference Jones1976a, Reference Jonesb; Cullen, Reference Cullen and Button1983; Komiyama and others, Reference Komiyama, Kiyokawa and Matsui1991). By compromising the measurement resolution associated with the new device (going from 22 to 38 mm), we were able to measure samples as thick as 80 mm, in contrast to the previous value of 10 mm. The ɛ values obtained from this instrument were volume-weighted averages within the region covered by the Gaussian distribution of the beam. The sample width should preferably be much larger than the half-power diameter (ideally double). The samples in the present work had flat parallel surfaces and measuring widths between 58 and 62 mm and so they generally did not fully satisfy this condition. Systematic error caused by this situation is discussed below. Three or four sets of resonance frequencies having TEM00q (where TEM means transverse electromagnetic, and q is an integer) modes (Jones, Reference Jones1976b; Komiyama and others, Reference Komiyama, Kiyokawa and Matsui1991) between 14 and 20 GHz were investigated. Errors were minimized by solving equations for multiple resonance frequencies simultaneously to find a unique solution for ɛ with a common sample thickness. The final errors in ɛ were −0.01 ± 0.01; basic component of the error is the systematic error caused by limited widths of the sample. The systematic error was variable with a center at −0.01 and with variability of ±0.01.
2.1.3 Setting the sample in the resonator
We assumed that the core axis coincided with the center of symmetry for the macroscopic dielectric tensor, based on COF results obtained from previous studies. When the angle between the core axis and the electrical field was set to 45°, two resonant peaks could be detected, depending on the anisotropic permittivity components (Fig. 1a). These ordinary and extraordinary components of radio birefringence corresponded to the ɛ in the horizontal and vertical directions, respectively. Since an ice crystal will exhibit uniaxial symmetry of ɛ around the c-axis, the degree of c-axis clustering around the vertical direction could be estimated by finding the macroscopic ɛ values in both horizontal and vertical directions. In the case of the vertical slab section measurements, we were able to measure ɛ continuously by moving the ice core sample using a motor. These analyses were conducted at temperatures in the range of −30 ± 1.5°C with a step increment of 20 mm. During the assessment of horizontal disk sections, we rotated each ice sample from 0° to 90° in 10° increments around the core axis (see Fig. 1a) to detect the very small degree of anisotropy in the horizontal plane.
Diagrams showing (a) the dielectric measurement procedures and (b) the core cutting. In (a), E indicates the direction of the electrical field. This field had ordinary and extraordinary components (gray arrows) because of the radio wave birefringence of the ice core. In the process (b), each ice core bag had a nominal length of ~500 mm, but bags which had been cut into two pieces as a result of core breaks during drilling were selected. Sections <100 mm long were used for horizontal disk measurements while the longer sections were used for vertical prism measurements and cut into a rectangular prism shape. The dark gray arrows indicate the direction of the beam.

2.1.4 Advantages of the method
There are several clear advantages to this method. Firstly, it provides macroscopic information regarding the COF based on the analysis of bulk ice cores. Compared with the examination of thin sections (~0.4 mm in thickness) using fabric analyzers, the bulk specimens in the work reported herein were more than 100 times larger (up to 74 mm thick). Consequently, the statistical validity of the COF data was improved. Secondly, this new process is nondestructive and so the same samples could be examined with this technique and with other nondestructive methods such as line-scanning (e.g. Takata and others, Reference Takata2004) or dielectric profiling (Moore and Paren, Reference Moore and Paren1987; Wilhelms and others, Reference Wilhelms, Kipfstuhl, Miller, Heinloth and Firestone1998). In addition, repeated measurements could be performed using the same specimen before sending the core for destructive testing, such as continuous flow analyses for water isotopes, chemical constituents, dust and gas components (e.g. Dallmayr and others, Reference Dallmayr2016). Thirdly, this process allows rapid, simple and continuous COF analyses. In contrast, acquiring COF information with thin sections requires hundreds of such sections to be prepared to obtain data with similar statistical significance. In fact, the new bulk volume measurement system detailed herein and conventional thin section measurements are considered to be complementary, since the former provides more statistically significant data while the latter allows the behavior of individual crystal grains to be monitored.
2.2 Sample preparation
2.2.1 Ice core samples
Dome Fuji is the dome summit of the Dronning Maud Land ice sheet in East Antarctica (77°22′S, 39°37′E, 3810 m above sea level, mean annual temperature of −54.4°C). In the second deep ice core acquisition at this site, a 3035 m long core was drilled during the period between 2004 and 2007 (Motoyama, Reference Motoyama2007; Dome Fuji Ice Core Project Members, 2017) and the resulting DF2 deep ice core sample was used in the present study, with a diameter of ~94 mm. It should also be noted that previous comprehensive studies of the COF (Azuma and others, Reference Azuma1999, Reference Azuma and Hondoh2000) were performed using a 2503 m long core drilled between 1993 and 1997, referred to herein as the DF1 deep ice core, and the boreholes for the DF1 and DF2 cores were only 30 m apart. The DF2 samples were preserved in a cold room at the National Institute of Polar Research (NIPR), Japan, at a temperature of −50°C to avoid deterioration. Seven samples were selected from this core, corresponding to depths between 1000 and 2000 m (Tables 1 and 2), with the aim of assessing the performance of our new method along the depth direction of the core. An ice core with a length of ~500 mm was used to obtain two specimens: one for the horizontal disk plane measurements and the other for the vertical prism measurements (see Fig. 1b). The dielectric anisotropy values for the horizontal disks and vertical prism planes reflected the COF anisotropy in the horizontal direction and the degree of c-axis clustering around the core axis, respectively.
Relative permittivity (ɛ h1 and ɛ h2) and dielectric anisotropy (Δɛ (h1−h2)) values in the horizontal plane of a single core sample. Permittivity and dielectric anisotropy values were obtained from data acquired using an orientation that allowed two resonant peaks to be detected, indicating that the principal axis of the permittivity was oriented at an angle of ~45° relative to the electrical field.

Relative permittivity (ɛ v and ɛ h) and dielectric anisotropy (Δɛ (v−h)) values in vertical prism planes of a single core sample, obtained from (a) 0° and (b) 90° rotated measurements. ɛ v and ɛ h correspond to the vertical (meaning the core axis) and horizontal directions, respectively.

2.2.2 Horizontal disks and vertical prisms
The horizontal disk specimens obtained from the ice core were ~37 mm thick and 94 mm in diameter. Here, we use a term thickness to mean thickness of ice in which microwave beam penetrates, with two microtomed surfaces. In the case of the vertical prism measurements, the ice core samples were cut into square prism shapes (see Fig. 1b), with approval from the Dome Fuji Ice Core Consortium (http://polaris.nipr.ac.jp/~icc/NC/htdocs/). The rectangular prism shape was employed to allow irradiation by the microwave beam from two different directions, separated by a 90° rotation angle. It was anticipated that the vertical permittivity, ɛ v, would be unchanged as the orientation of the electrical field with respect to the ice core orientation was varied. Although a slab shape with two parallel microtomed surfaces is a necessary condition for our method, we here prepare prism-shaped samples in order to assess the dielectric properties from two different (orthogonal) orientations. Indeed, two slabs are within a prism-shaped sample. In contrast, we expected that the horizontal permittivity, ɛ h, would exhibit a weak dependence on this orientation. The dimensions of the rectangular prism samples were 71–74 mm × 71–74 mm × 400–440 mm (see Fig. 1b). Note that the edges of cross-section in samples are missing so that the measuring width (58–62 mm) is slightly smaller than sample dimensions. For both the disks and rectangular prisms, parallel planes were microtomed with a precision and accuracy better than 10 μm using a custom-made microtome. Note that the rectangular prisms were fabricated from only seven samples for the purposes of this study.
2.3 Fabric analyzer measurements
We conducted optically-based COF analyses of thin ice sections with an automated fabric analyzer (model G50) manufactured by Russell-Head Instruments (Wilson and others, Reference Wilson, Russell-Head and Sim2003). Each thin section had a thickness of ~0.4 mm and a precisely microtomed surface. These sections were cut from horizontal ice samples and each contained 200–700 crystal grains. A Schmidt net diagram was used to assess the COF data and to compare these data with the results from relative permittivity measurements.
3. Results
3.1 Rotation measurements with horizontal disks
Figure 2 shows typical power intensity data obtained from resonance measurements using a horizontal disk while sweeping the frequency to monitor TEM00q (q: integer) resonance modes. When a specific frequency was found to satisfy the conditions for resonance (Jones, Reference Jones1976a, Reference Jonesb), a peak power appeared, as can be seen in this figure. During this process, the ice sample was rotated around the core axis in 10° steps from 0° to 90° (see Fig. 1a) and twin peaks were observed at rotation angles of 20° and 30°. Detection of these twin resonance peaks demonstrated that Δɛ occurred in the directions orthogonal to the microwave beam, and hence COF anisotropy was also present (Table 1).
Typical resonance power intensity data (after smoothing) acquired from a horizontally cut section of ice. The sample was rotated around the axis of the core in 10° intervals up to an angle of 90°. Panels (a–g) indicate the power intensity data for each rotation angle from 0 to 90°. The two dashed lines in each plot indicate resonant frequencies. See Figure 7 (Appendix A) for additional data obtained from a single ice crystal for comparison.

The results obtained from the horizontal disks are presented in Table 1. Here, the permittivity, ɛ, and dielectric anisotropy, Δɛ (h1−h2), values are those derived from sample orientations in which we could detect the twin peaks. Taking the ID:1065 core sample (where the ID number is the depth in meters) as an example, we identified peaks at rotation angles of 20° and 30°. The permittivity values ɛ h1 and ɛ h2 in Table 1 represent the maximum and minimum values of ɛ in the horizontal plane, while the anisotropy values, Δɛ (h1−h2), equal the differences between these two parameters (=|ɛ h1–ɛ h2|). It should be noted that for all seven samples, Δɛ (h1−h2) was <0.0033. This value is almost 10% of the dielectric anisotropy for a single ice crystal, Δɛ s, at −30°C (0.0334 ± 0.0007, see Appendix A for the basis of the precise values). From Table 1, it is evident that the Δɛ (h1−h2) values did not exhibit a particular correlation with depth. The maximum error range of the ɛ values was −0.01 ± 0.01 as stated above, while the std dev. for the Δɛ (h1−h2) were well below 0.001 for each ice sample. Variations of ɛ and Δɛ along the ice core depths are presented in Figure 3.
Variations in (a) permittivity within the horizontal plane, (b) permittivity within the vertical plane and (c) dielectric anisotropy along the ice core depth. Blue and red lines show 0° and 90° rotated measurements, respectively. The std dev. for each value plotted here are provided in Tables 1 and 2.

3.2 Permittivities along the vertical prisms
3.2.1 Mean values for each prism
The results of vertical prism measurements are summarized in Table 2. Using the square prism-shaped samples, we were able to apply the microwave beam from four different directions (0°, 90°, 180° and 270°). In principle, the 0° and 180° measurements were equivalent in terms of both ɛ v and ɛ h, because these analyses simply involved irradiation with the microwave beam from opposite directions of the prism. Likewise, the 90° and 270° measurements were also equivalent. The upper and lower sub-tables in Table 2 correspond to standard (0°) and 90° rotated measurements, respectively. Here, the mean and std dev. are provided for each ɛ and Δɛ (v−h) determined within ~400 mm, and the permittivities in the vertical and horizontal directions are given the symbols ɛ v and ɛ h, respectively (see Fig. 1a). The anisotropy for each vertical prism, Δɛ (v−h) (=|ɛ v–ɛ h|), was determined to be ~10 times larger than that for each horizontal disk, Δɛ (h1−h2) (see Table 1). The maximum error range of the ɛ values was again −0.01 ± 0.01, while the std dev. for the Δɛ (v−h) were well below 0.001 for each ice sample. The relative magnitudes of Δɛ (v−h) determined for the 0° and 90° rotated measurements varied depending on the core sample. The variations in ɛ and Δɛ (v−h) for the 0° and 90° rotated measurements along the ice core depth are shown in Figures 3b, c. It is apparent that ɛ v increased with increasing depth, while ɛ h was relatively stable (panel b). As a consequence of the different effects of depth on these two components, Δɛ (v−h) also increased with increasing depth (panel c). In addition, Δɛ (v−h) in the vertical planes was significantly larger than that in the horizontal plane (Δɛ (h1−h2)).
3.2.2 Variation of values along each prism
The variations in Δɛ (v−h) along the vertical prisms for the ID:1065 and ID:1838 core specimens are presented in Figure 4. Here, the leftmost panels (a1 and b1) each have a full-scale y-axis that covers the range of Δɛ s values at −30°C (Appendix A), while the rightmost two panels (a2 and b2) provide enlarged views to highlight the small variations in and reproducibility of Δɛ (v−h), which was independent of the 180° change in the beam direction. In these trials, the cores were rotated in steps of 90° around the core axis, and Table 3 gives the mean Δɛ (v−h) values for the ID:1065 and ID:1838 core sections for beam orientations of 0°, 180°, 90° and 270°. In both cases, the reproducibility was excellent, with deviations <0.0001.
Variations in dielectric anisotropy along the ~400 mm long (a1 and a2) ID:1065 and (b1 and b2) ID:1838 core samples, based on continuous measurement using prisms. The samples were rotated about the core axis in 90° steps. The y-axis in each of the two panels on the left (a1 and b1) shows the full scale of the dielectric anisotropy of a single ice crystal while the two panels on the right (a2 and b2) show enlarged views to highlight small variations.

Mean Δɛ (v−h) values for two core sections obtained with various beam orientations

3.3 Comparison with optical measurements
Figure 5 shows Schmidt net diagrams obtained using a fabric analyzer to assess a thin section. The center of each figure corresponds to the vertical (core) axis and one point per grain is plotted. These images indicate that the clustering of the c-axis toward the core axis was strengthened with increasing depth. As expected from the previous study by Azuma and others (Reference Azuma1999, Reference Azuma and Hondoh2000), the single maximum COF exhibited an elliptically elongated distribution. Here, the blue and red lines indicate the main rotation angles at which twin peaks were detected in the relative permittivity measurements and their perpendicular components, respectively. Both the blue and red lines coincide with the long or short axis of the elongated c-axis distributions. Even though the dielectric anisotropy values in the horizontal direction, Δɛ (h1−h2), were small, the anisotropy appeared in the appropriate direction.
Schmidt net diagrams for each ice sample obtained from an automated fabric analyzer using thin sections. Panels (a–g) indicate each Schmidt net diagram for seven samples. The center of each figure corresponds to the core axis, the blue lines indicate the main rotation angles at which twin peaks were detected in relative permittivity measurements while the red lines indicate perpendicular components of the rotation angles. Note that it is possible that the ice core orientations were unintentionally rotated three times at the drilling site between (a) and (b), (c) and (d), and (e) and (f).

4. Discussion
4.1 General trends
Measurements of vertical sections along the core confirmed that Δɛ (v−h) increased with increasing depth. This result is in accordance with previous findings that clustering of the c-axes around the vertical develops to a greater extent at greater depths (Azuma and others, Reference Azuma1999, Reference Azuma and Hondoh2000). Azuma and others (Reference Azuma1999, Reference Azuma and Hondoh2000) also noted that the single maximum fabric showed slight elongation and this same trend was also reported by Fujita and others (Reference Fujita, Maeno and Matsuoka2006) based on polarimetric radio-echo sounding work at the Dome Fuji coring site. Fujita's group demonstrated that the COF anisotropy in the horizontal direction is in good agreement with the degree of birefringence observed in the case of VHF radio waves propagating through an ice sheet. In our study, horizontal sections of the core were shown to exhibit very small but detectable Δɛ (h1−h2) values, equal to ~10–15% of Δɛ (v−h) (Fig. 3c). The direction of this horizontal anisotropy coincided with the long or short axis of the elliptically elongated single-pole maximum observed using an optically-based ice fabric analyzer (Fig. 5).
4.2 Cause of vertical anisotropy
The appearance of, and increase in, Δɛ (v−h) with increasing depth can be explained by the rotation of the c-axis toward the core axis as a result of uniaxial compression. Prior studies of the COF in deep ice cores at dome summits have indicated that the distribution of the c-axis will become more concentrated in the direction of the core axis with increasing strain (i.e. at greater depths) (e.g. Thorsteinsson and others, Reference Thorsteinsson, Kipfstuhl and Miller1997, Azuma and others, Reference Azuma1999, Durand and others, Reference Durand2007). This trend was confirmed by our dielectric measurements, even though the methodology was both new and very different. In the future, we intend to use this novel technique to conduct detailed, continuous high-resolution measurements along the depth direction of the DF2 core, with the aim of investigating the development of the COF and comparing this development with other physical and chemical properties of the ice. Considering the advantages discussed in the preceding sections, dielectric measurements are expected to rapidly provide a large quantity of data concerning the COF, which should supplement the results obtained with fabric analyzers.
4.3 Cause of horizontal anisotropy
In the case that an ice sheet is deformed under a uniform uniaxial compressional field, horizontal anisotropy should not appear (e.g. Cuffey and Paterson, Reference Cuffey and Paterson2010). However, depending on the extent of lateral strain, the actual ice fabric will typically show an elliptically elongated single-pole fabric. The maximum surface of the Dome Fuji station slopes toward the east-northeast (Fujita and others, Reference Fujita, Maeno and Matsuoka2006). Thus, the main strain component in Dome Fuji is lateral extension toward the maximal slope direction. We hypothesize that Δɛ (h1−h2) is caused by the anisotropy of the lateral stress field.
In our measurements, the magnitude of Δɛ (h1−h2) was not correlated with depth but rather remained approximately constant. This result implies that stress or strain patterns in the upper 2000 m of ice at the drilling site were not changed significantly on the timescale associated with glacial and interglacial periods spanning ~210 k years.
4.4 Depth-dependent variations in vertical anisotropy
This work identified fluctuations in Δɛ (v−h) on the scale of 10–100 mm during continuous measurements using the vertical prisms (see Figs 4, 6). Because Δɛ (v−h) represents the degree of c-axis clustering, there were evidently small variations in the COF in these layers on the same scale. Using the conventional thin-section method, it is very difficult to detect these small variations. In fact, this would require assessing the COF based on examining a huge number of crystal grains to establish statistically significant data. It is not immediately clear what factor or factors caused the layer-by-layer scale variations in the COF. Such information will have to be obtained from future investigations using this new methodology. It is possible that the small fluctuations in c-axis clustering were associated with various physical and chemical phenomena, such as the effects of ions (including Cl−, F− and NH4+), the presence of dust, grain size and shape, the initial COF formed in the firn, the nonlinear feedback relationship between the COF and various strains and, more likely, the complex interplay between all these factors.
Comparisons of DF1 eigenvalues with previous anisotropy measurements. (a) Permittivity values in the vertical and horizontal directions for 0° and 90° rotated measurements. Average values over the ice core volume for each core and DF1 normalized eigenvalues (modified from Azuma and others, Reference Azuma and Hondoh2000) are shown. Dashed and dotted lines correspond to the average values for the three components of the eigenvalue, and the upper and lower permittivity limits in a single ice crystal, respectively. (b) Dielectric anisotropy within the vertical plane and eigenvalue anisotropy, Δa(2) = a1(2)–(a2(2) + a3(2))/2, dielectric anisotropy at a 350 m depth in the DF1 ice core (Matsuoka and others, Reference Matsuoka, Mae, Fukazawa, Fujita and Watanabe1998) and at a 100 m depth in polar firn (Fujita and others, Reference Fujita, Okuyama, Hori and Hondoh2009).

The relative magnitudes of Δɛ (v−h) values for 0° and 90° rotated measurements were found to change depending on the core sample, and this effect is attributed to core rotation at the drilling site. Typically, the core direction is maintained during drilling and ice core processing, but the drilling orientation can occasionally be accidentally disrupted depending on the core conditions (e.g. irregular break of the core bottom, meaning that the drillers are unable to reconstruct the core orientation). Inspecting the driller log, we estimated that this type of accidental breakage of the core orientation occurred at least once to several times over depths of 1000–2000 m at Dome Fuji. Whether ɛ h in the vertical prism is closer to ɛ h1 or ɛ h2 in the horizontal direction depends on the occurrence of a core rotation event and its degree. Nonetheless, the small fluctuations in the standard 0° and 90° rotated measurements appeared to be correlated in each core (see Appendix B). This observation implies that the strain patterns in the vertical direction were similar for the two orientations associated with ɛ h1 and ɛ h2 throughout the core.
4.5 Possibility of dielectric anisotropy as a direct indicator of COF
Figure 6 compares our obtained dielectric properties with normalized eigenvalues determined for the DF1 ice core sample (Azuma and others, Reference Azuma and Hondoh2000) and with previous dielectric measurements performed using Dome Fuji cores, a single point measurement by Matsuoka and others (Reference Matsuoka, Mae, Fukazawa, Fujita and Watanabe1998) and the firn core data reported by Fujita and others (Reference Fujita, Okuyama, Hori and Hondoh2009). Panel (a) presents the values of ɛ h, ɛ v and ɛ a (the average permittivity) and the normalized eigenvalues a1(2), a2(2) and a3(2) (modified from Azuma and others, Reference Azuma and Hondoh2000). Here, we define ɛ a as the average permittivity over the entire ice core volume, ɛ a = ɛ v/3 + 2ɛ h/3, and a3(2) as the eigenvalue close to the vertical direction. The magnitude of a3(2) essentially indicates the axial concentration of the c-axis toward the core axis. It should also be noted that, in the case of the normalized eigenvalues, we have

In this section, we confirm the relationship between the normalized COF eigenvalues and the tensorial values of the relative permittivity in the ice sheet. The tensorial value of the relative permittivity in a single crystal of hexagonal ice in the principal coordinate system is

Here, ɛ ⊥ and ɛ ‖ are the relative permittivity of ice when the electrical field vector is perpendicular and parallel to the c-axis, respectively. The dielectric anisotropy for a single ice crystal, Δɛ s, is then

Theoretically, the principal axes of the COF will not exactly coincide with the orthogonal coordinates (x, y and z) of the ice sheet. However, in the case that one of the principal axes, a3(2), is very close to the z-axis, as in the COF at Dome Fuji, a3(2) can be assumed to run in the vertical direction while the two other axes, a1(2) and a2(2), can be considered to be aligned horizontally. If both a1(2) and a2(2) are on the horizontal (x and y) plane, then the depth profile of the relative permittivity tensor along the three principal axes can be expressed using the normalized eigenvalues as

which is equal to

For a single-pole COF, the dielectric anisotropy, Δɛ (v−h), is

assuming that ɛx ≅ ɛy. This equation can be revised to

Therefore, Δɛ (v−h) for a single-pole fabric should be proportional to (a 3(2) − (a 1(2) + a 2(2))/2) over the full range of Δɛs values from 0 to 0.0334 (Appendix A). Based on this, panel (b) shows the Δɛ (v−h) and eigenvalue anisotropy values. Here, we define the eigenvalue anisotropy as Δa(2) = a3(2) − (a1(2) + a2(2))/2 on the basis of panel (a), and Δɛ (v−h) is compared with Δa(2). In the case that the c-axis of each grain is clustered toward the core axis (i.e. in the vertical direction), Δɛ (v−h) and Δa(2) should approach 0.0334 and 1, respectively. In panel (a), the trends exhibited by the ɛ v and ɛ h data are in good agreement with the eigenvalues a1(2) and a2(2), a3(2), respectively. The increasing trend shown by the Δa(2) values also agrees well with the trend exhibited by the Δɛ (v−h) data. The differences in the Δɛ (v−h) values obtained from 0° and 90° rotated measurements were much smaller than the variations in the eigenvalues. Thus, these data suggest that ɛ v, ɛ h and Δɛ (v−h) can be used directly as substitutes for the normalized eigenvalues without any intermediate analyses of the individual crystal grains constituting the COF.
A clear advantage of using Δɛ (v−h) as an indicator of Δa(2) is that the former parameter can be determined with a high degree of precision, such that small layer-by-layer changes in the COF can be ascertained. When evaluating the COF in the vertical plane and examining depth variations, the horizontal anisotropy, Δɛ (h1−h2), is an apparent cause of errors. However, these errors are only ~10–15% of Δɛ (v−h) (Fig. 3c) at most. Unintended core rotations occur relatively rarely (only a few times over the depth range from 1000 to 2000 m), and so it should be possible to observe fluctuations in the COF along a continuous ice core section over a length of several hundred meters. The angle of these accidental rotations is almost random and so the errors associated with Δɛ (h1−h2) will be systematic, smaller than Δɛ (h1−h2), and random, and will occur at the frequency noted above. Nevertheless, even if potential effects from core rotation are present, it is still possible to clearly observe small spatial variations in COF clustering around the vertical direction (Appendix B). Thus, the new method reported herein is a powerful tool for the rapid investigation of the COF along a very long ice core, and Δɛ (v−h) and Δɛ (h1−h2) adequately represent the degree of c-axis clustering and horizontal anisotropy. Therefore, we suggest that the present technique could represent a very useful opportunity to better understand the COF in ice cores and thus in polar ice sheets.
5. Conclusion
This work demonstrates a new methodology for the investigation of the COF in ice sheets, based on determining the tensorial components of the relative permittivity using an open resonator. This system can provide information related to the COF in bulk ice cores, employing sections at least 74 mm thickness. This method is applicable to the continuous nondestructive analysis of the COF on a centimeter scale in a layer-by-layer manner.
Dielectric anisotropy (Δɛ) measurements were conducted using ice core samples recovered at Dome Fuji in East Antarctica. The data showed increases in Δɛ (v−h) with increasing depth, and this variable represented the degree of c-axis clustering around the core axis. Based on the results, the c-axes were determined to cluster toward the core axis due to the grain rotation caused by uniaxial compression. Small fluctuations in Δɛ (v−h) on the centimeter scale were detected throughout a core sample on the basis of continuous measurements. Analyses of horizontal disk sections indicated that Δɛ (h1−h2) was ~10–15% of Δɛ (v−h). The dielectric and fabric anisotropy in the horizontal direction are attributed to lateral extension stress in the maximum slope direction at Dome Fuji. The trends exhibited by the ɛ v, ɛ h and Δɛ (v−h) values in the depth direction of the ice core depth were in agreement with those found for normalized eigenvalues obtained using an ice fabric analyzer. Therefore, the dielectric properties examined in this work (ɛ v, ɛ h and Δɛ (v−h)) can be used as substitutes for the normalized eigenvalues with only minimal uncertainties of 0.02 (0.7%) for ɛ v and ɛ h and 0.001 (2.7%) for Δɛ (v−h).
The direction of the dielectric anisotropy, Δɛ (h1−h2), in the horizontal plane was in good agreement with the long or short axis of the elongated single-pole maximum COF obtained using an ice fabric analyzer. However, the direction of Δɛ (h1−h2) varied depending on the core sample, as a consequence of the accidental core rotation that occurred at irregular core breaks, because orientation continuity was not guaranteed at the core drilling site. Thus, Δɛ (h1−h2) was a potential source of error when evaluating Δɛ (v−h) values. However, this effect was limited because the magnitude of the error was smaller than Δɛ (h1−h2). In addition, even with the effect of this potential small error, it was still possible to observe small variations in cluster strength along the c-axis. Therefore, the tensorial measurement method using dielectric anisotropy as demonstrated herein should be applicable to the investigation of COF development in ice cores, supplementing the knowledge obtained from modern fabric analyzers.
Acknowledgements
We thank the scientific editor S.H. Faria, associate chief editor R. Greve and F. Wilhelms and one anonymous reviewer for helpful comments and suggestions. We thank all the Dome Fuji Deep Ice Core Project members who contributed to obtaining the ice core samples, either through logistics, drilling or core processing. The main logistics support was provided by the Japanese Antarctic Research Expedition (JARE), managed by the Ministry of Education, Culture, Sports, Science and Technology (MEXT). This work was supported by JSPS KAKENHI grant No. 18H05294.
Author contributions
T.S. performed laboratory measurements and wrote the paper. S.F. designed the experimental equipment and wrote the paper. R.I. performed laboratory measurements about the error estimation. All authors joined in the discussion.
Appendix A
Dielectric properties of a single ice crystal
In this work, the dielectric properties of a single ice crystal were assessed, using a value of 0.0334 (±0.0007) for the dielectric anisotropy of a single ice crystal (Δɛ s). The discussion here explains the basis of this value. The anisotropic high-frequency-limit permittivity of a hexagonal ice crystal has been reported in the literature (Fujita and others, Reference Fujita, Mae and Matsuoka1993, Reference Fujita, Matsuoka, Ishida, Matsuoka, Mae and Hondoh2000; Matsuoka and others, Reference Matsuoka, Fujita, Morishima and Mae1997). Here, we extended the open resonator measurement performed by Matsuoka and others (Reference Matsuoka, Fujita, Morishima and Mae1997) to the wide temperature range between −150 and −15°C which includes the temperatures encountered in the Earth's cryosphere. These measurements were performed by one of the authors (S.F.) in 2001–2002 at the Department of Applied Physics, Hokkaido University, Sapporo. The experimental setup was basically the same as had been used in previous work, and the sample was a naturally formed single ice crystal collected at the Mendenhall Glacier in Alaska. This crystal had a disk shape with a Φ60 mm and a thickness of 4.92 mm, and the c-axis was determined to be perpendicular to the disk axis based on optical analysis, within an error of less than a few degrees. During the measurement process, the temperature of the sample was varied continuously from −150 to −15°C over a time span of 200 h in a freezer. Data were acquired with an applied frequency of ~34 GHz and the half power width diameter of the Gaussian beam was 22 mm, meaning that the 2σ diameter of the beam was 44 mm, which was much smaller than the sample diameter. Examples of the typical twin resonance peaks for the sample are provided in Figure 7, from which it is evident that the separation between the two peaks was much more distinct than in the case of the data for the horizontal disk sample in Figure 2. The two components, ɛ ⊥ and ɛ ‖, of the relative permittivity for the single ice crystal were determined with the electrical field perpendicular to and parallel to the c-axis, respectively. These two components are presented in Figure 8 along with the data from earlier works concerning analyses of single crystals. Δɛ s ( = ɛ ‖–ɛ ⊥) values are provided in Figure 9, and indicate that Δɛ s reached a minimum at ~−75°C. It should also be noted that the possible uncertainty in Δɛ s (±0.0007) was much smaller than those associated with ɛ ⊥ or ɛ ‖ (±0.005) because the frequency difference between the two peaks could be determined precisely and unambiguously. Typical data are summarized in Table 4. These extended data are expected to be useful with regard to both the analysis of ice cores for the COF and remote radar-based sensing of hexagonal ice.
Examples of typical twin resonance peaks data acquired at −145 and −15°C.

The two components of the relative permittivity, ɛ ‖ and ɛ ⊥, parallel and perpendicular to the c-axis. Earlier data are shown for comparison. Estimated errors are indicated by error bars for each data point.

Extended and improved Δɛ s data indicating the effect of temperature and a minimum at ~−75°C.

Dielectric properties of a single ice crystal.

Appendix B
Variations in dielectric anisotropy within a vertical prism
Variations in Δɛ (v−h) along the ~400 mm long cores for all seven samples are plotted in Figure 10, showing fluctuations with scales of 10–100 mm. The relative magnitude of Δɛ (v−h) values for the 0° and 90° rotated measurements varied depending on the core sample. The possible error for each Δɛ (v−h) value here is again <±0.001. The core mean values are shown in the legend of each figure. Note that the difference between Δɛ (v−h) values obtained by the 0° and 90° rotated measurements are exaggerated in these panels and were in fact minimal. The small fluctuations in both measurements appear to be correlated in each core sample.
Variations in dielectric anisotropy along the ~400 mm long core samples. Panels (a–g) indicate each variation for seven samples. Red and blue lines correspond to 0° measurements and 90° rotated (about the core axis) measurements, respectively.


 Open access

