

Racial norms are often the central organizing principle of life in prison, dictating where people sleep and with whom they live, eat, and socialize (Walker Reference Walker2016). Interactions between individuals and groups in prison, operating at both the institutional and interpersonal level, actively assign racial status and continuously reinforce it, resulting in a racially segregated environment (Wacquant Reference Wacquant2005; Walker Reference Walker2016; Infante et al. Reference Infante, Morse, Fahmy and Wright2023). Yet while the racialized nature of prison life has been described from myriad perspectives, there is little evidence on how to effectively remediate these divisions. In this study, we argue that higher education in prison holds significant potential to improve racial attitudes and foster racial integration by providing a “contrasting context” of positive interracial contact within a broader institution where racial segregation is both explicitly and implicitly maintained. More specifically, we suggest that students’ interactions in prison higher education satisfy the scope conditions of intergroup contact that have been shown to successfully reduce outgroup bias (that is, interactions that are of equal status, sanctioned by legitimate authority, and with collective goals pursued through cooperation) (Allport Reference Allport1954). Using administrative data on college-level course completion, an original longitudinal survey of 323 male students in a prison college, and qualitative interviews with twenty-seven formerly incarcerated alumni, we show evidence of between-subject shifts in racial attitudes that coincide with the number of college classes taken. Specifically, we find evidence suggesting that prison higher education can diversify individuals’ social networks and shape racial perceptions during incarceration.
Our mixed methods approach provides a dynamic picture of the role that the contrasting context of higher education in prison can play. This work is particularly timely, as postsecondary prison programs have grown rapidly in recent years, due in part to the restoration of Pell Grant eligibility for incarcerated students.Footnote 1 This change comes nearly thirty years after eligibility was rescinded in the 1994 Crime Violent Crime Control and Law Enforcement Act, as part of a divisive and racially coded “tough-on-crime” political agenda (Hurwitz and Peffley Reference Hurwitz and Peffley2005; Wheelock and Hartmann Reference Wheelock and Hartmann2007; Yates and Lakes Reference Yates and Lakes2010; Lerman and Weaver Reference Lerman and Weaver2014).Footnote 2 Our results illustrate that prison higher education can have effects that go well beyond basic outcomes such as recidivism and employment, which are frequently the primary (or even the sole) focus of prison program evaluations (Castro Reference Castro2018), demonstrating the significant potential of higher education to influence racial integration in carceral spaces.
The legacy of prison as a racialized institution, with a focus on California
Scholars have attributed the deep racial divisions that operate inside American prisons to a range of factors, citing the dimensions of historical context, formal rules, and informal norms that work to establish and uphold a racialized order. Historically, scholars situate prisons as the products of a long legacy of unequal law enforcement that has led to the over-incarceration of racial minorities, with Black men, in particular, being targeted for criminal justice interventions (Kennedy Reference Kennedy1997; Roberts Reference Roberts2003; Alexander Reference Alexander2010; Miller Reference Miller2014). In this vein, Black prisoner activist movements, such as those led by Malcolm X, the Black Panther Party, and George Jackson, explicitly framed incarceration as a reflection of the broader abuses that Black communities experienced outside prison (Berger Reference Berger2014). They argued that the segregated prison environment could be seen as a reflection of the nation’s complicated legacy of colonialism, slavery, and decades of racially motivated policies aimed at promoting racial stratification and separation (Berger and Losier Reference Berger and Losier2017; Saad Reference Saad2017). In this way of thinking, prison administrators, officers, and incarcerated individuals do not independently create racial norms; they inherit them, as the “roots of the segregated prisons lie deep in the Southern history of slavery and explicit racial subordination” (Spiegel Reference Spiegel2007, 2269).
Prisons in the United States also operated under formalized models of segregation long after the broader society began to desegregate in the 1960s. Until recently, for example, prisons explicitly segregated individuals by race when assigning housing, as prison officials feared that integrated cell assignments would result in race-based gang violence and upset the norms of racial segregation that had long operated inside prison (Schevitz Reference Schevitz2008). In California, the end to this policy came only in 2005 when the US Supreme Court declared that racial classification alone could not dictate cell assignments for individuals in the state’s prisons and could instead only be applied “under extraordinary circumstances to ensure the safety and security of inmates, staff, and institutions” (Trulson et al. Reference Trulson, Marquart, Hemmens and Carroll2008, 273). However, even though the California Department of Corrections and Rehabilitation (CDCR) agreed to implement the Integrated Housing Program (IHP) in that same year, evidence suggests that racial classifications continued to be a predictor of housing practices for at least the remainder of the decade (Lindsey Reference Lindsey2009). During that time, officials assigned more than half of the population in some California prisons to race-segregated cells based on perceived involvement with race-based violence or gangs (Stoltze Reference Stoltze2008). This hyper-attentiveness to race signaled its continuing importance in California’s prisons (Goodman Reference Goodman2008).
More broadly, the CDCR continued to require every incoming individual to be classified as belonging to one of roughly four racial categories depending on the facility where they are classified: generally Black, White, Hispanic, or “Other” (Goodman Reference Goodman2008; Ngaaje Reference Ngaaje2021). This rigid racial classification system can be jarring for individuals entering prison given that, for many people, racial identification occurs through a more nuanced process informed by historical and contemporary forces (Omi and Winant Reference Omi and Winant2014) and is therefore “cloaked … in culture, community, and politics” (Richmond and Johnson Reference Richmond and Johnson2009, 567). For many, racial identity is not as simple as picking a skin color or single categorization from a list of options, making the CDCR’s racial classification process into an uncomfortable “negotiated settlement” (Goodman Reference Goodman2008, 737).
The prison system’s requirement to “pick a side” can be consequential, as racial identification has profound implications for many aspects of prison life. Even when not explicitly written into correctional procedures, segregation is so deeply embedded that it functions as de facto policy in many institutions (Goodman Reference Goodman2008). Prison “codes” maintain that, once a newly incarcerated individual has selected their racial classification, a specific intra-racial peer group follows.Footnote 3 Unwritten rules and boundaries are then passed down, with incarcerated individuals orienting newer individuals of their same racial group to the norms of racial classification and segregation (Trammell Reference Trammell2012). After entering prison, incarcerated individuals come to understand these strictures, such as which showers are acceptable for them to use, which tables they can sit at in the chow hall, which areas of the yard they are welcome to visit, and with whom they may socialize. In each of these aspects of prison life, race is both spatialized and segregated (Charles Reference Charles2003; Goodman Reference Goodman2014; Walker Reference Walker2016).Footnote 4
Scholars have different views as to the functionality of this contemporary racialized prison code. Some believe it serves as a way of orienting people in prison to an oppressive environment, promoting solidarity among racially congruent people and dictating the terms of interactions between racially incongruent groups (Wacquant Reference Wacquant2001; Alexander Reference Alexander2010; Bobo and Thompson Reference Bobo, Thompson, Rose Markus and Moya2010; Phillips Reference Phillips2012; Goodman Reference Goodman2014; Walker Reference Walker2016; Bloch and Olivares-Pelayo Reference Bloch and Alan Olivares-Pelayo2021). Others position the racial prison code as a result of intergroup competition for scarce resources, noting that it is reinforced by the distribution and withholding of resources within and between racial groups (Lewis Reference Lewis2003; Trammell Reference Trammell2012; Skarbek Reference Skarbek2014; Walker Reference Walker2016; Kreager and Kruttschnitt Reference Kreager and Kruttschnitt2018). Certainly, one of the most concerning views of racial boundaries in prison is their role in structuring prison violence. The over-incarceration of racial minorities over the last half-century, alongside formal and informal segregation within many prisons, has served to feed racial tensions (Clear Reference Clear1996). In California, for example, which houses the country’s second-largest prison population (Bureau of Justice Statistics 2021), state prisons are “ground zero” for virulent race-based gangs and racialized violence (see, for example, Hunt et al. Reference Hunt, Riegel, Morales and Waldorf1993; Skarbek Reference Skarbek2012). Indeed, scholars have consistently described individuals in California prisons as being engaged in “a constant war of race against race” (Goodman Reference Goodman2014, 355).
Racial classification and segregation have long been understood as tools for safety, with incarcerated individuals relying on the protection and associational benefits offered by perceived loyalty to their racial group (Carroll Reference Carroll1974; Richmond and Johnson Reference Richmond and Johnson2009; Trammell Reference Trammell2012; Poor, Woods, and Williams Reference Poor, Woods and Williams2017, 14:56). Individuals are expected to abide by the racialized prison codes that structure life in prison to secure those benefits (Goodman Reference Goodman2008; Phillips Reference Phillips2012; Trammell Reference Trammell2012; Bloch and Olivares-Pelayo Reference Bloch and Alan Olivares-Pelayo2021). Racial segregation and racial norms thus serve as a means of structuring behavior to avoid victimization (Trammell Reference Trammell2009; Walker Reference Walker2016). A formerly incarcerated individual at San Quentin State Prison recounts how “inmates who value their own safety must quickly learn to put political correctness aside and to follow certain clearly defined, if unwritten, rules for survival” (Englehart Reference Englehart2005).
The racial sorting and segregation found in America’s prisons are likely to have significant effects on intergroup behavior and attitudes. Indeed, from controlled laboratory experiments to studies of international relations, group-based segregation has been shown to contribute to a range of negative outcomes, from interpersonal discrimination to weakened economies, civil unrest, and violent conflict (Corvalan and Vargas Reference Corvalan and Vargas2015; Enos and Celaya Reference Enos and Celaya2018). Segregation can lead to the erosion of trust and cooperation and can reduce collective problem-solving and productive exchanges between groups (Marschall and Stolle Reference Marschall and Stolle2004; Enos and Celaya Reference Enos and Celaya2018). Segregation can also directly affect perceptions of the “other,” increasing prejudice and a sense of social threat (Enos and Celaya Reference Enos and Celaya2018; Laurence et al. Reference Laurence, Schmid, Rae and Hewstone2019). In fact, segregation has been shown to be a stronger predictor of intergroup conflict than a variety of other salient social cleavages, including “ethnolinguistic fractionalization, polarization, or inequality” (Corvalan and Vargas Reference Corvalan and Vargas2015, 212). Put another way, the prison racial code both results from and contributes to racial dynamics, with prisons serving as a central site of racial construction, reproduction, consolidation, and perpetuation of racial caste (Infante et al. Reference Infante, Morse, Fahmy and Wright2023).
The role of higher education in remediating racial division
In stark contrast to the racialized and segregated prison environment (Liebling and Arnold Reference Liebling and Arnold2012), institutions of higher education are often explicitly designed to encourage meaningful interactions across lines of difference, including between racial and ethnic groups (Harper and Hurtado Reference Harper and Hurtado2007; Bowman and Park Reference Bowman and Park2015). In particular, a liberal arts curriculum can provide students with opportunities to explore, challenge, and affirm previous understandings of race (Watkins Reference Watkins2001; Omi and Winant Reference Omi and Winant2014; Brown and Brown Reference Brown and Brown2015), and college classrooms can be a space where racial politics are actively contested through institutional climate, interpersonal contact, formal and informal policies, and student engagement (Lewis Reference Lewis2003; Brunsma, Brown, and Placier Reference Brunsma, Brown and Placier2013; Larnell Reference Larnell2016). In these ways, higher education can serve to reframe students’ understandings of their racialized social realities and give voice to counter-stories of racial hierarchy (Bernal Reference Bernal2002; DeCuir and Dixson Reference DeCuir and Dixson2004; Ladson-Billings Reference Ladson-Billings2006, Reference Ladson-Billings2014).
Moreover, students who attend racially diverse institutions can transform psychosocially and interpersonally as a result of contact with out-group peers (Chang et al. Reference Chang, Denson, Saenz and Misa2006; Harper and Hurtado Reference Harper and Hurtado2007; Bowman and Park Reference Bowman and Park2015). Interracial contact in the context of a college education is associated with a range of positive and behavioral outcomes, such as reduced intergroup bias (Levin, Van Laar, and Sidanius Reference Levin, Van Laar and Sidanius2003; Pettigrew and Tropp Reference Pettigrew and Tropp2006; Gottfredson et al. Reference Gottfredson, Panter, Daye, Allen and Wightman2009) and diminished social distance between heterogeneous racial groups (McClelland and Linnander Reference McClelland and Linnander2006; Fischer Reference Fischer2011; Bowman and Park Reference Bowman and Park2015). People with more diverse networks also exhibit more trust in others, suggesting that social connections with those of a different race can reduce intergroup prejudices (Ibarra Reference Ibarra1995; Uslaner Reference Uslaner2009; Brannon and Walton Reference Brannon and Walton2013).
The prejudice-reduction effects of interracial relationships can persist well beyond the initial contact. For instance, researchers have found that white students randomly assigned to live with a roommate from a different racial background (van Laar et al. Reference Van Laar, Levin, Sinclair and Sidanius2005; Boisjoly et al. Reference Boisjoly, Duncan, Kremer, Levy and Eccles2006; Towles-Schwen and Fazio Reference Towles-Schwen and Fazio2006) have more positive attitudes toward other ethnic groups, greater heterogeneity in their friendship groups (van Laar et al. Reference Van Laar, Levin, Sinclair and Sidanius2005), and reductions in implicit prejudice (Shook and Fazio Reference Shook and Fazio2008). These effects persist outside the classroom (Milem, Umbach, and Liang Reference Milem, Umbach and Liang2004) and long after graduation (Boisjoly et al. Reference Boisjoly, Duncan, Kremer, Levy and Eccles2006). Moreover, effects of interracial interactions can hold even when accounting for self-selection. White adults from racially segregated neighborhoods who had intentional interracial interactions while attending college were more likely to report close relationships with peers from other racial groups or to live in racially diverse communities (Jayakumar Reference Jayakumar2008; Brannon and Walton Reference Brannon and Walton2013). Likewise, for non-white students, cross-racial interactions can reduce perceptions of stigma associated with their identities and interrupt patterns of exclusion that limit access to high-quality academic enrichment programs (Fuligni and Hardway Reference Fuligni and Hardway2004; Huynh and Fuligni Reference Huynh and Fuligni2012). For students of color, having diverse racial friendships in college is associated with increased intellectual and academic confidence (Antonio Reference Antonio2001) and a greater sense of belonging (Levin Van Laar, and Sidanius Reference Levin, Van Laar and Sidanius2003; Shook and Fazio Reference Shook and Fazio2008).
A theory of contrasting context: Intergroup contact in prison higher education
In the college context, interpersonal contact across lines of difference can be an important factor in shaping subsequent attitudes and behavior. More broadly, when freely enacted, interactions with others who have different backgrounds and life experiences can contribute to a reduction in outgroup bias (Allport Reference Allport1954; Brannon and Walton Reference Brannon and Walton2013). Yet the role of remediation through contact is complex, especially when it occurs in a context adjacent to entrenched spatial segregation, such as when college programs operate inside prisons. For example, while residential segregation can have harmful effects on intergroup attitudes and behavior, so can residential mixing: when Spanish-speaking confederates were randomly assigned to wait on the same commuter train platforms as white Americans in homogeneous communities, the latter group became more supportive of exclusionary policies (Enos Reference Enos2014). Importantly, contact between individuals from different social groups is most effective in reducing negative attitudes toward outgroups under specific conditions—namely when contact is between those of equal status in the pursuit of a collective goal, working cooperatively or non-competitively, and supported by legitimate authorities (Allport Reference Allport1954) (see Table 1). Notably, all of these conditions are regularly violated in a prison context.
Scope conditions to reduce bias in intergroup contact

As already described, equal status between groups does not generally characterize the prison context, as both formal policies and informal norms work to create, uphold, and enforce social stratification. Specifically, myriad hierarchies exist between groups in the prison context, including hierarchies both across and within race-based gangs (Goodman Reference Goodman2014; Mitchell et al. Reference Mitchell, Fahmy, Pyrooz and Decker2017), as well as hierarchies based on housing and sentence length, both of which are correlated with race (Dick, Rich, and Waters Reference Dick, Rich and Waters2016; Bloch and Olivares-Pelayo Reference Bloch and Alan Olivares-Pelayo2021). Likewise, the typical prison does not encourage intergroup pursuits of collective goals and, in contrast, may actually heighten intergroup competition as opposed to promoting cooperation. Indeed, prison has been documented as an “every-man-for-himself” environment where confrontation and violence is negotiated, preempted, and used to reduce the risk of future victimization (Jewkes Reference Jewkes2005; De Viggiani Reference De Viggiani2006; Phillips Reference Phillips2012; Ricciardelli, Maier, and Hannah-Moffat Reference Ricciardelli, Maier and Hannah-Moffat2015). Finally, far from being legitimized and supported, interracial contact is discouraged—and, in some cases, even informally prohibited—in prison housing, work assignments, and recreational areas (Bobo and Thompson Reference Bobo, Thompson, Rose Markus and Moya2010; Goodman Reference Goodman2014; Infante et al. Reference Infante, Morse, Fahmy and Wright2023). Transgressing prison’s racial codes can jeopardize an individual’s physical safety and—if it is considered by an officer to be a “hazard to security” (McKay Reference McKay2019, 150)—might even trigger an administrative violation, providing instrumental reasons for those in prison to avoid the types of interactions that might promote cross-racial understanding (Goodman Reference Goodman2008; Richmond and Johnson Reference Richmond and Johnson2009; Trammell Reference Trammell2009, Reference Trammell2012; Phillips Reference Phillips2012; Walker Reference Walker2016; Bloch and Olivares-Pelayo Reference Bloch and Alan Olivares-Pelayo2021).
In stark contrast to the culture of incarceration, which works against each dimension of Gordon Allport’s (Reference Allport1954) conditions of contact, higher education illustrates the ways in which contact can be operationalized to reduce prejudice. This can position colleges as sites of agency when it comes to influencing curricular, co-curricular, and informal interactions between students (Engberg and Porter Reference Engberg and Porter2013). For example, college faculty can provide opportunities to democratize the classroom, ensuring equal status in ways that allow students—particularly students of color—to engage more openly and to socialize across differences (Ochoa and Pineda Reference Ochoa and Pineda2008; Ro, Knight, and Loya Reference Ro, Knight and Loya2016; Eliason and Turalba Reference Eliason and Turalba2019). Similarly, college staff and faculty can serve as “legitimate authorities” who normalize intergroup interactions and promote a cooperative ethos. Scholars have found greater bias reductions amongst students when colleges officially endorse and enable cross-racial interactions (Chang et al. Reference Chang, Denson, Saenz and Misa2006; Jayakumar Reference Jayakumar2015; Denson, Bowman, and Park Reference Denson, Bowman and Park2017), such as by offering peer-facilitated intergroup dialogues in the context of a multicultural curriculum or diversity course requirement (Denson, Bowman, and Park Reference Denson, Bowman and Park2017). Moreover, intentional institutional investments in interracial social contact, such as through the development of racially mixed extracurricular activities, are associated with greater reductions in stereotypes and prejudiced attitudes than unstructured interracial contact (Levin, Van Laar, and Sidanius Reference Levin, Van Laar and Sidanius2003; Pettigrew and Tropp Reference Pettigrew and Tropp2006; Fischer Reference Fischer2011).
Positioned against the background of prison’s prevalent segregation, we posit that these features of prison higher education can provide the conditions for meaningful change to occur. Specifically, we argue that the conditions of intergroup contact that have been shown to facilitate attitude change (see, for example, Allport Reference Allport1954) can be evidenced in a high-quality college in prison. This contrasting context of the college classroom within the broader culture of the prison presents incarcerated students with a “disorienting dilemma,” that forces them to reassess their assumptions about the motivations of others and challenging their beliefs about prison and the broader world (Mezirow Reference Mezirow1978). In doing so, classroom spaces serve as a reprieve from the racially controlled movements and relationships found elsewhere in the prison. In prison higher education classes, “localized race-based hierarchies [are] suspended,” and incarcerated students develop a “reverence” for class time (Bloch and Olivares-Pelayo Reference Bloch and Alan Olivares-Pelayo2021, 1329).
To test this hypothesis, we draw on data collected from college students in Mount Tamalpais College (MTC), which was formerly the Prison University Project. MTC has been operating in some form at San Quentin State Prison since 1996 and has served over thirty-seven hundred students. The college offers roughly sixty courses that lead toward an associate’s degree, and there are no costs to students for participating (“Our Story” 2022). MTC accepts any incarcerated person with a high school diploma or a general educational development (GED) certificate, conditional on available classroom space at the institution, and most course credits are transferable to four-year colleges and universities outside prison. Approximately three hundred students enroll in classes each semester, which accounts for roughly 7 percent of San Quentin’s all-male incarcerated population (Byrd and McCloud Reference Byrd and McCloud2021). Many of MTC’s students enroll after extended breaks from formal education, and most report negative prior experiences with formal education (Lewen Reference Lewen2008; Lerman and Sadin Reference Lerman and Sadin2022).
Data and methods
To assess whether and how prison higher education can shape racial integration and attitudes, we rely on several sources of data. We begin by briefly reviewing the curriculum and culture of MTC, outlining specifically how it promotes the conditions of bias-mitigating contact. We then present evidence drawn from one-on-one interviews with MTC alumni. To gather these data, we conducted semi-structured interviews in person and by phone with twenty-seven former students of the college who had been released from incarceration.Footnote 5 Invitations to participate in the study were sent to 177 students for whom contact information was available, and participants received a small monetary stipend for their participation. Interviews ranged in length between thirty-five and eighty-five minutes. These data help illuminate the features of prison higher education’s contrasting context and highlight some of the ways in which Allport’s (1954) scope conditions are operationalized (that is, through the mission statement, the student code of conduct, the curriculum, the pedagogy, teacher-student support, and peer-to-peer mentorship) that might explain increased social integration and improved racial attitudes.
In our quantitative analyses, we then present results from two phases of a survey conducted in the winters of 2018 and 2019, which were distributed to both matriculated and waitlisted students. Of approximately 730 active students eligible to participate in the study, 242 students completed the Phase I survey—a 33.5 percent overall response rate and a 60 percent response rate for the subset of students who were still on the waitlist and had not yet taken any college courses. We combined the respondents from both phases for a total sample of 329 respondents. Demographics for survey respondents, including racial and ethnic identity, are comparable to the total population of incarcerated students (see Appendix A).
The MTC application process is unusual, in that acceptance into the college is based solely on the order in which eligible individuals apply. As such, students with a high school diploma or a GED certificate can sign up for a spot on the MTC waitlist using an accessible application and they will be automatically accepted. They then matriculate into the next available cohort that has space to accommodate them. We leverage this ordered waitlist in our analysis by comparing the subset of students at the top of the waitlist who have just been accepted into MTC but have not yet taken any classes (the control group of “waitlisted students”) to students who have most recently matriculated off the waitlist and have just completed their first year of classes (“new students”), as well as to more veteran students (the “experienced” group who have completed five classes or more). We expected that, on average, students who recently entered the college should be similar to those on the waitlist since the only thing determining their matriculation was the date they requested to be placed on the waitlist. Checking for differences across student groups, we find this assumption holds. However, we do find that more experienced students (five or more classes) are slightly older, more likely to be incarcerated on a violent charge, and more likely to be Black relative to waitlisted students (see Appendix B). As such, we also present models that control for these factors.
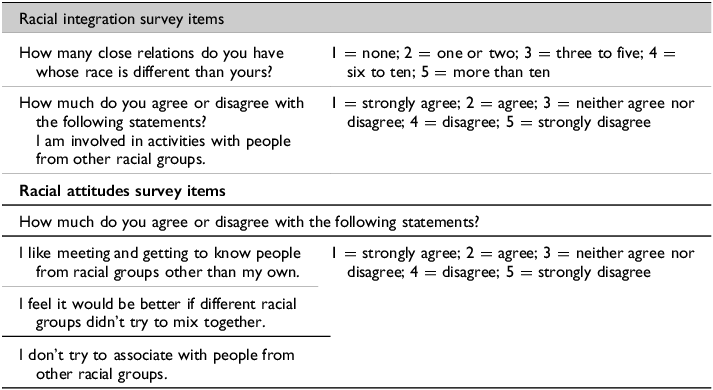
In our analyses, we examined whether prison higher education is associated with two distinct areas of change: racial integration and racial attitudes. We operationalized racial integration with two survey questions, measuring whether students engage in activities with racially diverse groups and the extent to which they have close relationships with individuals of a different race. We explored racial attitudes with three survey questions, which measured the extent to which students enjoy meeting and getting to know people from different racial groups, whether they feel it would be better if different racial groups did not mix (reverse coded), and whether they try to associate with people from other racial groups. The full text of all survey questions and response options is provided in Table 2.
Survey questions

We also conducted exploratory analyses to identify heterogeneous effects in how prison higher education might shape these outcomes. Specifically, we examine whether students from different racial groups (white versus non-white) and of different age groups (thirty-five and under versus over thirty-five) appear to respond differently to the potentially socializing effects of the prison environment. Our analyses of these questions are preliminary, given the small sample size of our non-white and younger subgroups. However, they illustrate potentially fruitful avenues for future research and engage with important literature on the ways in which race (see, for example, Durante Reference Durante2021; Rucks, Harding, and Harris Reference Rucks-Ahidiana, Harding and Harris2021; Bloch and Olivares-Pelayo Reference Bloch and Alan Olivares-Pelayo2024) and age (see, for example, Knight Reference Knight2024; Murolo Reference Murolo2024) can condition the experience of incarceration.
Qualitative results: the contrasting context of prison higher education
In many ways, the MTC classroom is an optimal context for helping students overcome racial segregation and prejudice: all students hold equal status; they cooperate in pursuit of a collective learning goal; and the liberal arts curriculum and norms of interpersonal respect are endorsed by legitimate authorities (that is, teachers and administrators). These features of MTC starkly contrast the broader prison culture, where status hierarchies are maintained through both formal and informal rules, racial groups are positioned in opposition to one another, and authorities do not actively promote—and, in some ways, actively undermine—racial integration that might foster interracial understanding. This is clear when we analyze information on MTC’s pedagogical approach, classroom culture, and curriculum, which together are designed to provide a rigorous, high-quality liberal arts education. Classrooms have open seating arrangements, allowing students to select their own seats at the beginning of each class period. Correctional staff are stationed at the entrance to the education building and perform roll call during the class period, but they are not present in the classroom during educational periods. The pedagogical approach is intentionally “student-centered, trauma-informed, and culturally-responsive” (“Faculty” 2025), and both curriculum and culture allow and encourage students to question the rigid racial codification of the prison space.
In these ways and others, MTC’s classes provide a radically contrasting context from the broader prison environment. Areas of the prison that are racially segregated due to both norms (for example, the yard) and policy (for example, housing units) stand in clear contrast with the racially diverse educational spaces of the college where students can temporarily shed the hierarchical, identity-based affiliations common elsewhere in the prison (Moore Reference Moore2015; Simpkins Reference Simpkins2015). This idea is formally incorporated into MTC’s mission statement and goals, in that the college “aims to challenge popular myths and stereotypes about people in prison; to publicly raise fundamental questions about the practice of incarceration; and to incubate and disseminate alternative concepts of justice, both within and beyond the academy” (“Mount Tamalpais College General Catalog” 2020–21).Footnote 6 Below, we further outline the ways in which the specific scope conditions of positive contact are operationalized in prison higher education, through descriptions of MTC’s curriculum, pedagogy, classroom culture, and students’ experiences as described in the college’s documents and our qualitative interviews.
Equal status
In contrast to the broader prison environment, MTC’s classroom culture explicitly recognizes that all students have equal status, regardless of race, ethnicity, or other characteristics. Its mission statement clearly affirms that “all people should have access to affordable higher education, and the opportunity to develop their human potential.” One of the college’s core values is “human dignity,” which emphasizes the school’s aim to “honor the individuality and unique backgrounds and viewpoints of every person, and believe every human being has intrinsic value.” In doing so, faculty and staff “strive to promote a vibrant and diverse community based on mutual respect and trust” (“Mission and Vision” 2025). Students are informed of these equity norms before they matriculate, along with the school’s nondiscrimination policy that states: “Mount Tamalpais College does not condone discrimination with regard to race, color, national origin, religion, sex, sexual orientation, age, disability or veteran status in enrollment or employment, nor in the educational programs or activities which it operates” (“Mount Tamalpais College General Catalog” 2020–21).
In our qualitative interviews, students highlighted the importance of these sentiments, how they manifest in practice, and how teachers made them feel like people, not prisoners, no matter their background: “[T]hey saw the value in us, unlike most of society.”Footnote 7 Many students reflected on how the ways in which they were treated in the classroom differed markedly from elsewhere in the prison, describing the transition of walking into the classroom as if “you’re no longer in prison, you’re in school.”Footnote 8 Once in the classroom, “you’re treated pretty much with respect and no one cares what you did.”Footnote 9 This was a notable departure from how many students were used to being treated: “There were people who, including myself, that [are] used to be treated in a certain way. Then [in school], people treat you like a human being.”Footnote 10 The character of teacher-to-student interactions likewise stressed students’ humanity and norms of equality among groups. One student recalled that teachers “always treated us like human beings. You weren’t a number when you went into class. You were an individual. Your work spoke for itself.”Footnote 11 Students also noted that respect within the college was not based on perceptions of intellectual ability or past educational attainment. To the contrary, “wherever [students] were at, the staff were willing to meet them.”Footnote 12 In seeing all students as inherently worthy, regardless of race, students noted that teachers emphasized their shared humanity: “[T]here’s a sense of respect for everyone.”Footnote 13
Cooperative pursuit of collective goals
In addition to an emphasis on equal status within the classroom, the idea of cooperation toward shared goals is also core to the college’s ethos. The expectation that all students, teachers, and administrators must contribute to the “community’s standard of integrity” (“Mount Tamalpais College General Catalog” 2020–21) and a commitment “to creating and maintaining an intellectual community in the prison in which all persons who participate in college programs and activities can work together” safely are cornerstones of MTC (“Mount Tamalpais College General Catalog” 2020–21). Many individuals reflected that shared community goals were part of being a MTC student as one student remarked: “[I]t’s all about class, not the individual.” He went on to say: “I just loved that whole ‘unit as one’. Even if you have issues outside the gate, once you step in this classroom, there’s just a unity between everyone that we’re all here to learn.”Footnote 14 Another echoed this sentiment, saying: “[E]veryone in there is all trying to do the same thing, y’know: just do the work.”Footnote 15 Students described the deep connections that form across divides, due to the sharing of common objectives: “The camaraderie that formed around guys of very diverse backgrounds, but we were all motivated on some level to be in the classroom. So, I built connections with people in there, in those classes, that I might have not built on my own outside of there.”Footnote 16
Even more directly, interpersonal cooperation in MTC’s culture and curriculum is operationalized in multiple ways. First, the college’s code of conduct explicitly emphasizes the importance of working together and establishes norms for doing so: “Mount Tamalpais College is committed to creating and maintaining an intellectual community in the prison in which all persons who participate in college programs and activities can work together in an atmosphere free of all forms of harassment, exploitation, or intimidation” (“Mount Tamalpais College General Catalog” 2020–21). Study halls, formalized peer-to-peer mentorship, and group projects as a regular part of the curriculum also serve as key aspects of the program and underscore the need for students to work together in order to succeed. One student described the college experience as: “We were helping each other. We were doing homework. ‘What do you think about this? I need help here. Can you give me some insight on that?’ It brings people together. I know that for a fact, because I saw it. You know, it’s an experience you can’t describe unless you’ve been there, and been where we’ve been.”Footnote 17 Another student echoed this sense of cooperation: “We worked in groups you know, we discussed things. … The guys were really cool cause we’d get into groups and really work hard on doing things.”Footnote 18 In this way, collaborative participation generated “a sense of camaraderie,”Footnote 19 not only during group discussions and assignments but also “because the [students] leaned on each other to get through the curriculum.”Footnote 20 Students described offering each other support, telling each other: “You’re not gonna flunk. We’re not gonna let you.”Footnote 21
Again, the classroom context—where goals were shared across groups and cooperation was the norm—contrasted sharply with the broader prison environment: “[I]t was like you had a place to go, somewhere to get away from that prison mentality, the block. A place to go where, you know, guys all had the same motivation.” In escaping the prison mentality, students gained a more positive sense of themselves and others: “The guys that started participating in the classes, you could actually see changes in behavior…. They’re actually exchanging information about the classes and doing something productive and interesting.”Footnote 22 As a result, interactions between students became more focused on school, and “conversations weren’t about, you know, a lot of prison stuff. It was more like, ‘Oh, you wanna hear something new? Check this out!’ Or, I said, ‘I know Macbeth, Shakespeare. You wanna hear some Shakespeare?’”Footnote 23 This spirit of commonality and cooperation extended beyond individual learning goals to the broader community of incarcerated people. One student described how he would “help people write letters to their loved ones, to their parole officers, and stuff like that.” As part of the college cohort, students come to share both “assignments to do” and also “something to look forward to.”Footnote 24
Support from a legitimate authority
The legitimization—and, indeed, celebration—of intergroup contact at MTC can be especially impactful for students in prison who are acclimated to a very different set of norms. In contrast to the prison yard and housing blocks, desegregation in the classroom is sanctioned and encouraged by both college and prison staff. Students described the sense of freedom that came from openly engaging in interracial contact in the classroom environment: “There’s no segregation. I mean, you sit immediately wherever your seat is, with not even a care or whatever about who you’re sitting next to. You know, it’s just your seat.”Footnote 25
This difference between cultures inside and outside the prison classroom can be alarming at first to some students. Before coming to prison, many students described having limited life experiences interacting with individuals from other racial groups or positions in society. For many, the racial code in prison served only to deepen those pre-existing divides. In contrast, college students described the desegregated MTC classroom as a seemingly “neutral” place within the prison where racial groups interacted in ways that would not have been seen as acceptable or even safe elsewhere. According to one student, “Before going to [prison], it was not only taboo but also your life could be endangered if you engaged with other races. [College] creates this tolerant space that is conducive of ripping the chains that bind people to these things. Being able to cultivate friendships with people of different races without any uproar.”Footnote 26 Another student described the differences between how people relate to each other in the prison’s higher education classroom compared to the prison yard, noting: “School and the yard are like night and day. Okay, so Whites don’t associate with Blacks [on the yard] and Blacks not with Whites. There are the yard divisions that dictate how an inmate comports themselves. And that is different in the classroom. You could talk. You could be more honest.”Footnote 27
MTC’s curriculum provided a means by which the college faculty and staff aimed to legitimize this openness to new ideas and respect for different backgrounds and perspectives. Many students reported never before having been in an educational environment that invited people to tackle racial issues head-on, and many felt the curriculum granted legitimacy to this enterprise: “When MTC first introduced a multicultural curriculum, that was huge, because if you know anything about prison, it’s based on racial politics. … And it really made the Americans, Samoans, Pacific Islanders, Half Native Americans, Latinos, Mexican American, Indian, it drew everybody into that course.”Footnote 28 This formal curriculum contrasts sharply with the implicit prison code. As such, some students found that, as they continued through the program, they gained the ability to transcend the traditional racial divisions of prison life: “[Curriculum] played a role in how people interacted out on the mainline, because they were becoming educated to the sensitivity of other people.”Footnote 29 Another student echoed this idea, describing the changes that took place inside the classroom and how they began to translate to the broader prison context over time: “I had some Black classmates—we respected each other. Over the years, you see a lot of these people in classes over and over again, so you kind of have a relationship that can extend to the yard.”Footnote 30 Students continuously emphasized how the culture and curriculum, or “exposure to information and people,”Footnote 31 worked together to undermine racial and social divisions and “allow people to gain a sense of compassion” for those of other racial groups and social classes, both at MTC and beyond the classroom walls.Footnote 32
Quantitative results: effects of higher education on racial outcomes
Our description of MTC’s ethos and culture, drawn from both the college’s documents and our qualitative interviews, illustrates how the college context meets the core criteria for prosocial intergroup contact and suggests the potential for a powerful effect of the college on students’ racial integration and attitudes. Turning to our survey data, we next explore how racial integration and racial attitudes vary among students at different stages of the college program. We do this by comparing average responses to survey questions across groups of students, according to the number of classes completed (see Figure 1). Using post-hoc Tukey tests, we find that students who have completed more classes are more likely to report engaging with people from other racial groups. (We find similar results in linear regression models that control for student race, age, and conviction charge, which are presented in Appendices C and D.) While this approach does not let us estimate a causal effect of college participation, our empirical strategy is strengthened by the ability to compare students who have just recently matriculated with students who are still on the college waitlist prior to matriculation.
Prison college students’ racial integration by student group (between subjects)
Notes: The graph provides the mean for each racial integration survey item by student group (the black bar indicates the mean per survey item waitlisted students, the dark gray bar represents new students that have taken 1-4 classes and the light gray bar represents more experienced students that have taken 5 or more classes). Each survey item is coded 0 or 1, with 1 being more positive. For the first survey item, 0 = less than 5; 1 = 5 or more. For the second item, 1 = agree or strongly agree on a 5-point Likert scale, while 0 indexes all other responses. The statistical significance with respect to differences across student groups is calculated using post-hoc Tukey tests. Sample sizes varied by question due to missing responses. From left to right, the sample sizes are n = (112, 65, 130) and n = (109, 65, 130). † p < 0.1, * p < 0.05, ** p<0.01, *** p < 0.001.

In our data, we find that students who have completed five or more classes are fully eighteen percentage points more likely to report five or more close relationships with people from a different race (p < 0.01; p < 0.001 in multivariate models) and nine percentage points more likely to be involved in activities with people from another race (p < 0.01) compared to waitlisted students who have not yet completed a class. These more experienced students are likewise seven percentage points more likely to be involved in activities with racially diverse groups than new students (p = 0.09). We do not find any statistically significant differences between new students and waitlisted students or between experienced students and new students on these measures, suggesting that changes to the composition of social networks may accrue over a longer period of time.
Next, we explore the extent to which students believe that different racial groups should interact with each other or that they personally report trying to associate with people from other racial groups (Figure 2). More experienced students are thirteen percentage points more likely to report that they like meeting people from other races, relative to waitlisted students (p = 0.09). New students also showed a sixteen-percentage-point increase over waitlisted students on this question (p = 0.09; p < 0.01 in multivariate models). We see the same directional pattern in attitudes toward associating with other racial groups when we compare means across new and experienced students, but differences are not statistically significant.
Prison college students’ racial attitudes by student group
Notes: The bar graph provides the mean for each racial attitude survey item by student group (the black bar indicates the mean per survey item waitlisted students, the dark gray bar represents new students that have taken 1–4 classes, and the light gray bar represents more experienced students that have taken 5 or more classes). Each survey item is coded either 0 or 1, with 1 being more positive. For each of these items, 1 indexes “strongly agree” on a 5-point Likert scale, while 0 indexes all other responses. The statistical significance with respect to differences across student groups is calculated using post-hoc Tukey tests. Sample sizes varied by question due to missing responses. From left to right, the sample sizes are n = (113, 66, 133), n = (114, 66, 133), and n = (113, 66, 133). † p < 0.1, * p < 0.05, ** p < 0.01, *** p < 0.001.

In addition to these overall shifts in attitudes displayed across class cohorts, we also explored heterogeneous effects between white (n = 63) and non-white students (n = 218) as they pass through the program. (Note, however, that results among white students in these analyses are suggestive only given the small size of this subsample [n = 63].) We ran separate linear models for white students and non-white students by regressing survey responses regarding racial integration onto their class group (with waitlisted students as the baseline), controlling for age and conviction charge. We find that, all else equal, more experienced white and non-white students are about nineteen percentage points more likely to have five or more friends of a different race compared to waitlisted students of the same race (p < 0.05). White new students are twenty-three percentage points more likely than white waitlisted students to report the same (p < 0.05). While non-white experienced students are also about seven percentage points more likely to be involved in activities with other races (p < 0.05), we find no evidence for differences among white students (see Table 3).
Models predicting racial integration for white and non-white students

Notes: Each model presents the estimate and standard error resulting from linear regression models that regress racial integration survey responses on factor variables for being a new student or an experienced student and controls for student age and conviction charge. Each survey item is coded either 0 or 1, with 1 being more positive. For the first survey item, 0 = less than 5; 1 = 5 or more. For the second item, 1 = agree or strongly agree on a 5-point Likert scale, while 0 indexes all other responses. † p < 0.1, * p < 0.05, ** p < 0.01, *** p < 0.001.
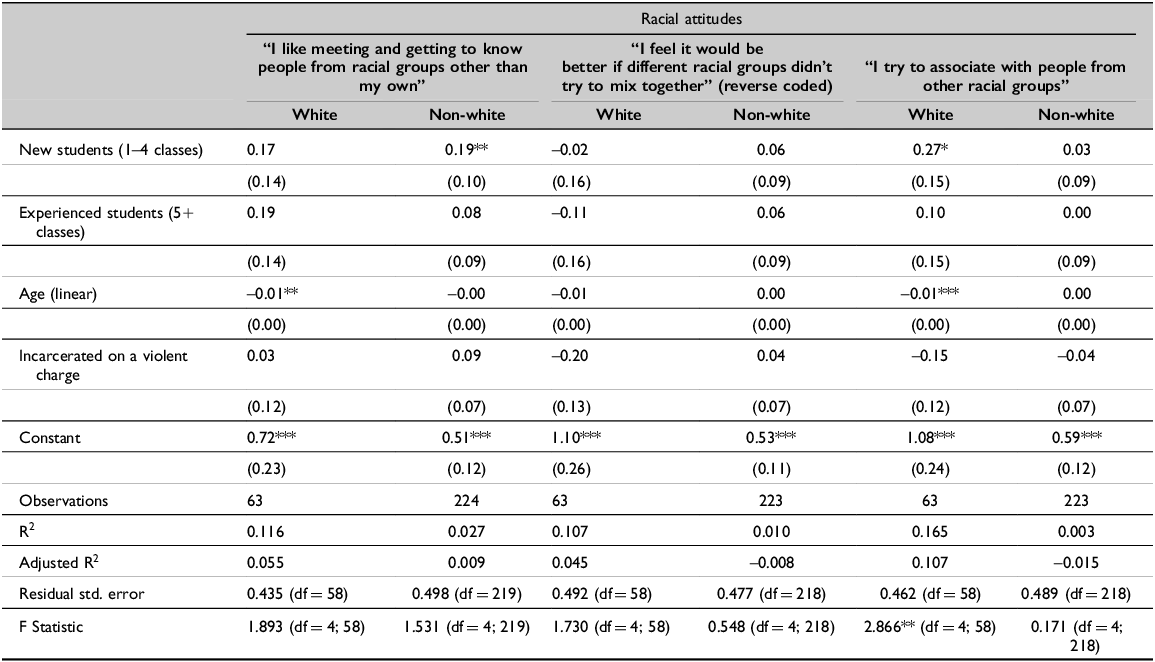
Differences in racial attitudes are less consistent across racial subgroups. All else equal, non-white new students are nineteen percentage points more likely to enjoy meeting people from other racial groups relative to their waitlisted counterparts (p < 0.01), whereas there is no discernible effect for white students. Conversely, new white students are twenty-seven percentage points more likely to report trying to associate with people from other racial groups compared to their waitlisted counterparts (p < 0.05), while non-white students do not exhibit a significant difference (Table 4).
Models predicting racial attitudes for white and non-white students

Notes: Each model presents the estimate and standard error resulting from linear regression models that regress racial integration survey responses on factor variables for being a new student or an experienced student and controls for student age and conviction charge. Each survey item is coded either 0 or 1, with 1 being more positive. For each of these items, 1 indexes “strongly agree” on a 5-point Likert scale, while 0 indexes all other responses. † p < 0.1, * p < 0.05, ** p < 0.01, *** p < 0.001.
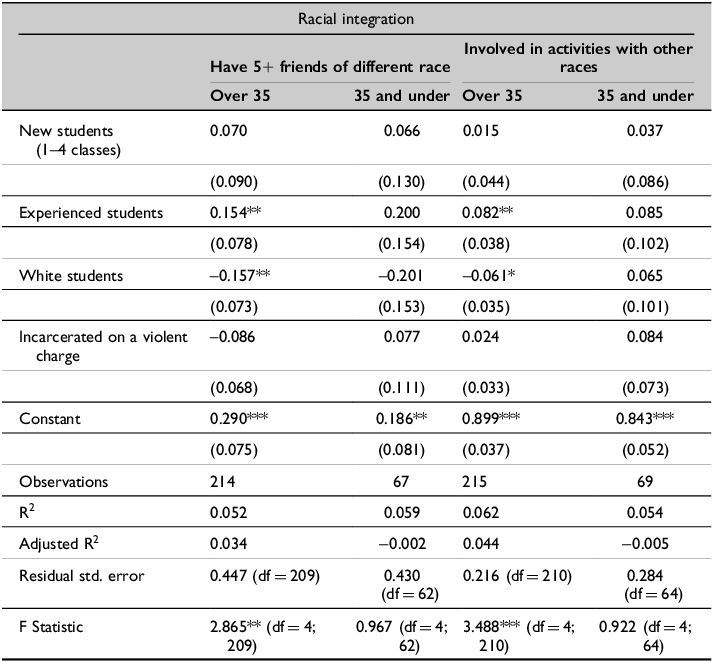
We also explored heterogeneous effects between younger (thirty-five and under; n = 69) and older students (older than thirty-five; n = 218) as they pass through the program. Again, however, results among younger students in this analysis are suggestive only, given the small size of this subsample. We ran separate linear models for younger and older students by regressing survey responses regarding racial integration (see Table 5) and racial attitudes (see Table 6) onto their class group (with waitlisted students as the baseline), controlling for race and conviction charge. We find that, all else equal, older experienced students are fifteen percentage points more likely to have more friends of a different race (p < 0.05) and eight percentage points more likely to be involved in activities with people of other races (p < 0.05) relative to their waitlisted counterparts. When it comes to racial attitudes (Table 6), older new students are twenty percentage points more likely to say that they like meeting and getting to know people from other racial groups relative to their waitlisted counterparts who have not yet matriculated (p < 0.05).
Racial integration models for younger and older students

Notes: Each model presents the estimate and standard error resulting from linear regression models that regress racial integration survey responses on factor variables for being a new student or an experienced student and controls for race and conviction charge. Each item is coded either 0 or 1, with 1 being more positive. For the first survey item, 0 = less than 5; 1 = 5 or more. For the second item, 1 = agree or strongly agree on a 5-point Likert scale, while 0 indexes all other responses. † p < 0.1, * p < 0.05, ** p < 0.01, *** p < 0.001.
Racial attitudes models for younger and older students

Notes: Each model presents the estimate and standard error resulting from linear regression models that regress racial attitudes survey responses on factor variables for being a new student or an experienced student and controls for race and conviction charge. Each item is coded either 0 or 1, with 1 being more positive. For the first survey item, 0 = less than 5; 1 = 5 or more. For the second item, 1 = agree or strongly agree on a 5-point Likert scale, while 0 indexes all other responses. † p < 0.1, * p < 0.05, ** p < 0.01, *** p < 0.001.
Conclusion
In this study, we used both qualitative and quantitative data to examine whether prison higher education shapes racial integration and attitudes among incarcerated individuals. We find that attending college classes while in prison is associated with increased engagement between individuals of different racial groups, as well as positive shifts in attitudes toward people of other races. These differences are relatively large in magnitude, representing potentially substantial effects. We also find evidence that some changes occur for both white and non-white students, as well as for older students. However, the relatively small sample size for white students and younger students affects our ability to draw clear conclusions about whether and how changes present differently across these characteristics.Footnote 33 Due to these sample size constraints, our analytical category of “non-white” also likely glosses over important differences across race and ethnicity (for example, between Latinx and African American students in the college).
The analysis we have presented here is subject to several other limitations. For instance, we have highlighted the ways in which scope conditions for prosocial contact—equal status, collective goals, and legitimizing authority—are operationalized through MTC’s code of conduct, academic honesty policy, classroom culture (for example, open seating arrangements in a desegregated classroom), multicultural curriculum, and pedagogy (for example, encouraging civil debate). However, we were not able to separate out these features of the college in order to assess their independent contributions, although Allport’s (1954) theory and subsequent research suggest that the underlying scope conditions must all be present for positive changes to occur. It is also possible that additional mechanisms (for example, features of the classroom’s physical space) might satisfy Allport’s conditions or enhance their effects in ways we do not explore here.
Additionally, while we do our best to control for imbalances in key observable characteristics across student groups (that is, race, age, and conviction charge), we were unable to establish causality in some of our quantitative analysis given that long-term longitudinal data are not available, and we were not able (and would not want) to randomly assign individuals to MTC. In our comparisons between waitlisted and newly matriculated students, however, we are reassured that our empirical setup—comparing those who have just recently been accepted into the college with those who are just about to be accepted as soon as space is available—gives us some “as if” random inferential power across equivalent groups. We also compared waitlisted students, newly matriculated, and experienced students on race, age, and conviction history and found that the three groups are relatively similar on observable characteristics (see Appendix B). We then controlled for these variables in our analyses, suggesting that our comparisons reveal differences resulting from college participation as opposed to these other potentially confounding variables.
Another concern might be that social desirability bias affects students’ answers to interview and survey questions about their experiences in the college. This could be particularly true among the waitlisted students we surveyed, who might fear that certain responses could jeopardize their future matriculation. To mitigate this potential, we did not survey waitlisted students until they had received a confirmed college start date. Additionally, we explicitly assured respondents that there were no right or wrong answers, emphasized the independence of the survey from the college and the prison, and guaranteed that responses to the survey would remain confidential and inaccessible to college administrators and teachers. Likewise, in our qualitative interviews, we informed students that there were no correct answers, that any qualitative data would not be associated with demographic data, and that we would use pseudonyms when describing their comments in any resulting reports or publications. We also ensured that all interviews were conducted by a racially diverse research team (some of whom were themselves formerly incarcerated), as opposed to college staff, in a private space that was comfortable for the interviewee. All interviewers were trained in how to obtain informed consent and how to establish trust, and the interview protocol avoided any leading questions that might inadvertently encourage specific or socially desirable responses.
Individuals in our interview and survey samples also might not be representative of the overall population of current and former students. Among the alumni of the college, we were only able to interview former students who had working phone numbers or email addresses on file with MTC. This raised concerns that those we were able to reach might have better social, economic, and educational outcomes on average than individuals we could not contact. Moreover, among the individuals who were available by phone or email, those who chose to participate in an interview might be systematically different from those who did not respond or declined an invitation to participate in the study. In this case, it could be that those who agreed to participate might have more favorable views of their experiences with MTC than those who did not.
Finally, we suspect that MTC is a particularly high-quality prison program and that the effects we found here might not always be broadly generalizable. In 2022, Mount Tamalpais College was granted accreditation by the Western Association of Schools and Colleges, making it the first independent liberal arts college dedicated solely to teaching incarcerated students (Lewen, Parent, and Jamgochian Reference Lewen, Parent and Jamgochian2022). MTC staff offer a range of student services and supports, including curriculum planning, library services, student advising, and assessment (“Mount Tamalpais College General Catalog” 2020–21; Annis Reference Annis2022). In recognition of the quality of MTC’s programming, the college was hailed by the Obama administration in 2015 and awarded a National Endowment for the Humanities Medal (“National Humanities Medal” 2015). Given these notable accomplishments, we do not expect that our findings would necessarily replicate across the full diversity of higher education programs operating in prisons nationwide. Rather, we would point to the example of MTC as showing the transformative potential of prison higher education when it is provided through a high-quality and well-established institution where conditions for prosocial intergroup contact are met.
Despite these qualifiers, our findings thus provide compelling evidence for the potential of college education in prison to improve racial integration and attitudes among incarcerated individuals. This is especially striking given the many ways in which a prison context has been shown to cultivate racial segregation and animosity through both formal rules and informal norms. Indeed, the rapid churn of incarceration, release, and recidivism across the correctional system gives justice-impacted individuals numerous exposures to the racialized codes found inside prison, further reinforcing expectations and behavior (Walker Reference Walker2016). Especially for those with gang affiliations, carceral experiences of racial segregation may spill over into re-entry due to ongoing racial group embeddedness and affinity (Stowell and Byrne Reference Stowell, Byrne, James, Hummer and Faye2008; Bloch and Olivares-Pelayo Reference Bloch and Alan Olivares-Pelayo2021; Pyrooz Reference Pyrooz2024).
Yet while the prison environment may work to separate and segregate racial groups, higher education can bring them together by promoting attitudes, norms, and values that prioritize empathy and openness (Mezirow Reference Mezirow1978; Huang, van den Brink, and Groot Reference Huang, van den Brink and Groot2009; Niedlich et al. Reference Niedlich, Kallfaß, Phole and Bormann2021). The result can be consequential for individual students as well as for the broader prison culture. Over the long term, diverse social networks formed in college might generate other valuable outcomes, especially for traditionally underrepresented students; interracial contact has been shown to expand social networks and access to resources that might not have been otherwise available (Lin, Ensel, and Vaughn Reference Lin, Ensel and Vaughn1981; Ayala Reference Ayala2012; Fuller Reference Fuller2014; Mishra Reference Mishra2020). This valuable social capital, which is embedded in relationships and social networks, can provide access to information and opportunities that might otherwise be absent due to exclusionary norms and structural inequality (Coleman Reference Coleman1988; Lewis Reference Lewis2003; Pascarella and Terenzini Reference Pascarella and Terenzini2005; Park et al. Reference Park, Kim, Kristyn Lue, Parikh, Salazar and Liwanag2021).
The effects we uncover in this study have important implications for both theory and practice. For researchers, our study adds to previous calls for shifting higher education in prison evaluation to be more aligned with research on higher education on traditional campus settings (Kallman Reference Kallman2019; McCorkel and DeFina Reference McCorkel and DeFina2019; Pelletier and Evans Reference Pelletier and Evans2019). While research on the benefits of traditional higher education explores myriad outcomes of interest, nearly all quantitative studies of higher education in prison focus solely on disciplinary, recidivism, or employment outcomes (Gerber and Fritsch Reference Gerber and Fritsch1995; Aos, Miller, and Drake Reference Aos, Miller and Drake2006; Winterfield et al. Reference Winterfield, Mark Coggeshall, Correa and Tidd2009; Davis et al. Reference Davis, Bozick, Steele, Saunders and Miles2013, Reference Davis, Steele, Bozick, Williams, Susan Turner, Saunders and Steinberg2014; Kim and Clark Reference Kim and Clark2013; Duwe and Clark Reference Duwe and Clark2014; Bozick et al. Reference Bozick, Steele, Davis and Turner2018; Denney and Tynes Reference Denney and Tynes2021). These studies locate evaluations of prison higher education within a punishment and crime desistance framework, rather than one of individual transformation and institutional reform (Petersilia and Cullen Reference Petersilia and Cullen2015; Dick, Rich, and Waters Reference Dick, Rich and Waters2016). This is limiting for a variety of reasons but, most critically, because a solely criminological framework for evaluating prison higher education risks constraining student experiences to performative redemption narratives or funneling them into career technical education programming to meet immediate employment needs (Conway Reference Conway2022). This approach is also inconsistent with postsecondary educational research, which is generally concerned with intellectual growth, intrinsic benefits to learners, and broader prosocial outcomes (Castro et al. Reference Castro, Brawn, Graves, Mayorga, Page and Slater2015; Castro Reference Castro2018; Castro and Gould Reference Castro and Rachel Gould2018; Ositelu Reference Ositelu2019; Conway Reference Conway2023).
Conversely, previous qualitative studies of prison higher education have demonstrated the potentially transformative potential of college during incarceration—a perspective that is often overlooked in criminologically-oriented quantitative studies (Hall and Killacky Reference Hall and Killacky2008; Pelletier and Evans Reference Pelletier and Evans2019). These qualitative accounts suggest that college programs in prisons can support students’ sense of empowerment and self-efficacy (Evans, Pelletier, and Szkola Reference Evans, Pelletier and Szkola2018; McCorkel and DeFina Reference McCorkel and DeFina2019), shape identity and self-conception (Lerman and Sadin Reference Lerman and Sadin2022), provide access to broader social networks, strengthen ties to community, and foster future-oriented mindsets (O’Grady Reference O’Grady2019; Pelletier and Evans Reference Pelletier and Evans2019; Dewey et al. Reference Dewey, Kym Codallos, Kirstin Drenkhahn and Alec Muthig2020). Alumni of higher education in prison programs describe enormous benefits of education, including the creation of prosocial bonds, a greater understanding of the human condition, and the development of leadership and critical thinking skills (Runell Reference Runell2018; Kallman Reference Kallman2019; Pelletier and Evans Reference Pelletier and Evans2019). Moreover, qualitative scholars have suggested that the communal exercise of learning can encourage students to be more open and accepting of other students’ identity differences (Kallman Reference Kallman2019). However, despite these efforts to expand the theoretical framing of prison higher education, non-criminological outcomes remain “virtually unexplored in scholarship” that relies on quantitative measures of change (Kallman Reference Kallman2019, 328–29). The findings that we present thus identify an important and previously underexplored aspect of prison higher education, with implications for how educational programs are evaluated within prison settings.
Our research raises a variety of important questions for future research. For instance, the effects of college participation on racial attitudes and integration might vary across students in ways that we are unable to test here. Our exploratory analyses on heterogeneous effects by race and age provide preliminary support for this idea. We also might expect effects to be moderated by educational factors, like the type of classes taken (for example, science, technology, engineering, or math versus social science or humanities) or prior educational preparation (for example, GED versus high school diploma) or between those with learning disabilities and those without. Likewise, we might expect potential heterogeneity across gender groups, a dimension of analysis that is precluded by the all-male prison setting where MTC currently operates. Future research should take up these important questions.
By examining the effects of prison education on racial integration and racial attitudes, this study expands our understanding of the transformative promise of higher education within correctional settings. Especially considering prisons’ legacy of formal and informal segregation, our findings identify a potentially powerful intervention for enhancing race relations in a deeply divided context. Additionally, our qualitative data hint at potential spillover effects within the prison system writ large, suggesting the potential of higher education in shaping not only individual lives but also the larger prison environment. This is also an important avenue for further inquiry in future research.
More broadly, a host of research, as well as recent meta-analyses, find that the positive effects of intergroup contact generally hold under specific conditions: when contact is among peers of equal status, when a common goal is pursued cooperatively, and when it is sanctioned by legitimate authorities (Allport Reference Allport1954). However, existing literature generally fails to investigate specific contexts where interventions might be successful (Pettigrew and Tropp Reference Pettigrew and Tropp2006; Paluck, Green, and Green Reference Paluck, Green and Green2019). As such, this study contributes to our understanding of racial bias mitigation by focusing on adults—a group that is much less likely to experience significant attitude change about race and racial issues—in an environment where racial bias mitigation is arguably especially important, given its role in prison violence (Nosek et al. Reference Nosek, Smyth, Hansen, Devos, Lindner, Ranganath and Smith2007; Priest et al. Reference Priest, Natalie Slopen, Jeny Tony Philip and Anna Daly Kauffman2018; DeSante and Smith Reference DeSante and Watts Smith2020; Kiley and Vaisey Reference Kiley and Vaisey2020).
Finally, this research has clear implications for both educational and correctional policy. In seeking to reduce racial conflict in prisons, and promote interracial understanding more broadly, policy makers and educational institutions might invest in expanding high-quality liberal arts programs that facilitate incarcerated students’ critical reflection and intellectual growth. In particular, our results suggest that integrated spaces inside prisons can enhance interracial social ties and reduce racial animus and thus provide some insight into how to structure the implementation of policies that might likewise change the status quo of segregation. In California, this is particularly timely given CDCR’s 2022 decision to cease housing assignments based on gang affiliations, which are highly correlated with race.Footnote 34 In no longer sanctioning race-based housing policy, California prisons have taken a small step in delegitimizing racial segregation in other areas of prison life. In Texas, for example, data suggest that the integration of prison cells in the 1990s reduced racial violence over time (Trulson et al. Reference Trulson, Marquart, Hemmens and Carroll2008).
Future research might productively examine the impact of these changes, as well as whether and how other types of in-prison programs and policy reforms are able to produce the conditions of contact that successfully reduce out-group biases. For example, some types of prison work assignments have been found to have bias-reducing effects. In a qualitative study of prison dog-training programs, participants described how being part of the program helped to counteract the racialized prison code (Wesely et al. Reference Wesely, Furst, Bello and Morris2025). Similarly, research on California’s prison fire camps observed individuals from diverse ethnic and racial backgrounds working together and sharing resources in high-stakes environments, though it is unclear how persistent these effects might be (Goodman Reference Goodman2014). Other types of prison reforms that integrate racial groups might similarly reduce racial antagonism when implemented carefully and with the conditions of bias-reducing contact in mind.
Future research might explore whether alternative housing blocks for “trustees,”Footnote 35 prison churches (Walker Reference Walker2016), prison arts programs (Brewster Reference Brewster2010), and prison workplace contexts (Goodman Reference Goodman2014) can likewise offer opportunities for interaction that reduce racial animus and increase social trust. Indeed, it is quite possible that there are myriad places inside prison that could offer a “contrasting context” where scope conditions—equal status, the cooperative pursuit of a collective goal, and legitimized integration—for racial bias mitigation are met. Ultimately, the broader prison environment might effectively be reconfigured to both reflect and create conditions for prosocial contact. As one MTC alumnus puts it, “[a] prison environment is a microcosm of the big world. You as an individual, who you choose to associate yourself with, the type of activities you want to participate in, just like out here [outside prison], that’s gonna shape how you prevail in life.”Footnote 36
Supplementary material
For supplementary material/s referred to in this article, please visit https://doi.org/10.1017/lsi.2025.10067
Acknowledgements
The research reported in this article was made possible by a grant from the Spencer Foundation (Grant no. 201800027). The views expressed are those of the authors and do not necessarily reflect the views of the Spencer Foundation. Additional funding was provided by the American Cultures Engaged Scholarship program at the University of California, Berkeley. Our thanks especially to Victoria Robinson for supporting this work. The project also benefited enormously from the assistance of Spencer Bowen, Randy Clopton, Kyle Dill, Jacob Grumbach, Emily Estus, Rebekah Jones, Mark Lipkin, Audrey Sayer, Anna Schiff, Emily Swide, Marie Warchol, as well as the phenomenal students who carried out our interviews: Shania Ali, Meghan Brown, Clarence Ford, Sara Hidayatullah, James Huynh, Christian Lambaren Sanchez, Jessica Lim, David Little, Timothy Ma, Adriana Medina, Michael Mendieta, Kameron Mims- Jones, Eli Moreh, Laura Perry, Dean Petitta, Desiree Sulzmann, and Jonathan Verdugo. Sincere thanks to Jody Lewen, Amy Jamgochian, and the students, alumni, and program team of the Mount Tamalpais College Program at San Quentin State Prison for their participation and support in carrying out this work.


 Open access