


Background
Antimicrobial resistance (AMR) arises when microorganisms adapt to survive antimicrobial drugs through spontaneous genetic mutations, Reference Friedman, Temkin and Carmeli1,Reference Jindal, Pandya and Khan2 a process exacerbated by human activities such as the misuse of antimicrobials and poor infection control practices. Reference Knight, Costelloe and Deeny3,Reference Klein, Milkowska-Shibata and Tseng4 In 2019, approximately 4.95 million deaths occurred globally in direct association with AMR. Reference Laxminarayan5 In Australia, AMR-associated deaths have risen to over 1,000 annually, and the 5 most common AMR pathogens were attributed to the loss of 27,705 quality-adjusted life years in 2020. Reference Wozniak, Cuningham, Ledingham and McCulloch6 The most prominent of these were methicillin-resistant Staphylococcus aureus (MRSA) infections in the respiratory tract, bloodstream, and skin, accounting for $3.5 billion of Australian healthcare expenditure. Reference Cameron, Paterson and Britton7 Globally, AMR threatens the efficacy of life-saving antibiotics, fueling community-wide colonization with resistant pathogens that were once confined to hospital settings. Reference DeLeo, Otto, Kreiswirth and Chambers8
At this time, there is sparse literature that evaluates low socioeconomic status (SES) as a key driver of AMR, limiting its recognition as a potential target for policy and intervention. Numerous primary studies have examined the prevalence of resistant strains of specific pathogens in clinical settings, although current literature lacks consensus on SES as an independent contributor to AMR in high-income countries. SES is a composite of contributing determinants, and the term SES represents the factors collectively (household crowding, education level, etc) unless otherwise specified.
At the community level, low-SES neighborhoods may be disproportionately vulnerable to AMR due to reduced gut microbiome diversity linked to food insecurity. Reference Eggers, Kates, Safdar, Suen and Malecki9 Determinants of SES such as household crowding (per Canadian National Occupancy Standard) increase exposure to microorganisms and facilitate resistance development. Education level directly correlates with health literacy, influencing antimicrobial use and treatment adherence. Reference Coughlin, Vernon, Hatzigeorgiou and George10 Furthermore, lower SES communities have a greater reliance on Medicare and its international counterparts, which stresses stewardship and delays treatment in the community. 11
In rural and remote areas, lack of stringent antimicrobial stewardship (AMS) contributes significantly to inappropriate prescription and antibiotic use, Reference Yau, Thor, Tsai, Speare and Rissel12 directly increasing AMR. Additionally, crowded housing, inadequate hygiene practices, limited healthcare access, and literacy add to increased AMR in rural communities. Reference Wozniak, Cuningham, Ledingham and McCulloch6 Less studied, however, are populations of low SES in urban and suburban communities with similar AMR prevalence and related disease burdens. Local studies show direct correlations between low SES and the prevalence of specific strains of AMR pathogens, suggesting that similar social determinants drive these disparities in both rural and urban areas. Reference Yau, Thor, Tsai, Speare and Rissel12,Reference Prestinaci, Pezzotti and Pantosti13
Examining SES in specifically high-income countries is a crucial distinction when identifying global patterns in AMR. Low- and middle-income countries (LMICs) have severe limitations to antimicrobial supply and stewardship and therefore have significant challenges gathering truly representative data on resistance prevalence. Reference Seale, Hutchison, Fernandes, Stoesser, Kelly and Lowe14 These nations also exhibit economic conditions not comparable to SES distributions elsewhere. Because much of their population earns less than $1 USD/day, Reference Fleece, Nshama, Walongo, Kimathi, Gratz and McQuade15 socioeconomic measures from LMICs would have limited applicability to those of high-income countries.
Research question
This review investigates the association between SES and AMR rates across high-income countries based on the World Bank classification, testing the hypothesis that SES is negatively correlated with AMR prevalence. Addressing these disparities will inform policies to mitigate AMR and protect global health.
Methods
A search from 2015 to 2024 explored databases Embase, PubMed, Web of Science, and CINAHL. Relevant keyword synonyms were compiled. For words such as “antimicrobial” or “resistance,” antimicrobials and drug-resistant bacterial strains were also included specifically, such as “penicillin” or “MRSA.” Complete search terms are in Appendix 1.
Yau et al Reference Yau, Thor, Tsai, Speare and Rissel12 conducted a review of AMR between rural and urban communities. Because of its similarity to this research question, the key terms informed synonyms commonly used in titles and abstracts of studies on this topic. The Boolean search structure was organized into 4 components: antibiotic, resistance, incidence/prevalence, and income/SES. Search terms were separated by these 4 sets of synonyms and divided by an AND Boolean, mandating that at least 1 word from each set was present. This ensured a broad range of results while preventing an unmanageable surplus of irrelevant articles. Studies evaluated SES by parameters related to income, occupation, and education. The selection of high-income nations was defined by countries listed as “high-income” according to the World Bank classifications (Table 1). Prevalence of infection or colonization by any AMR bacterial strain was included for all ages of the human population, excluding agricultural and industrial AMR studies. Additional exclusion criteria include non-bacterial infections and populations with significant comorbidities (Table 1). Following extraction, quality assessment was conducted with the Mixed Methods Appraisal Tool Version 2018. Reference Hong, Pluye and Fàbregues16
Inclusion and exclusion criteria

Note. AMR, antimicrobial resistance; SES, socioeconomic status; HIV, human immunodeficiency virus; CF, cystic fibrosis.
Results
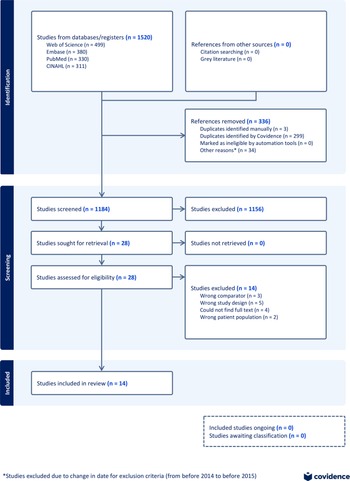
The database search conducted on May 28, 2024, yielded 1,520 articles, of which 336 duplicates were removed. This left 1,184 articles that underwent the first phase of screening, whereby 26 articles were included and 1,104 were excluded by all 4 reviewers—from May 28, 2024, to June 25, 2024—with 54 conflicts left for resolution. After review, 2 of the 54 articles in contention were included.
In total, 1,156 records were excluded during screening of abstracts and titles, leaving 28 articles for full-text screening (Figure 1). During full-text screening from June 25 to July 13, 2024, 14 studies were included and 14 were excluded by all reviewers without conflicts. Of the 14 included studies, Reference Wozniak, Cuningham, Ledingham and McCulloch6,Reference Andreatos, Shehadeh, Pliakos and Mylonakis17–Reference Blakiston and Freeman29 5 were cross-sectional, Reference Wozniak, Cuningham, Ledingham and McCulloch6,Reference Andreatos, Shehadeh, Pliakos and Mylonakis17–Reference Paumier, Asquier-Khati and Thibaut20 5 were retrospective cohort, Reference Fasugba, Das, Mnatzaganian, Mitchell, Collignon and Gardner21–Reference Schubert, Woodman and Mangoni25 3 were case-control, Reference Casey, Rudolph and Robinson26–Reference McCowan, Bakhshi and McConnachie28 and 1 was ecological in study design. Reference Blakiston and Freeman29 Eight high-income nations were represented: Australia (n = 5), Reference Wozniak, Cuningham, Ledingham and McCulloch6,Reference Chua and Stewardson19,Reference Fasugba, Das, Mnatzaganian, Mitchell, Collignon and Gardner21,Reference Miyakis, Brentnall and Masso24,Reference Schubert, Woodman and Mangoni25 the United States (n = 3), Reference Andreatos, Shehadeh, Pliakos and Mylonakis17,Reference Chen, Li, Lin, Huang and Dong18,Reference Casey, Rudolph and Robinson26 France (n = 1), Reference Paumier, Asquier-Khati and Thibaut20 Canada (n = 1), Reference Gill, Ma and Guo22 Netherlands (n = 1), Reference Honsbeek, Tjon-A-Tsien and Stobberingh23 Israel (n = 1), Reference Henig, Weber and Hoshen27 the United Kingdom (n = 1), Reference McCowan, Bakhshi and McConnachie28 and New Zealand (n = 1). Reference Blakiston and Freeman29
The studies examined a range of infections and resistant organisms (Table 2). The most commonly studied infections were urinary tract infections (UTIs) caused by extended-spectrum β-lactamase (ESBL)-producing or multidrug-resistant (MDR) E. coli (n = 6), Reference Chua and Stewardson19–Reference Fasugba, Das, Mnatzaganian, Mitchell, Collignon and Gardner21,Reference Honsbeek, Tjon-A-Tsien and Stobberingh23,Reference Casey, Rudolph and Robinson26,Reference McCowan, Bakhshi and McConnachie28 and MRSA (n = 5). Reference Andreatos, Shehadeh, Pliakos and Mylonakis17,Reference Chen, Li, Lin, Huang and Dong18,Reference Gill, Ma and Guo22,Reference Miyakis, Brentnall and Masso24,Reference Blakiston and Freeman29 Other pathogens included carbapenem-resistant Acinetobacter baumannii (CRAB) (n = 1) Reference Henig, Weber and Hoshen27 and antibiotic-resistant H. pylori (n = 1). Reference Schubert, Woodman and Mangoni25 Most studies focused on community-associated infections, though some used hospital-based data or both.
Study characteristics. Study characteristics and demographics of the included studies (n=14)

Note. AMR, antimicrobial resistance; SES, socioeconomic status; MRSA, methicillin-resistant Staphylococcus aureus; ESBL-E. coli, extended-spectrum β-lactamase–producing Escherichia coli; IRSD, Index of Relative Socioeconomic Disadvantage; VITEK MS, automated mass spectrometer system; ACT, Australian Capital Territory; SEIFA, Socio-Economic Indexes for Areas; CRAB, carbapenem-resistant Acinetobacter baumannii.
PRISMA diagram of screening process.

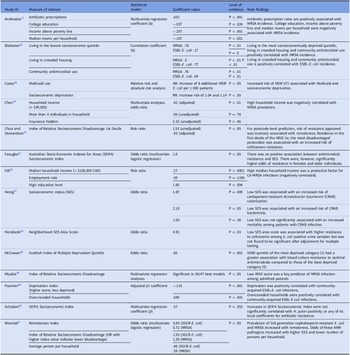
All included studies explored associations between SES and AMR-related outcomes using various proxy measures for SES, including but not limited to income, education, employment, remoteness, insurance status, and census deprivation indices. The indices, when utilized, were often country-specific and locally tailored (Table 3). Regardless, many of these shared common parameters as displayed in Table 4. Among the 14 studies, 12 found at least 1 significant positive association between lower SES and increased AMR risk (Table 3). For example, Casey et al Reference Casey, Rudolph and Robinson26 found that Medicaid usage and neighborhood deprivation were linked to MDR E. coli UTIs in a large Californian cohort. Similarly, Henig et al Reference Henig, Weber and Hoshen27 reported that lower SES was significantly associated with increased risk of CRAB colonization and infection in Israel. Schubert et al Reference Schubert, Woodman and Mangoni25 examined antibiotic resistance patterns to H. pylori in the Greater Adelaide Region of Australia. 20,108 gastric biopsies identified a 9.45% positivity rate for H. pylori, with resistance to metronidazole, clarithromycin, or amoxicillin observed in 41.9% of infections. Multivariate linear regression revealed migration status as a key predictor of H. pylori positivity and antibiotic resistance. However, geographically weighted regression found that many independent local regression variables, such as the census socioeconomic index, were not significant for H. pylori positivity or associated AMR. Reference Schubert, Woodman and Mangoni25
Summary of findings. Summary of included studies and relevant findings. Measure of interest includes both that of SES and secondary outcomes (AMS). Level of evidence was colored according to significance for ease of interpretation (green, statistically significant; red, not statistically significant). A P value < .05 was considered significant

Note. MRSA, methicillin-resistant Staphylococcus aureus; ESBL-E. coli, extended-spectrum β-lactamase–producing Escherichia coli; MDR, multidrug resistant; UTI, urinary tract infection; AR, absolute risk; RR, relative risk; IRSD, Index of Relative Socioeconomic Disadvantage; SEIFA, Socio-Economic Indexes for Areas; SES, socioeconomic status; AMR, antimicrobial resistance.
Determinants of SES and correlation to AMR. Compiled list of SES measures extracted from included studies. N refers to the number of studies measuring the given SES factor

Note. AMR, antimicrobial resistance; UTI, urinary tract infection; SES, socioeconomic status.
* This column indicates results in supportive affirmation of the hypothesis, not the number of statistically significant findings indicated by red and green in Table 3. For example, a negative correlation between income and AMR prevalence would be a supportive finding, whereas a positive correlation between household crowding and AMR would be affirmative.
Several studies included additional SES-related variables such as household crowding, remoteness, and proportion of residents born outside the country, which were positively associated with AMR. Reference Wozniak, Cuningham, Ledingham and McCulloch6,Reference Chua and Stewardson19,Reference Fasugba, Das, Mnatzaganian, Mitchell, Collignon and Gardner21,Reference Schubert, Woodman and Mangoni25–Reference Blakiston and Freeman29 Furthermore, Blakiston et al Reference Blakiston and Freeman29 and Chua and Stewardson Reference Chua and Stewardson19 identified both community antimicrobial use and household density as significant contributors to MRSA and ESBL-E. coli incidence. Age and sex were also explored, with older women found to have an increased risk of MDR UTIs in an Australian cohort. Reference Fasugba, Das, Mnatzaganian, Mitchell, Collignon and Gardner21
Most studies were observational in nature and geographically concentrated in Australia Reference Wozniak, Cuningham, Ledingham and McCulloch6,Reference Chua and Stewardson19,Reference Fasugba, Das, Mnatzaganian, Mitchell, Collignon and Gardner21,Reference Miyakis, Brentnall and Masso24,Reference Schubert, Woodman and Mangoni25 and North America. Reference Andreatos, Shehadeh, Pliakos and Mylonakis17,Reference Chen, Li, Lin, Huang and Dong18,Reference Gill, Ma and Guo22,Reference Casey, Rudolph and Robinson26 Ecological and cross-sectional designs were common, limiting causal inference. Nevertheless, consistent associations across multiple regions and methodologies suggest a robust relationship between SES and AMR prevalence.
Determinants of socioeconomic status
Included studies investigated a plethora of SES determinants: income, household crowding, education, Medicaid use, insurance, employment, and census-derived deprivation scores (Table 4). Although these determinants are collectively a comprehensive measure of SES, direct comparison between studies is made difficult by their heterogeneity. Overall, 12 of 14 studies reported at least 1 significant association between a determinant of SES deprivation and increased AMR prevalence (Table 3). Of the 2 studiesthat did not find any significant positive correlations, Reference Wozniak, Cuningham, Ledingham and McCulloch6,Reference Schubert, Woodman and Mangoni25 Wozniak et al Reference Wozniak, Cuningham, Ledingham and McCulloch6 found that AMR prevalence increased with remoteness, independent of socioeconomic indices or income. Although remoteness may relate to SES, it was not considered as an independent determinant. Schubert et al Reference Schubert, Woodman and Mangoni25 reported no significant increase in H. pylori positivity or any local coefficients for antibiotic resistance with increasing SEIFA Socioeconomic Index. Across the 14 included studies, 9 unique measures including and related to SES were investigated in 27 iterations (N, Table 4). Overall, 20 instances of the 27 were statistically significant correlations in support of the hypothesis (Table 4). Hence, most studies report positive correlations between SES and AMR in a majority of the various SES determinants, but further analysis is required to ascertain which determinants are the largest contributors and develop understanding of a potential dose-response relationship.
Mechanisms of association between SES determinants and AMR
Household crowding was a key determinant of SES with a demonstrated causal mechanism of low SES and increased AMR prevalence. Reference Andreatos, Shehadeh, Pliakos and Mylonakis17,Reference Paumier, Asquier-Khati and Thibaut20,Reference Casey, Rudolph and Robinson26,Reference Blakiston and Freeman29 Blakiston et al Reference Blakiston and Freeman29 identified increased prevalence of ESBL-E. Coli and MRSA with crowded housing, organisms that are known to readily spread within households. However, Wozniak et al Reference Wozniak, Cuningham, Ledingham and McCulloch6 challenged simplistic crowding metrics of “persons per household,” emphasizing the need to assess housing quality rather than simply the number of occupants. Community antibiotic use also played a role, with Andreatos et al Reference Andreatos, Shehadeh, Pliakos and Mylonakis17 and Blakiston et al Reference Blakiston and Freeman29 reporting higher prescription rates in lower SES areas, driving MRSA and ESBL-E. coli resistance. In contrast, Wozniak et al Reference Wozniak, Cuningham, Ledingham and McCulloch6 rejected antibiotic use as a sole driver, citing increased AMR prevalence despite longstanding stewardship programs in remote Australia.
Higher income appeared protective, with Chen et al Reference Chen, Li, Lin, Huang and Dong18 and Gill et al Reference Gill, Ma and Guo22 showing inverse relationships between affluence and MRSA infections. Similarly, McCowan et al Reference McCowan, Bakhshi and McConnachie28 found more antimicrobial-resistant E. coli in Scotland’s most deprived areas but did not propose specific mechanisms. Henig et al Reference Henig, Weber and Hoshen27 and Wozniak et al, Reference Wozniak, Cuningham, Ledingham and McCulloch6 however, framed AMR disparities as a function of healthcare access rather than income alone. Remoteness was a more complex variable. Univariable analysis for remoteness showed a significant association with AMR for Chua and Stewardson, Reference Chua and Stewardson19 but findings were not significant in multivariate regression. Wozniak et al Reference Wozniak, Cuningham, Ledingham and McCulloch6 argued that remoteness itself directly contributed to AMR spread in resource-limited settings, underscoring the need for context-specific, targeted approaches to AMR mitigation rather than one-size-fits-all interventions.
Overall, these studies suggest that no single mechanism fully explains SES-related AMR disparities. Instead, determinants such as household density, antibiotic exposure, income, and healthcare accessibility interact in complex ways, necessitating tailored interventions that consider both local socioeconomic determinants and healthcare policies.
Discussion
This systematic review provides evidence for a more complex correlation between low SES and AMR prevalence in high-income nations. Across the included studies, multiple SES determinants such as income, household crowding, and community antibiotic use were associated with increased AMR burden. Community antibiotic prescribing patterns were also linked to AMR prevalence, particularly in lower-income communities, though causality remains uncertain.
This review also highlights the need for targeted public health interventions that address a multitude of factors, from social and behavioral determinants that could increase risk of infection to access to safe and appropriate healthcare at a population level. This goes beyond the scope of traditional AMS programs, which have primarily focused on reducing the quantum of inappropriate prescribing in hospital settings. Reference DeLeo, Otto, Kreiswirth and Chambers8,30 Remoteness and rurality as a driver of AMR have also been the primary focus of targeted AMS programs in the past. 30 Such programs, however, could potentially overlook socioeconomically disadvantaged urban communities and the significant burden of resistance they pose. Examples could include investing in affordable housing construction, maintenance, and subsidizations for ventilation and sanitation hardware. 31 Public education on hygiene and antibiotic use from junior to senior schools also shows promise as evidenced by the e-Bug program in Europe which significantly improved knowledge and awareness in young people. Reference Lecky, McNulty and Touboul32
Strengths and limitations
We observed a heterogeneity of study types and settings among included studies, from hospitalized patients to community screening participants. The included studies were well-conducted, with large sample sizes and broad geographic coverage, enhancing the external validity of the findings (Table 5). However, several limitations are present. No formal publication bias assessment was conducted, and therefore, publication bias remains a potential limitation of this review. One study used an ecological design, which is vulnerable to ecological fallacy. Although this does not invalidate the findings, it constrains their applicability to policies targeting AMR at the individual level.
Quality assessment of included studies. The Mixed Methods Appraisal Tool Version 2018 Reference Hong, Pluye and Fàbregues16 was used to evaluate the quality of each study

The wide variation in measurement of variables among studies included is the primary limitation in this review. The definition of AMR as the outcome variable varied considerably, not only in the studied strain but also in the outcome classification. Some studies defined AMR through the presence of a resistant microbial in a community screening test, while other studies were based on positive diagnostic findings of hospitalized cases of UTI or bacteremia. A standardization of SES measurements within a nation, from individual to population levels, would also facilitate research and benchmarking across health boards and between different states. We recognize that this would allow robust meta-analyses, which could not be conducted due to the heterogeneity of SES and AMR measures in the current literature.
Conclusion
This systematic review identifies socioeconomic determinants as a potentially significant driver of AMR. Investigating the spread of resistance in low-SES populations of both urban and rural communities presents a new paradigm for AMS programs, which have previously focused primarily on inappropriate prescription and remote communities. 30 We recommend public health initiatives prioritize infection control and AMS in populations of lower SES, both urban and rural, where risks of AMR may be heightened.
AMR is a multifaceted issue influenced by SES disparities, healthcare accessibility, and antibiotic exposure. Addressing these disparities will require collaborative, multi-sectoral approaches that integrate public health, healthcare policy, and socioeconomic interventions. Future AMR research will benefit from adopting a standardized demographic index for SES to enable more cross-study comparisons and meta-analysis for policy relevance. Concurrently, prospective studies that clarify causal pathways should be conducted to tailor more effective strategies to mitigate AMR in socioeconomically disadvantaged communities. These recommendations, when implemented, would ultimately promote health equity, prevent AMR spread, and strengthen global efforts to reduce AMR.
Acknowledgments
No individuals or organizations other than the listed authors contributed to the preparation of this manuscript.
Financial support
None reported.
Competing interests
All authors report no conflicts of interest relevant to this article.
Research transparency and reproducibility
The data described in this article are all publicly available.
Supplementary material
The supplementary material for this article can be found at https://doi.org/10.1017/ash.2025.10177.




 Open access

