




Many important decisions in life involve choosing among risky rival options. The college application decision is a well-known example of this type of problem: a student can apply to many schools but can only enroll in one. In general, these problems involve simultaneously selecting a subset of options from a larger menu. This type of decision problem is unique due to the fact that each option is uncertain and all the options are rival with each other. In the college application example, each college has a likelihood of admission and an enrollment payoff. Applicants will enroll in their most preferred school to which they are admitted. Therefore in the college application example, there are probabilities of success and payoffs, like with lotteries. However, unlike standard lottery portfolio problems, the payoffs are rival; many lotteries may have a favorable outcome (i.e., admitted into many schools). Moreover, the decision-maker’s utility is determined by the highest valued lottery of those that were favorable (attend the most preferred school of those that admitted the student).
In this paper, we explore the portfolios of risky and rival lotteries selected by subjects participating in incentivized online experiments. We demonstrate the portfolio of lotteries selected by subjects are inconsistent with expected utility maximization. Subjects in our experiment generally choose too many “safe” lotteries resulting in sub-optimal earnings. Further, their chosen portfolios of lotteries are statistically indistinguishable from those chosen by subjects participating in an experiment in which payoffs were determined by the outcome of one lottery selected at random.
Chade and Smith Reference Chade and Smith(2006) (C&S, hereafter) study risky rival decision making, or simultaneous search, and demonstrate the best portfolio with multiple selections is more aggressive than the best singleton selections. In Section 5.2 of their paper, C&S discuss some of the characteristics of the optimal portfolio under a set of assumptions (which we discuss in Section 1.1) using this theorem. We follow C&S in referring to this theorem as the “no safety schools” theorem (NSST), though it is formally Theorem 2 in their paper. C&S show that when an individual picks one lottery from a set of many, she picks the lottery that maximizes her expected utility. Further, provided the menu allows for riskier lotteries, if the individual can pick several lotteries, her portfolio of lotteries will include the expected utility-maximizing lottery along with other more risky lotteries offering a higher payoff if the lottery is successful. In the college application example, this means that if an individual applies to two colleges (of many), she would apply to the same college as when she were only applying to one college plus a riskier college - provided there is a sufficiently dense distribution of colleges near her singleton selection.Footnote 1 This behavior has been modeled in structural papers such as Chade et al. Reference Chade, Lewis and Smith2013 and Fu Reference Chao(2014). C&S suggest that the no safety schools theorem can reduce the computational complexity of solving such problems as it permits the use of a greedy algorithm to determine optimal portfolios.Footnote 2
Recent empirical work suggests individuals make decisions inconsistent with the no safety schools theorem. In a study of an exogenous increase in the default number of score reports that a student can send to schools after taking the ACT college aptitude test, Pallais Reference Pallais(2015) finds that students, on average, sent score reports to both riskier risky colleges and safer safe colleges. This result suggests that students behaved in a manner that violates the no safety schools theorem, which predicts that students apply only to riskier schools that offer a higher ex-post payoff. Our experiments demonstrate that subjects make similar errors when making these types of decisions in a context-free environment.
While Pallais Reference Pallais(2015) is suggestive of violations of the no safety schools theorem, it is not concrete evidence of a violation. There are at least two important distinctions. The first is that the student-specific admissions probabilities across colleges are not independent. Shorrer Reference Shorrer(2019) shows that the observed behavior can be rationalized by making the outcomes not independent. Additionally, Ali and Shorrer Reference Ali and Shorrer(2021) show that in the college application decision, diversification is optimal. The second is that the benefit to attending a specific college is unknown to a researcher. While researchers can readily acquire an estimate of the benefit from attending a particular school (e.g., expected earnings), these estimates will not include idiosyncratic benefits known only to the decision-maker (e.g., being with a partner). Therefore, it is difficult to identify if students are making application decisions inconsistent with the NSST because of the complexity of the problem or because of idiosyncratic valuations. For these reasons, we test whether or not the NSST holds using an experiment.
We implement three online experiments. The first experiment (Experiment 1) uses a between-subjects design and has two primary treatments: RIVAL and RANDOM. In RIVAL treatments, the subject selects a portfolio of k lotteries from a fixed menu of lotteries. All the lotteries the subject selected are then played and the subject earns the highest (successful) prize from the outcomes of the lotteries in her portfolio. In RANDOM treatments, the subject also selects a portfolio of k lotteries from the same fixed menu of lotteries. However, the subject is paid based on the outcome of one randomly selected lottery in their portfolio. In Experiment 1, subjects are assigned to one payoff scheme (i.e., RANDOM or RIVAL) and one portfolio size (i.e.,  $k=1,2,4,or,6$).
Months after Experiment 1 was completed, we ran a second experiment (Experiment 2) to explore how subjects could improve their performance. In all treatments of this experiment, the subjects completed four practice rounds where they were told to select four lotteries. After each selection, the subject was shown the expected value of the bundle of lotteries they chose, under the RIVAL payment regime. There are three treatments in this experiment. In the first, the subject was only told the expected value of their selections; in the second, the subject was told the probability they would win each of the lotteries they selected (i.e., equivalent to the compound lottery across the selected lotteries), and in the third, the subject was told the payoff-maximizing bundle.
Two years after Experiment 2 was completed, we ran a final experiment to replicate Experiment 1 using a within-subjects design and the same menu of lotteries. In Experiment 3, the subject chose a portfolio of k lotteries and was paid based on the outcome of the highest (successful) prize from the outcomes of the lotteries in their portfolios, as in RIVAL treatments. Unlike Experiment 1, the subjects selected 4 different portfolios; one for each value of k (i.e.,  $k=1,2,4, and, 6$). Subjects were paid based on the outcome of each of the portfolios they selected.
Subjects in all experiments behave in ways inconsistent with the no safety schools theorem. In the RIVAL treatment of Experiment 1, we observe a positive relationship between subjects’ exogenously assigned portfolio size and the safest lottery in their portfolio. This finding is inconsistent with the NSST which, generally speaking, predicts that the safest lottery in the portfolio is invariant to the size of the portfolio. Additionally, holding k constant, we find aggregate decisions are nearly identical across RANDOM and RIVAL treatments. This occurs despite the theoretical predictions that RIVAL portfolios should be more aggressive. Experiment 2 illustrates that deviations from the expected value maximizing portfolio are due to the complexity of the task and that if given practice and/or feedback, performance can improve. In Experiment 3, the majority of subjects include safer lotteries in their portfolios as the portfolio size increases, which is also a violation of the NSST. This final treatment can be thought of as a replication of Experiment 1.
The remainder of the paper proceeds as follows. Section 1 describes the theory behind the no safety schools theorem and simultaneous search. Section 2 describes the experiments. Section 3 describes testable hypotheses from the experiments and Section 4 presents the results. Section 5 explores a possible explanation and the policy relevance. Section 6 concludes.
1. Conceptual framework
To illustrate the implications of the NSST consider the expected value of a portfolio containing two lotteries: A and B, where lottery i wins prize ωi with probability ρi and wins 0 with probability  $(1-\rho_i)$, where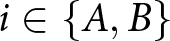 $i \in \{A, B\}$. In the RANDOM treatment the expected value is:
 \begin{equation}
\frac{1}{2}\left\{\rho_A \times \omega_A + (1-\rho_A) \times 0 + \rho_B \times \omega_B + (1-\rho_B) \times 0 \right\}.
\end{equation}
\begin{equation}
\frac{1}{2}\left\{\rho_A \times \omega_A + (1-\rho_A) \times 0 + \rho_B \times \omega_B + (1-\rho_B) \times 0 \right\}.
\end{equation}With RANDOM payoffs, the probability of lottery A being incorporated in the individual’s payoffs depends on the number of choices being made, but not on the magnitude of the payoffs between the lotteries in the portfolio. The expected value is an equally-weighted average of the expected value of the lotteries in the portfolio. The compound lottery from such a portfolio is:
 \begin{equation*}
\text{payout} =
\begin{cases}
\omega_A & \text{w.p. } \rho_A \times 1/2 \\
\omega_B & \text{w.p. } \rho_B \times 1/2 \\
0 & \text{w.p. } (1-(\rho_A+\rho_B)/2) \\
\end{cases}
\end{equation*}
\begin{equation*}
\text{payout} =
\begin{cases}
\omega_A & \text{w.p. } \rho_A \times 1/2 \\
\omega_B & \text{w.p. } \rho_B \times 1/2 \\
0 & \text{w.p. } (1-(\rho_A+\rho_B)/2) \\
\end{cases}
\end{equation*}In the RIVAL treatment the subject only receives the ex-post most favorable outcome, thus the expected value is:
 \begin{equation*} \begin{cases}
\rho_A*\omega_A + (1-\rho_A) \rho_B \omega_B + (1-\rho_A) (1-\rho_B)0 & \text{if } \omega_A \gt \omega_B \\
\rho_B*\omega_B + (1-\rho_B) \rho_A \omega_A + (1-\rho_B) (1-\rho_A)0 & \text{if } \omega_B \gt \omega_A.
\end{cases}
\end{equation*}
\begin{equation*} \begin{cases}
\rho_A*\omega_A + (1-\rho_A) \rho_B \omega_B + (1-\rho_A) (1-\rho_B)0 & \text{if } \omega_A \gt \omega_B \\
\rho_B*\omega_B + (1-\rho_B) \rho_A \omega_A + (1-\rho_B) (1-\rho_A)0 & \text{if } \omega_B \gt \omega_A.
\end{cases}
\end{equation*}Consequently, the expected value depends not only on the number of choices but also on the payouts of the other lotteries. The compound lottery from such a portfolio is:
 \begin{equation*}
\text{payout} =
\begin{cases}
\text{if } \omega_A \gt \omega_B
\begin{cases}
\omega_A & \text{w.p. } \rho_A \\
\omega_B & \text{w.p. } \rho_B (1-\rho_A) \\
0 & \text{w.p. } (1-\rho_B) (1-\rho_A) \\
\end{cases}
\\
\\
\text{if } \omega_B \gt \omega_A
\begin{cases}
\omega_B & \text{w.p. } \rho_B \\
\omega_A & \text{w.p. } \rho_A(1-\rho_B). \\
0 & \text{w.p. } (1-\rho_A) (1-\rho_B) \\
\end{cases}
\end{cases}
\end{equation*}
\begin{equation*}
\text{payout} =
\begin{cases}
\text{if } \omega_A \gt \omega_B
\begin{cases}
\omega_A & \text{w.p. } \rho_A \\
\omega_B & \text{w.p. } \rho_B (1-\rho_A) \\
0 & \text{w.p. } (1-\rho_B) (1-\rho_A) \\
\end{cases}
\\
\\
\text{if } \omega_B \gt \omega_A
\begin{cases}
\omega_B & \text{w.p. } \rho_B \\
\omega_A & \text{w.p. } \rho_A(1-\rho_B). \\
0 & \text{w.p. } (1-\rho_A) (1-\rho_B) \\
\end{cases}
\end{cases}
\end{equation*}The compound lottery depends on which lottery has a higher prize and on the outcomes of both lotteries. Obviously, as the size of the portfolio increases so does the complexity of the expected value of the portfolio. Thus, we speculate that subjects find calculating the optimizing bundles to be cognitively costly. That is, one might need to exert some effort in order to perform such calculations, as in Tirole Reference Tirole(2009). One response to the cognitive cost of calculating the optimal bundle would be to ignore the dependence between the lotteries. We discuss this possibility in greater detail in Section 5.1. If subjects do so, then the ‘perceived’ or ‘computed’ payouts in the RIVAL and RANDOM treatment are identical.
1.1. The no safety schools theorem
Chade and Smith Reference Chade and Smith(2006) study the properties of the optimal portfolio when payoffs are rival. Specifically, they study an environment in which individuals must simultaneous choose among stochastic outcomes with known valuations, where each choice incurs a cost. C&S show that the best portfolio contains the singleton choice with the highest expected utility. With k > 1, the decision-maker does not select safer choices (i.e., higher probability of success) unless the safer choice offers a higher expected utility (e.g., higher prize). Consequently, C&S state that “static portfolio maximization precludes ‘safety schools’.” In the context of our experiment this implies two things: (i) the best portfolio will include the singleton lottery offering the highest expected utility and (ii) that the lotteries chosen when  $k \geq 2$ will be made up of lotteries that are weakly riskier than the lottery selected when k = 1. In Section 3 we analyze the implications of the NSST for the choices involved in our experiments. These experiments align with the “downward recursive” static portfolio choice problems from C&S.
By continuity, this result obviously holds even when all lotteries are not literally identical and there is a sufficiently dense and diverse collection of lotteries. So, in the context of the college application problem, for low enough application costs, one always has an incentive to gamble upward and apply to a better college than the rest of the colleges in their current portfolio of applications. This conclusion however, relies on there being a large and diverse number of colleges that an individual is choosing amongst. To see why this is necessary, suppose there are three colleges: A with  $\rho_A=1$ and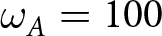 $\omega_A=100$; B with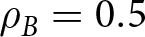 $\rho_B=0.5$ and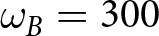 $\omega_B=300$; and C with $\rho_C=.01$ and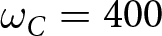 $\omega_C=400$. Clearly, for a risk neutral person, the optimal single choice is B. The expected values for the three different two-choice portfolios are AB= 200, AC=103, BC = 152.5. Here the best choice is AB, despite college A being much safer than college C.Footnote 3 The selection of this safer college occurs in part because the expected value of college A far exceeds the expected value of lottery C. This menu lacks a lottery which is equal to A in expected value, but also riskier than A. The menu of options available to subjects in our experiments is designed to avoid such obvious cases.
2. Methods
We conduct experiments on Amazon Mechanical Turk (AMT).Footnote 4 As many know, AMT is an online workplace where workers (subjects) complete Human Intelligence Tasks (HITs) posted by requesters (the experimenters) for pay. HITs are typically posted in batches of 25 to 100. We regard batches as equivalent to sessions in the lab. The number of HITs in a batch limits the number of subjects that can participate in a given session. HITs are usually short, requiring about 5 to 10 minutes and paying under a dollar. The hourly wage for workers on AMT is generally quite low. A recent Pew Poll reports roughly 50% of workers earn less than $5 per hour.Footnote 5 Our hourly wage is significantly higher at approximately $9.50 per hour in Experiment 1 and over $30 per hour in Experiment 2. Payments, in US dollars, are made through Amazon Payment accounts that are linked to workers’ randomly generated AMT worker ID numbers. Some subjects manage to participate more than once (due to lags in the qualifications being assigned), we drop the second appearance of any subject who participated more than once from the analysis - though we pay them for their decisions.
Subjects’ compensation for completing an HIT typically has two components: (i) a fixed participation fee (essentially a show-up fee) and (ii) a bonus awarded after the subject has completed the HIT. The fixed participation fee is the same for all subjects while the bonus is determined by the outcomes of the selected lotteries. If a subject does not adequately complete an HIT a requester has the option of rejecting the HIT. This is costly to subjects because rejected HITs negatively impact the subject’s official approval percentage. Once a subject’s approval percentage gets too low, they are no longer eligible for many of the posted HITs. The reliability of AMT subjects and experiments has been the subject of several recent studies. Hauser and Schwarz Reference Hauser and Schwarz(2016) shows that workers on AMT tend to be no less attentive to instructions than laboratory subjects, while Mullinix et al. Reference Mullinix, Leeper, Druckman and Jeremy(2015) shows that AMT results are quite comparable to student-based samples. Johnson and Ryan Reference Johnson and Ryan2020 shows that subjects give consistent responses to questions asked years apart.
2.1. General design
The experiments are similar and consist of multiple stages. A timeline of the experiments is found in Figure 1. In the first stage, subjects accept the HIT and consent to participate in the experiment and have their data used in academic research. After accepting the HIT subjects move to the second stage where they complete a short survey that collects basic demographic information, tests the subject’s ability to calculate expected value and ensures that the subject understands written English. Subjects who incorrectly answer the English comprehension question are not allowed to continue and are instructed to return the HIT so another subject can complete it.Footnote 6 After the survey is completed, subjects move to the third stage, where they are given treatment-specific instructions. Having read the instructions, they move to the fourth stage and make their decisions.
Experimental timeline

In all experiments, subjects are asked to select a portfolio (or portfolios in Experiments 2 and 3) of k lotteries (where k is 1, 2, 4, or 6) from the set of lotteries shown in Table 1. The lotteries range from a 5% chance of winning $5 to a 100% of winning $0.25, where a 5% increase in the probability of winning reduces the possible prize by $0.25. We shape our experimental design to match the fixed sample size case discussed in Chade and Smith Reference Chade and Smith(2006) in which the number of lotteries a subject can select is exogenously assigned. Moreover, like in C&S the probabilities are independent across choices unlike Shorrer Reference Shorrer(2019). However, it is important to note that this design choice does not impact the primary predictions of the NSST. One can think of our design as a special case in which the cost of the first k lotteries is zero and the cost of the k + 1 lottery is infinity.
Lotteries in experiment - characteristics and optimal bundles
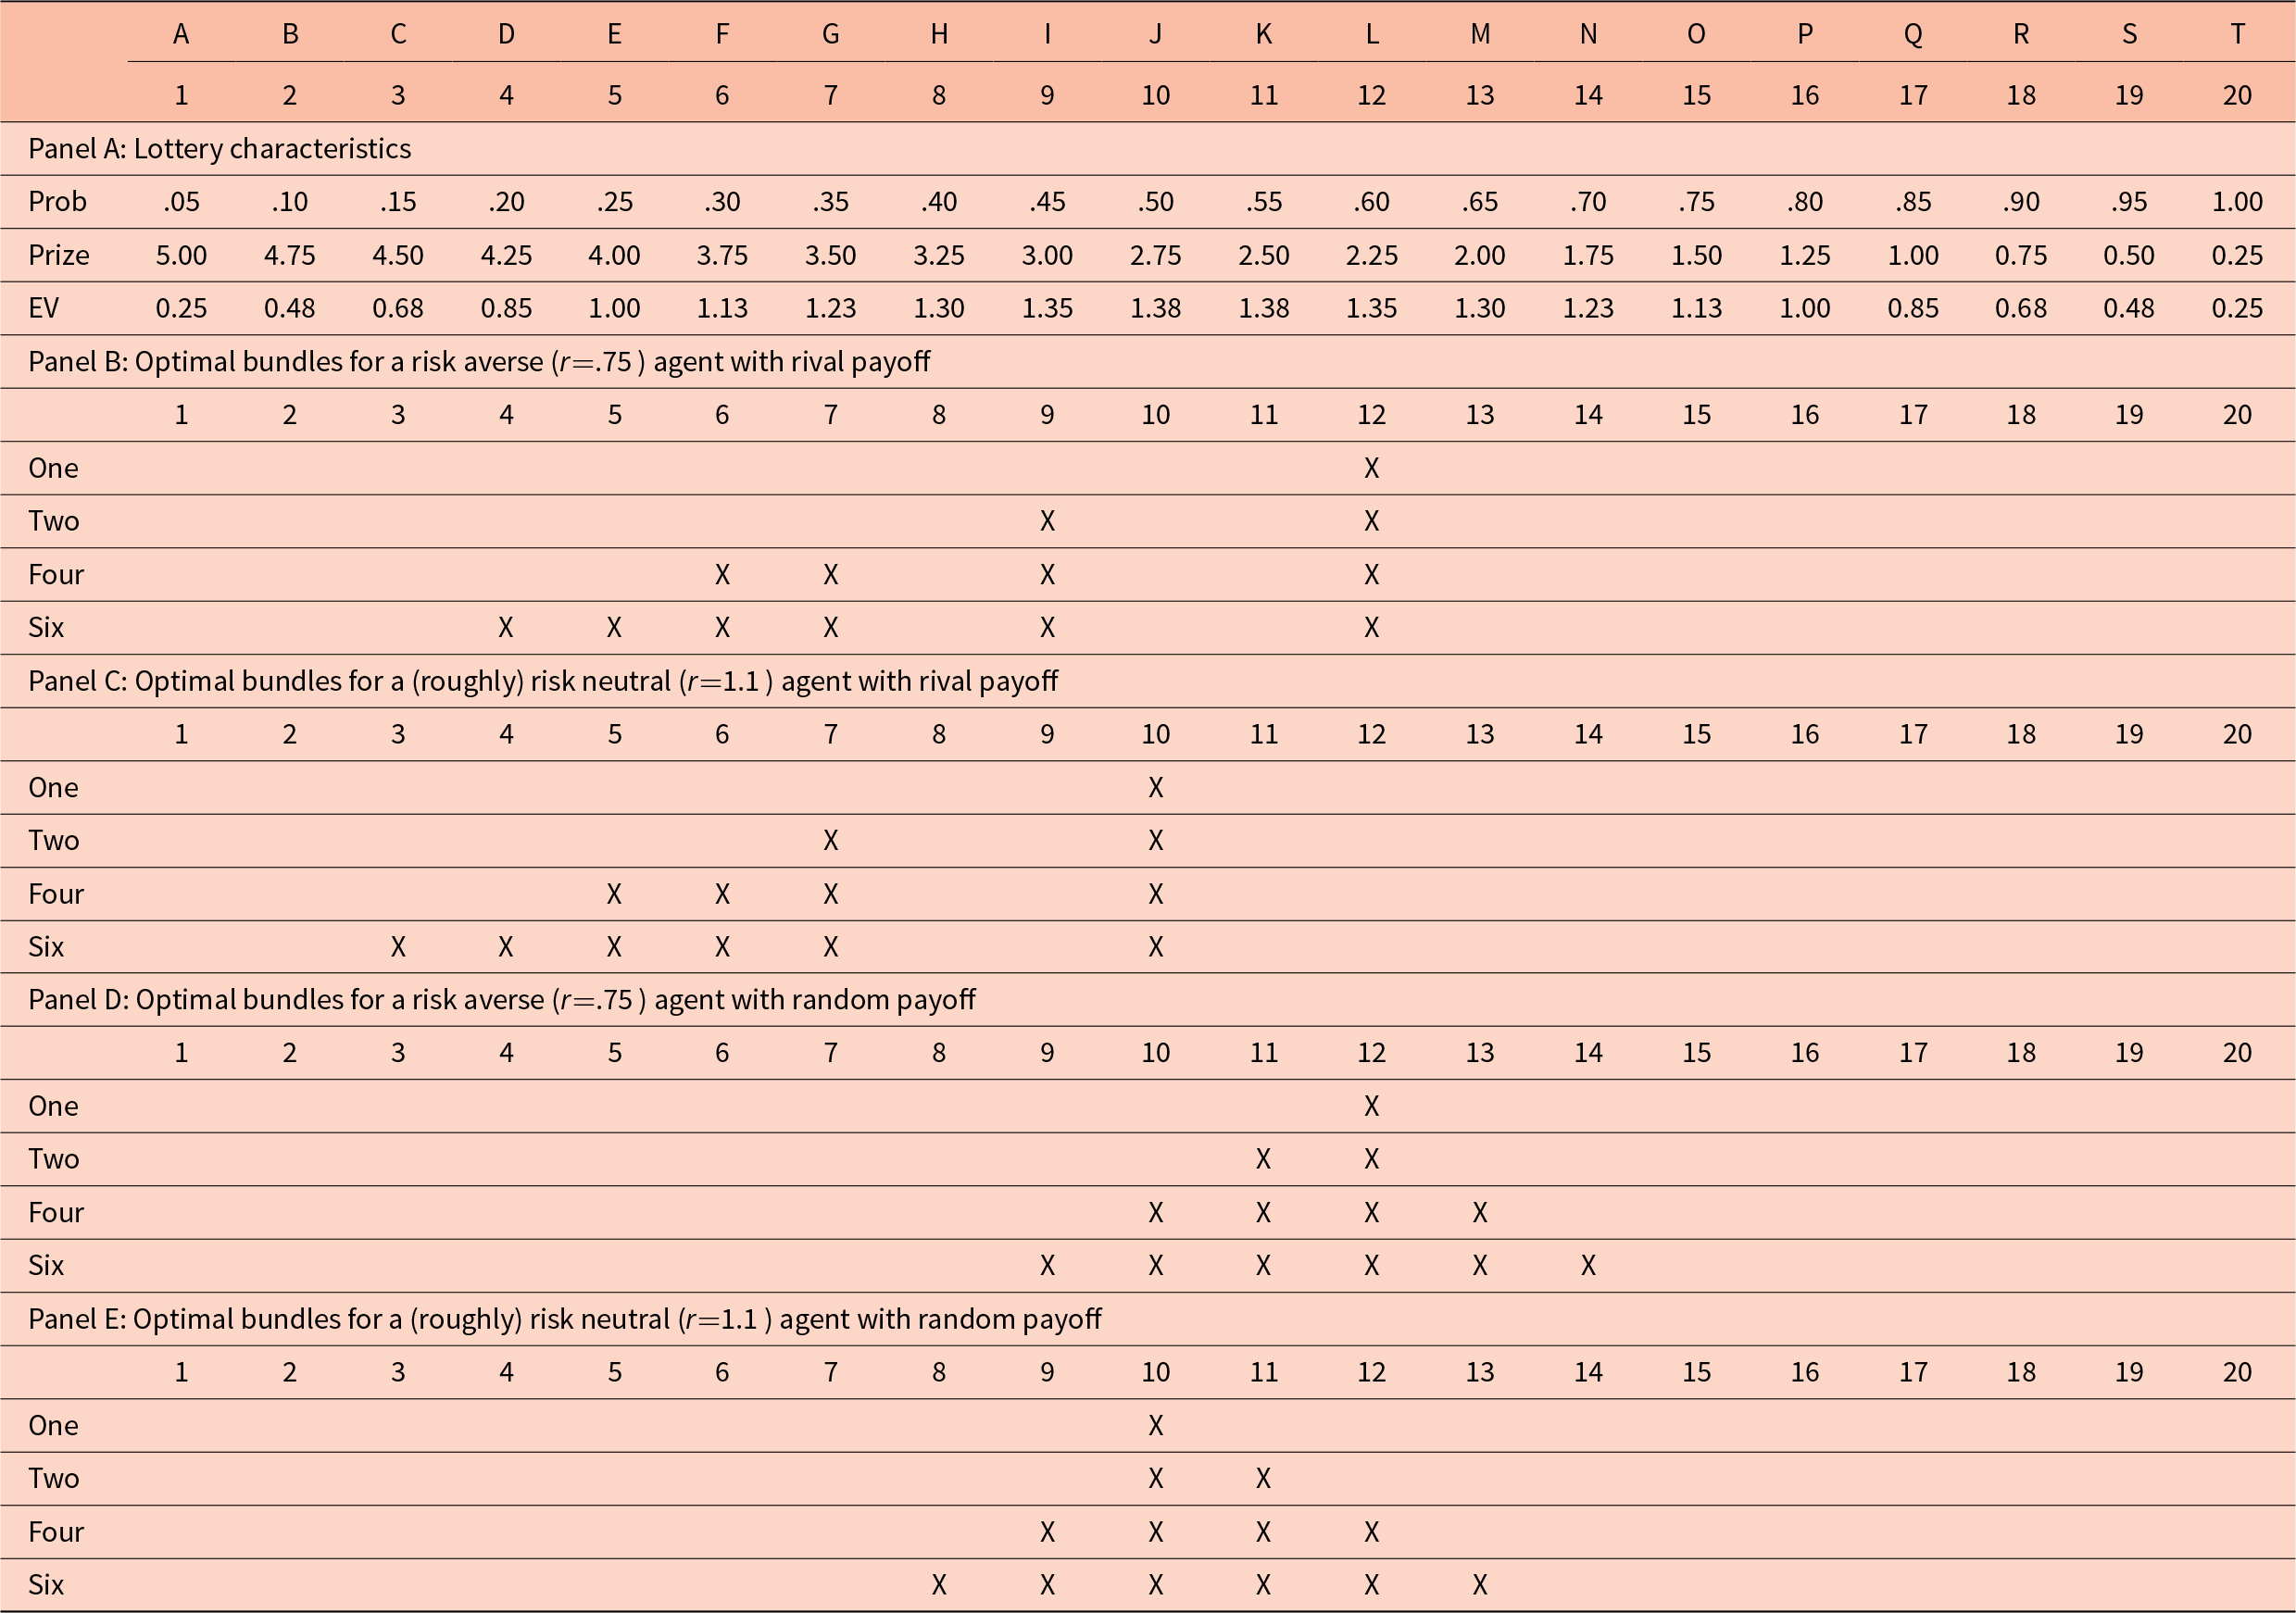
Notes: Panel A: Lotteries used in the experiment. Prob is the probability of wining the prize (Prize). EV is the expected value of the lottery. Panels B, C, D, and E indicate the expected utility maximizing portfolios of lotteries under the the different payoff schemes (rival and random), number of lotteries that may be chosen (one, two, four, and six), and risk preferences (r) assuming the following utility function:  $u(w)=w^r$.
The set of lotteries is fixed for all subjects and experiments. Subjects observe each lottery’s prize and the probability of winning the prize. To prevent confusion, each lottery’s expected value is also shown. While this may impact decisions, it is common across all treatments.Footnote 7
In all experiments, lotteries are labelled by a letter of the alphabet (as seen in Table 1). We observe whether a lottery was selected but not the order in which it was selected. To simplify the analysis and discussion, we index the lotteries from 1 to 20. Lotteries lower in number are riskier but have a higher payout. This set of lotteries is likely to satisfy the density assumption on Chade and Smith Reference Chade and Smith(2006) for the vast majority of subjects. Table B.7 shows the expected utility maximizing portfolios for agent’s with different levels of risk aversion. For most levels of risk aversion, the agents will choose an interior set of the lotteries. The most risk loving subjects would prefer to choose riskier lotteries than we made available. These subjects require careful consideration in the within–subject analysis. Agents who would prefer to choose safer lotteries than we made available do not complicate the predictions of the NSST in the same way.
After making their decisions subjects move to the fifth stage. Here subjects answer two follow-up questions (i.e., indicate their favorite and least favorite lottery) and complete another survey. The final survey includes a subjective risk preference question, the Barratt Impulsiveness Scale questions (Barratt et al., Reference Barratt, Patton and Stanford1975) and others. The risk question comes from the German Socio-Economic Panel Survey, which translates to: “How do you see yourself: Are you generally a person who is fully prepared to take risks or do you try to avoid taking risks?”
Subjects answer this question on an 11 point scale ranging from 0 “I avoid risk” to 10 “Fully prepared to take risks.” We use this question because past research shows that subjects indicating a greater willingness to take risks take on more risk in experiments (Dohmen et al., Reference Dohmen, Falk, Huffman, Sunde, Schupp and Wagner2011; Nosić & Weber, Reference Nosić and Weber2010; Lönnqvist et al., Reference Lönnqvist, Verkasalo, Walkowitz and Wichardt2015).
Naturally, the portfolio of lotteries a subject select depends on their risk preferences. For example, a risk-averse subject would probably have a singleton choice that was greater than lottery 11 while a risk-loving subject would have a singleton choice less than lottery 10. We use the answers to the SOEP question above to control for this heterogeneity when estimating treatment differences. Once the final survey is completed, subjects are instructed to submit the HIT. In the sixth and final stage, subjects are informed (by email) of the results of their lottery choices and are paid based on the outcome of those choices. Subjects are paid a 25 cent participation fee, plus their bonus. The survey questions along with both experiments’ instructions can be found in Appendix B.1. A screenshot of an example choice page can be found in Appendix B.2.
Below each lottery in Table 1, we also present an approximation of the implied level of risk aversion, assuming isoelastic utility (i.e.,  $u(w)=w^r$), if a subject selects that lottery, when k = 1. The implied curvature parameter (r) for each lottery choice when k = 1 is found using a method similar to what is used in Andreoni and Harbaugh Reference Andreoni and Harbaugh(2010).Footnote 8 Given that the probability that a lottery will be successful is $\frac{I}{20}$ and the prize won if the lottery is successful is $5(1-\frac{I-1}{20})$ - where I is the index number of the lottery (e.g., the second row of Table 1), the expected utility of any given lottery is,
 \begin{equation}
E[U]=\Big(\frac{I}{20}\Big)\Big(5\Big(1-\frac{I-1}{20}\Big)\Big)^{r}
\end{equation}
\begin{equation}
E[U]=\Big(\frac{I}{20}\Big)\Big(5\Big(1-\frac{I-1}{20}\Big)\Big)^{r}
\end{equation} To find the expected utility maximizing lottery, when k is equal to 1, all that has to be done is take the partial derivative of Equation 2 with respect to the I and solve for the index number at which the slope of  $E[U]$ (i.e., $\frac{\partial E[U]}{\partial I}$) is zero. Doing so results in the equation below:Footnote 9
 \begin{equation}
I^*=\frac{21}{r+1}
\end{equation}
\begin{equation}
I^*=\frac{21}{r+1}
\end{equation} Therefore, for each  $I^*$, there is a r which rationalizes the k = 1 choice. We then use this r to numerically determine the expected utility-maximizing portfolio under portfolio sizes of 2, 4, and 6. However, it should be noted that for each lottery, excluding lotteries 1 and 20, there is a range of curvature parameters (rs) that could rationalize each lottery. Lotteries 1 and 20, on the other hand, can be rationalized with an infinite number of rs.
In Tables B.7 and B.8 we present the optimal portfolio of lotteries under the rival (Table B.7) and random (Table B.8) payoff schemes for several different levels of risk aversion when  $k=$1, 2, 4, and 6. We do so to demonstrate that different levels of risk aversion will yield different optimal portfolios and that these portfolios will generally have properties that are consistent with the NSST when the lotteries are rival which will occur if the lotteries are sufficiently dense. Specifically, as the bundle size increases, the riskiest lottery in the bundle becomes riskier and the safest lottery remains the lottery that would be chosen when $k=$1. Exceptions occur when the decision-maker is very risk-loving and the portfolio size is large.Footnote 10
2.2. Experiment 1
In the fourth stage of Experiment 1, subjects are told to select k lotteries from a set of 20 lotteries. We vary k to explore how choices differ across subjects who are given relatively few choices from those who are given more choices. We also vary the payment rule. Payments are either RIVAL and based on the maximum successful outcome of the subject’s lottery choices, or RANDOM and based on one randomly selected lottery from their portfolio. We use these two payment rules to explore whether or not subjects’ choices differ across the payment rules, holding the number of choices fixed. This means subjects only see one payment rule and select either 1, 2, 4, or 6 lotteries from the set of 20. We refer to treatments in Experiment 1 using both the payment rule (RANDOM or RIVAL) and the number of choices (1, 2, 4, and 6). Therefore, we have seven treatments in Experiment 1. ONE|RIVAL and ONE|RANDOM have identical payment rules, we refer to the treatment ONE as the “CONTROL”.Footnote 11
We initially chose this between-subjects design for two reasons: (i) simultaneous search problems involve selecting only one portfolio and (ii), we wanted to avoid as much confusion as possible.
2.3. Experiment 2
Experiment 2 can be thought of as a replication of the FOUR|RIVAL treatment but with the addition of practice in stage 4. We denote these treatments as “FOUR|P” hereafter. In each of these treatments, subjects make three practice bundle selections prior to making their final bundle selection. After each practice selection, we show subjects the expected value of the bundle and the lotteries within the bundle they selected. This information is displayed during each subsequent period. This design was chosen as we want subjects to be able to observe how the expected value of their bundles change with changes in their lottery selections. Moreover, by allowing subjects to see all of their practice decisions, we avoid problems associated with differential memories across subjects. The portfolio size in Experiment 2 is always four.
Across the practice treatments, we vary the amount and type of information that subjects receive. In the simplest treatment, subjects are only presented with the expected value of their bundle, we denote this FOUR|P. In a second treatment, we display the simple lottery that their bundle reduces to. That is, subjects are told the likelihood of receiving each of the four prizes from the selected lotteries. We denote this treatment as FOUR|P+ SIMPLE. Finally, in a third treatment, we explicitly tell subjects which bundle has the highest expected value after they have completed all of the practice rounds, but before they make their final selection. We call this treatment FOUR|P+SIMPLE+BEST.
2.4. Experiment 3
Experiment 3 is, except for the fourth stage, nearly identical to the RIVAL treatments of Experiment 1. Instead of selecting a single portfolio, subjects are told they will play several “games” (one for each portfolio size, k) in which they will be asked to select a portfolio of lotteries from the set of lotteries seen in Table 1. Thus, we have within–subject variation in k. Subjects are also told that the size of the portfolio will be different in each of the games they play. They are not told what the values of k can take until a game starts. The order of k is randomly assigned at the start of the experiment (across permutations of 1, 2, 4, 6). Subjects are also truthfully told that they will be paid based on their decisions in each of the games and that their decisions in one game will not impact the outcome of another one.Footnote 12 One should think of this as a within-subjects test of the NSST.
3. Hypotheses
We now derive a set of testable hypotheses that follow from the no safety schools theorem. To begin, we calculate the portfolios of lotteries of size k that maximize expected utility with rival and random payoffs for a risk-averse (RA) and risk-neutral (RN) agent using the lotteries in our experiments. The risk-averse agent has isoelastic utility (i.e.,  $u(w)=w^r$) with r = .75.
The results of these calculations are shown in Table 1 Panels B through E. In these panels, an “X” indicates that a lottery is an element of an expected utility maximizing portfolio conditional on a given curvature parameter.Footnote 13 We present these choices to provide readers with a general sense of how the expected pattern of choices differs across random and rival payoffs, though both curvature parameters are reasonable given subjects’ decisions. Predicted choices differ depending on risk preferences, however, the NSST applies to all expected utility maximizers—meaning that while the expected utility-maximizing k = 1 choice might shift, the pattern of choices should remain (i.e., if subjects behave according to NSST predictions, as k increases, the riskiest lottery selected gets riskier).
As predicted by the NSST, with rival payoffs, all optimal portfolios include the expected utility-maximizing lottery. Additionally, as k increases, the optimal portfolio generally includes only lotteries that are riskier than the k = 1 choice—so long as the original choice is not sufficiently risky. With random payoffs, this changes – as k increases, the predicted portfolio contains lotteries that are riskier and safer than the k = 1 choice—again, so long as the original choice is not sufficiently risky. Thus, we posit two primary hypotheses derived from the no safety schools theorem, which we test using Experiment 1. These hypotheses are stated in terms of the null hypothesis that subjects maximize their expected utility.
Hypothesis 1. In RIVAL treatments, the safest lottery selected by subjects is invariant to k.
Recall that if payoffs are determined by a lottery selected at random, an expected utility maximizer would select the k lotteries with the highest expected utility. Thus, the RANDOM payoff rule should lead to a pattern of choices similar to those depicted in Table 1 Panels D and E. This should occur in Experiments 1, 2, and 3.
Hypothesis 2. Holding k fixed, bundles in RIVAL will have riskier riskiest lotteries and riskier safest lotteries than bundles in RANDOM. In other words, the average index number will be lower in RIVAL treatments.
This decision environment is likely unfamiliar to many subjects and many might find it difficult, see 5.1 for more details. Therefore, practice rounds or additional information might be useful.
Hypothesis 3. Subjects given feedback will select riskier lotteries.
4. Results
We report the results of the experiments as follows: Section 4.1 reports the results of Experiment 1, demonstrating subjects make decisions inconsistent with the NSST; we then show that decisions made by subjects in RANDOM and RIVAL treatments do not significantly differ. In Section 4.2, we give evidence that advice and/or experience improves outcomes. Finally, in Section 4.3 we present the results of Experiment 3 and show that behavior is inconsistent with the NSST using a within-subjects design rather than a between-subjects design.
Though not of primary interest, summary statistics for each of the demographic variables are found in Tables B.1, B.2 and B.3 of the Appendix. A comparison of the means of subject characteristics across all treatments are found in Figure B.2. The kernel density plots of the least favorite and favorite lottery, a survey question, by treatment are found in Figure B.3. Overall, and across all treatments, the favorite lottery is lottery 10 or 11 and the least favorite is lottery 1 or 20.
4.1. Experiment 1
Across all treatments of Experiment 1, 294 subjects participate in the experiment. Subjects earn between $0 and $5 (US), plus the 25 cent participation fee. On average subjects spend about 16 minutes completing the experiment and earn $2.33—translating to a wage of about $9.60 per hour, roughly double the typical hourly wage on AMT at the time the experiment was run.Footnote 14 Table 2 provides a breakdown of the number of subjects, safest, riskiest, and mean lotteries in a portfolio by treatment along with simple hypothesis tests of treatment equality.
Riskiest and safest lottery and average portfolio

Notes: Average choices across treatments. Safest is the safest lottery selected by the subject. Riskiest is the riskiest lottery selected. Last, Average is the average index number of the lotteries in the portfolio.
We gather information regarding the gender, age, education, country of residence, and income of subjects. Roughly 90% of the subjects are American and almost all of the remaining subjects are Indian. Detailed descriptions of these variables can be found in Appendix A.1. Table B.1 presents summary statistics of demographic characteristics and choices. We use these variables to control for individual characteristics when testing the NSST. The data is generally complete as the software prevents empty fields. There is some user error. One subject reported being over 300 years old. However, this same subject participated in a different experiment in the same year and reported to be 23. Given they entered “323” in this experiment it is safe to say that this is a case of “fat fingers.” We manually changed this subject’s age to 23, results are also robust to dropping this observation.
We first present two results demonstrating that subjects do not adhere to the no safety schools theorem. We then provide suggestive evidence that subjects are mostly treating the lotteries as if they are independent.
Result 1.
The safest lottery selected becomes safer as the number of lotteries in the portfolio, k, increases.
Table 3 presents the results of models testing the no safety school theorem, a test of Hypothesis 1. All models compare choices made by treatment assignment relative to control. Models 1 and 2 are Ordered Probit estimates of the safest lottery subject i chose and Models 3 and 4 are OLS estimates of the average index number of the lotteries subject i chose.
Experiment 1: Results

Notes: Models 1 and 2 are Ordered Probits estimating the safest choice. Models 3 and 4 are OLS estimating the average lottery chosen. Controls in Models 2 and 4 include age, subjective risk preferences, gender, education level fixed effects, and income level fixed effects. One subject is missing in Models 2 and 4 due to missing income and risk preference data. Coefficient estimates for controls are in Table B.4 (Online Appendix). Z/T-statistics based on subject-clustered standard errors in parentheses. P-values from F-tests of coefficient equality. Comparisons are indicated by letter (e..g, a=b indicates the equality of the coefficient test for TWO|RIVAL and TWO|RAND). R2 is Pseudo R2 for Models 1 and 2.
Odd numbered models in Table 3 are baseline models with no control variables. Even numbered models demonstrate that the results are robust to the inclusion of demographic and risk preference variables. The general format of the Ordered Probit model estimating i’s average lottery bundle is as follows:
 \begin{equation}
\text{safest}_{i} = \sum_{k=1}^T \{\beta_k I(t_{i}=k) \} + \text{controls}_{i} \ \textbf{}\gamma + \epsilon_{i}
\end{equation}
\begin{equation}
\text{safest}_{i} = \sum_{k=1}^T \{\beta_k I(t_{i}=k) \} + \text{controls}_{i} \ \textbf{}\gamma + \epsilon_{i}
\end{equation} Here,  $\text{safest}_i$ is the safest lottery in the bundle chosen by subject i. Operationally, this if the largest index number in their bundle. The T = 3 different βk coefficients correspond to the marginal effect of individual i being in one of three portfolio size treatments, relative to the control group. The control group are those who select only one lottery, while those selecting more than one lottery are in the treated groups. Thus, the nulls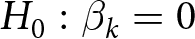 $H_0:\beta_k = 0$ are interpreted as tests for whether choices made by individuals in the treated group are equal to those made by individuals in the control group. Positive coefficients correspond to safer choices and negative coefficients correspond to riskier choices. Models 1 and 2 demonstrate that subjects in 2|RIVAL, 4|RIVAL, and 6|RIVAL select a safest lottery that is statistically significantly safer than the safest lottery selected by subjects in the control. This is inconsistent with the NSST and evidence against Hypothesis 1.
Models 3 and 4 in Table 3 test an implication of Hypothesis 1. Recall that the NSST implies that as the number of choices increases, the decision-maker will select increasingly risky choices. At the same time, the safest lottery does not change. In the context of the experiment, this means that as the number of lottery choices (k) increases, the average lottery index (of the lotteries in a given bundle) number should fall. Models 3 and 4 demonstrate that subjects who are given more choices have an average lottery index number that is not significantly different than subjects in the control (1).
To check whether or not providing subjects the expected value of each lottery altered behavior, we ran an additional batch of FOUR|RIVAL in which subjects were not told the expected value of each lottery (n = 40). The average safest, and average riskiest lotteries in this treatment was 14.45 and 7.425, respectively.Statistically, these were not significantly different from the primary treatment (t-test: 14.957 vs 14.45, p = 0.528; t-test: 7.702 vs 7.425, p = 0.792). The average of the index numbers of the portfolios were also not statistically different (t-test: 11.457 vs 11.269, p = 0.807).
Result 2.
Holding k fixed, subjects do not choose riskier portfolios in RIVAL compared to RANDOM treatments.
We now test whether portfolios change when the outcomes are not rival. To do so, we estimate a set of models similar in format to Equation 4. These new models include data, and dummy variables, corresponding to the treatments in which subjects’ payoffs are determined by the outcome of a randomly selected lottery (RANDOM). If subjects are not taking into account the rival nature of the lotteries then, holding the number of choices fixed, lottery choices should be the same across RANDOM and RIVAL treatments. These results are presented in Table 4. Models 1 and 2 are Ordered Probits estimating the safest lottery a subject selected as a function of their assigned treatment (i.e., number of choices and payment rule). Models 3 and 4 are OLS estimates of the average index number of the lotteries selected. Again, the omitted group in all models is the control (1). Models 2 and 4 include the same demographic controls used previously. As in Table 3, positive coefficient estimates correspond to safer lotteries relative to the control, while negative coefficients correspond to riskier choices.
Do subjects understand the joint probabilities? no

Notes: Models 1 and 2 are Ordered Probits estimating the safest choice. Models 3 and 4 are OLS estimating the average lottery chosen. Controls in Models 2 and 4 include age, subjective risk preferences, gender, education level fixed effects, and income level fixed effects. One subject is missing in Models 2 and 4 due to missing income and risk preference data. Coefficient estimates for controls are in Table B.4 (Online Appendix). Z/T-statistics based on subject-clustered standard errors in parentheses. P-values from F-tests of coefficient equality. Comparisons are indicated by letter (e..g, a=b indicates the equality of the coefficient test for TWO|RIVAL and TWO|RAND). R2 is Pseudo R2 for Models 1 and 2.
Chosen expected values vs expected value of optimal bundle

Notes: Average expected earnings of subjects’ choices by treatment (EV), expected value of the earnings maximizing bundle or maximum expected earnings (MEE), and the percent difference (% DIFF).
We reject the null of Hypothesis 2 and find evidence that subjects choose broadly equivalent portfolios in the RIVAL and RANDOM treatments. All of the coefficients in Model 1 and Model 2 are positive, subjects with more choices in both RIVAL and RANDOM treatments select safer lotteries relative to those with only one choice. Moreover, the majority of these coefficients are highly statistically significant and the coefficients tend to increase with k. We now compare the pattern of lottery selections in RANDOM and RIVAL, holding k fixed. Below each model in Table 4 we test, using a series of F-tests, the null hypotheses that subjects in RANDOM treatments select a safest/average lottery that is the same as subjects in RIVAL treatments, holding the number of choices constant (e.g., H0: TWO|RIVAL = TWO|RANDOM). In the majority of cases, we fail to reject the null hypothesis. Given that the pattern of behavior in RIVAL is similar to what is observed in RANDOM, this suggests subjects are making decisions as if the lotteries are independent. While we reject the null when subjects are given six choices, this rejection works against the NSST because subjects in SIX|RIVAL have a safer safe lottery and select lotteries that are on average safer than those in SIX|RANDOM.
To give an idea of how much money is being “left on the table”, we present the difference between the average expected value of the bundles selected by subjects and the expected value of the bundle that maximizes expected earnings % DIFF. On average, in RIVAL, subjects leave about 20% of the potential earnings or about $0.50. While this may seem like a small amount, it is slightly more than what a subject could expect to earn if they completed a different task on AMT. Further, the amount of earnings left on the table increases as the number of choices increases.
4.2. Experiment 2
We now explore how bundle selection changes with experience. This is done to test whether the observed behavior is due to unfamiliarity with this type of choice problem. To evaluate the effect of these treatments, we begin by testing whether the new pre-selection information changed initial choices. We do this by comparing the initial choices made in the practice treatments to choices in FOUR|RIVAL of Experiment. These comparisons are found in Table 6. Table 6 presents OLS and Ordered Probit results to identify significant differences across the practice treatments and FOUR|RIVAL (Constant), as well as differences across the three practice treatments. The only statistically significant difference is that subjects in FOUR|P+SIMPLE initially choose riskier safe lotteries than subjects in FOUR|RIVAL. In comparing across practice treatments, the only statistically significant difference is that individuals in FOUR|P+SIMPLE+BEST and FOUR|P+SIMPLE choose riskier risky lotteries than those in FOUR|P. In sum, the differences in initial selections are probably modest.
Result 3.
Experience and information increases the riskiness of both the safest and riskiest elements of a portfolio.
Initial selections in practice treatments vs. FOUR|RIVAL

Notes: Models 1 and 2 are OLS estimating subjects’ expected earnings and average lottery. Models 3 and 4 are Ordered Probits estimating subjects’ riskiest and safest choice. Z/T-stats based on subject clustered standard errors in parentheses. P values derived from F-tests of equality of coefficients presented in the final 3 rows. Comparisons are indicated by letter (e..g, a=b indicates the equality of the coefficient test for TWO|RIVAL and TWO|RAND). R2 is the Pseudo R2 for Models 3 and 4 (Ordered Probits).
We now examine how information and experience with these types of problems influence decisions. This is done using (subject) fixed effects regressions. These results are presented in Table 7. The regressions compare selections in practice rounds 2, 3, and final selections to the initial selection made by the subject. Within the practice-only regressions (FOUR|P in Table 7), we find subjects choose both riskier risky picks and riskier safe picks in period 2 and in the final round but less so in period 3. Interestingly, the coefficients for period 2 and the final selections are quite similar, suggesting that subjects choose similarly in period 2 and the final round and are therefore exploring the decision space (i.e., find how their selections change their payoffs). Consequently, subjects benefit from the experience.
The effect of practice on subjects’ decisions
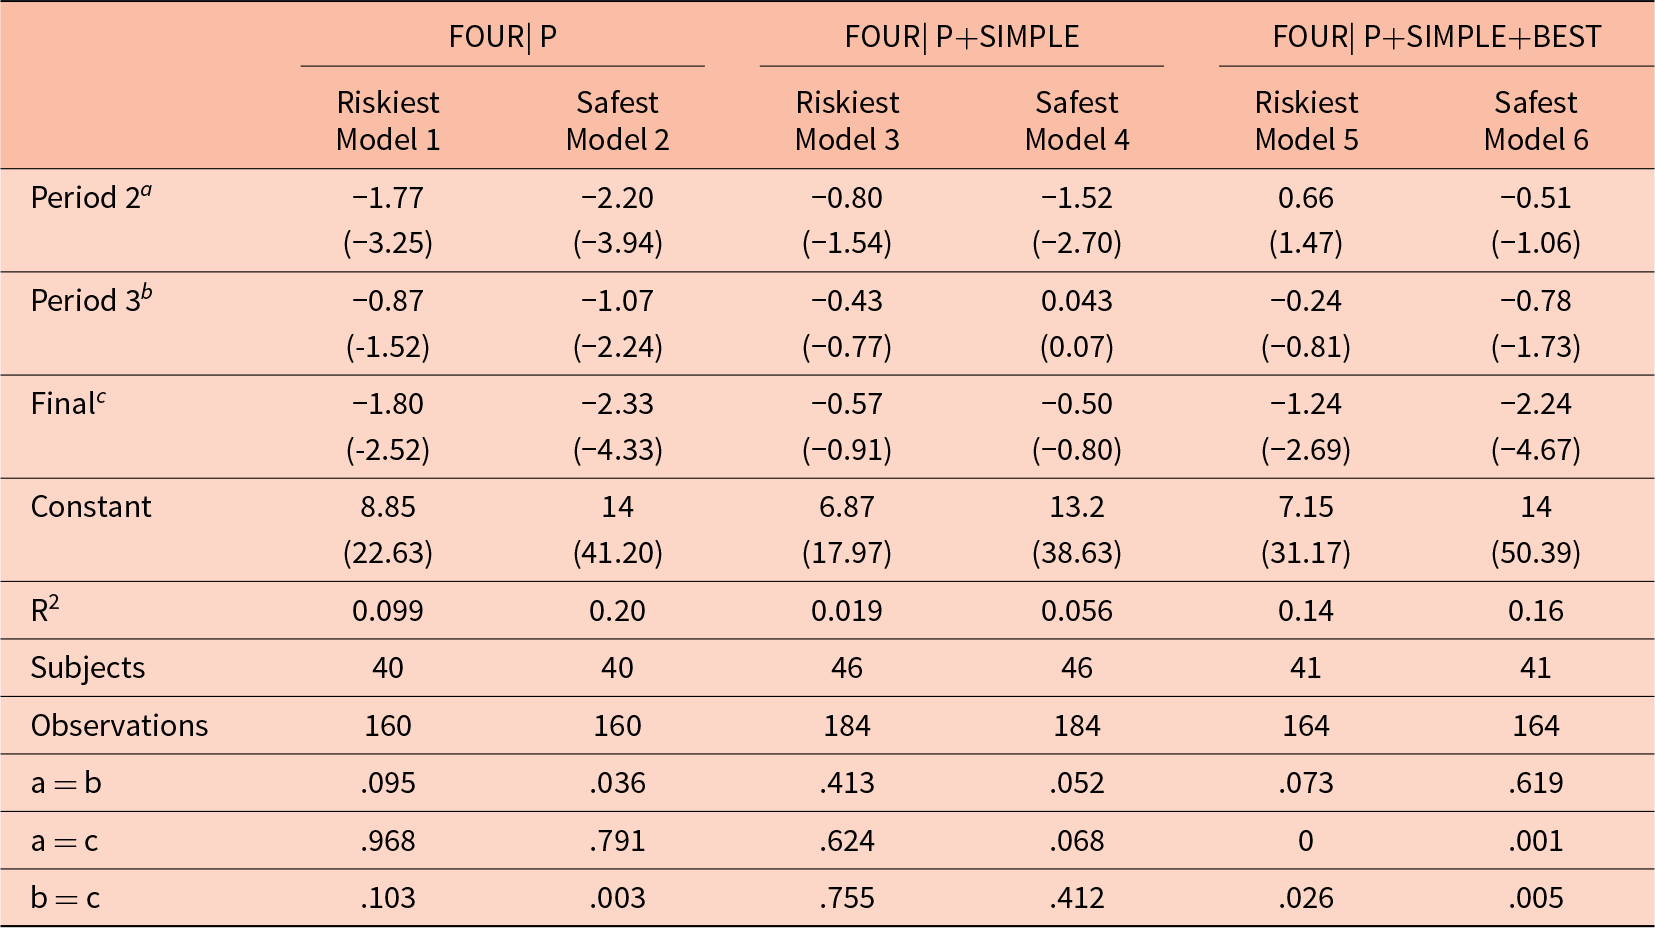
Notes: Fixed Effects Panel Regression results. Z/T-stats based on subject clustered standard errors in parentheses. Groups of 41-46 subjects and 4 observations per group. P values derived from F-tests of equality of coefficients presented in the final 3 rows.
Examining the choices in FOUR|P+SIMPLE and FOUR|P+SIMPLE+BEST reveals that little changes across most of the practice rounds - which is different from FOUR|P but expected. In both of these treatments, subjects are informed of how the rival nature of payoffs influences the contribution of risky and safe lotteries to the expected value of their portfolio. Subjects in FOUR|P+SIMPLE choose riskier safe picks compared to their initial selections but only in Period 2. This is different from the final practice treatment. Recall in FOUR|P+SIMPLE+BEST subjects are informed of the expected value maximizing bundle of lotteries prior to making their final selection. Overall, we find 32% of subjects in FOUR|P+SIMPLE+BEST selected the expected value maximizing portfolio while no subjects in FOUR|P and FOUR|P+SIMPLE did so. This finding is interesting, as it suggests that many subjects are trying to maximize their expected winnings; however, they were not able to do so.Footnote 15 Even with the knowledge of the expected value of their chosen portfolio and the simple lottery equivalence of a chosen portfolio, optimizing with rival outcomes remains non-trivial. The non-trivial nature of the problem is discussed in more detail in Section 5.1.
We now test whether the practice treatments influenced final selections relative to the choices made in FOUR|RIVAL. Table 8 compares several outcomes across the three practice treatments to one another and to FOUR|RIVAL using OLS and Ordered Probits. All of the practice treatments resulted in increased expected portfolio values relative to FOUR|RIVAL. Moreover, the expected value for FOUR|P+SIMPLE +BEST was the highest of all, being $0.417 higher on average, compared to a mean of $2.27 in FOUR|RIVAL, an increase of 18% and almost 40% of the lost earnings. However, being shown the value of their choices and/or being given practice led to substantial improvements (roughly a 9 % increase). The difference between FOUR|P+SIMPLE+BEST and the other practice treatments are also marginally statistically significant. No other differences between practice treatments are statistically significant.
Final selections in practice treatments VS. FOUR|RIVAL

Notes: Models 1 and 2 are OLS estimating subjects’ expected earnings and average lottery. Models 3 and 4 are Ordered Probits estimating subjects’ riskiest and safest choice. Z/T-stats based on subject clustered standard errors in parentheses. P-values for F-test of equality of treatment dummies reported. R2 is the Pseudo R2 for Models 3 and 4 (Ordered Probits).
4.3. Experiment 3
We now discuss the results from Experiment 3 which was completed by 59 subjects. Subjects on average earned a little over $8.00 plus their $0.25 participation fee. On average, subjects spent about 20 minutes on the experiment. Summary statistics for subject demographics/characteristics of interest and characteristics of chosen portfolios can be found in Table B.3. There are some minor differences regarding the demographics/characteristics of interest.
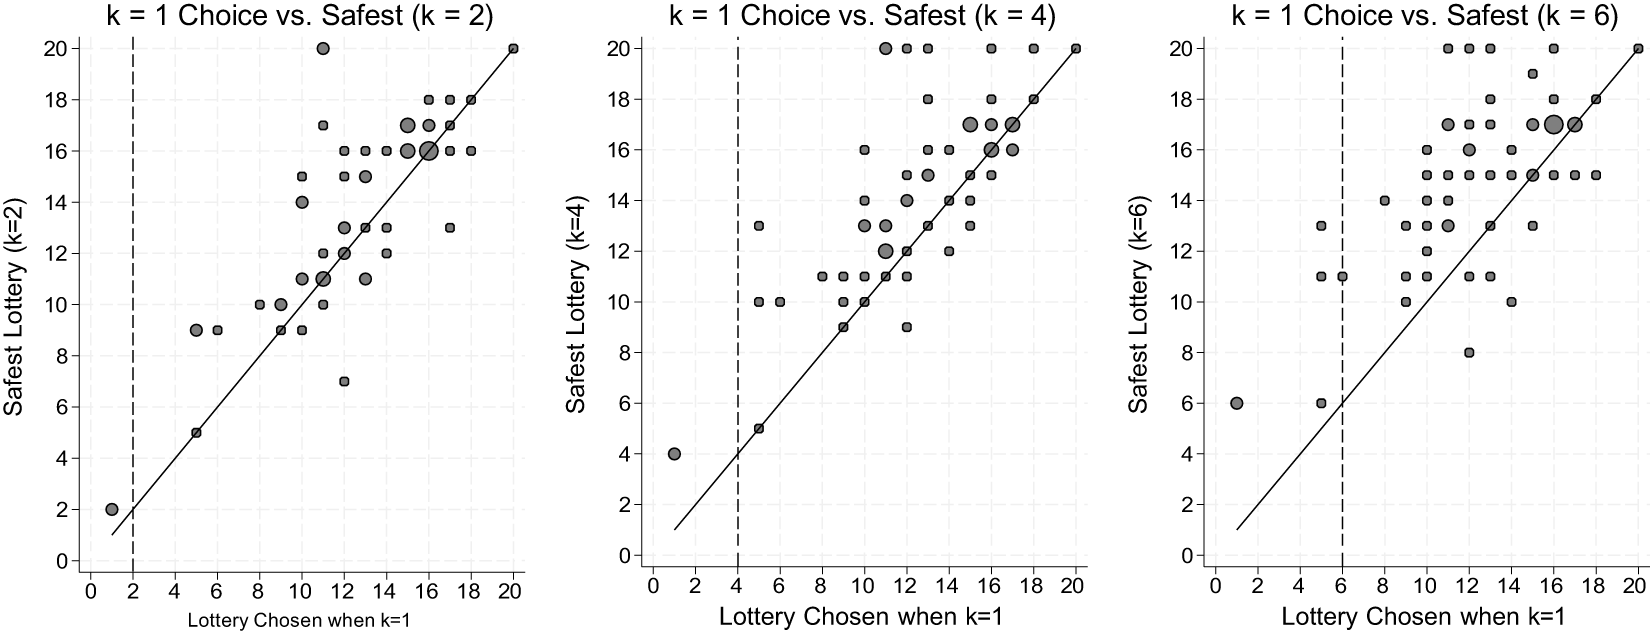
In Figure 2, we present scatter plots of the lottery subjects select when k = 1 (x-axis) vs. the safest lottery in their portfolio when k = 2, 4, and 6 (y-axis). We overlay a 45∘ line on each of these plots. Recall that under the NSST as k increases subjects should select the same lotteries as their k = 1 selection. This implies that the safest lottery in their portfolio (for  $k \geq2$) should be on the 45∘ line. Points above the line are violations of the NSST. Figure 2 shows that among unconstrained subjects 59%, 61%, and 72% make decisions inconsistent with NSST predictions when $k=$ 2, 4, and 6, respectively.Footnote 16
Lottery chosen when k = 1 versus safest lottery

In analyzing Experiment 3 we omit observations if the subject’s k = 1 choice is less than the number of choices they are given (the boundary cases discussed above). This was done to exclude individuals who mechanically had to violate the NSST.Footnote 17 Including these observations would bias us towards rejecting the NSST when it was just a limitation of our experimental design.
Result 4.
The safest lottery selected is increasing in the number of lotteries in the portfolio, k.
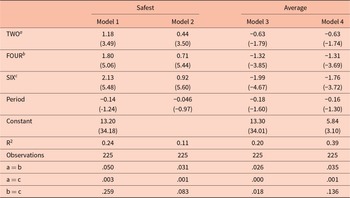
As in Experiment 1, subjects generally select a safer safe lottery as k increases. This is seen in Models 1 and 2 in Table 9, which estimates the safest choice selected relative to the choice when k = 1. Results using all subjects are found in Table B.6 of the Appendix are similar. Model 1 includes individual fixed effects, while Model 2 instead includes individual-level covariates. Both of these models show that the safest choices get significantly safer as the number of choices increases. This is in direct contradiction to the no safety schools theorem. Models 3 and 4 in Table 9 examine the average index choice for the portfolio. Here, the results suggest that the average lottery selected becomes riskier as more choices are included. The final result suggests experience on its own might move the needle some, it will not be enough to substantially improve performance. Substantial improvement likely requires at least some form of feedback in addition to experience. Nonetheless, this is a result that must be taken with a grain of salt; subjects in this treatment selected a surprisingly safe lottery when they were allowed to select only a single lottery.
Testing the no-safety school theorem

Notes: Results from Experiment 3. Models 1 and 2 estimate the safest lottery selected. Models 3 and 4 estimate the average index number of lotteries in the subjects’ portfolios. Models 1 and 3 are fixed effects models where the fixed effect is the subject. Model 2 is an Ordered Probit. Model 4 is OLS. Controls in Models 2 and 4: age, subjective risk preferences, gender, education level fixed effects, and income level fixed effects. Coefficient estimates of the controls are found in Table B.5 (Online Appendix). Z/T-stats based on subject clustered standard errors in parentheses. P values derived from F-tests of equality of coefficients presented in the final 3 rows. Obs = 225. R2 is the Pseudo R2 for Model 2 (Ordered Probit).
5. Possible explanation and policy relevance
In this section we explore a possible explanation for these findings and then discuss the policy relevance of these results.
5.1. Possible explanation
The results of all the experiments show that predictions of the no safety schools theorem are violated experimentally both across subjects and within subjects. Practice and information appear to “improve” decisions, but the resulting choices are still not completely explained. A potential explanation is that these portfolio decisions with rival outcomes are hard, or more formally, they are complex. Recently, Oprea Reference Oprea(2024) found that decisions that were more “complex” resulted in different risk preferences.Footnote 18 The paper states “when we say a lottery is ‘complex,’ we mean only that its value is not transparent to the decision-maker because the procedure required to optimally aggregate its disaggregated components into a value is costly or difficult.” If we take the portfolio decision to be a lottery, we believe that rival decisions are more complex than random ones. As a result, less sophisticated subjects might use a heuristic to help make portfolio decisions.
Past studies document the failure of individuals to account for the correlation of financial assets in portfolio allocation decisions (Eyster & Weizscker, Reference Eyster and Weizscker2011, Kallir & Sonsino, Reference Kallir and Sonsino2009) and informative signals received within a network (Chandrasekhar et al., Reference Chandrasekhar, Larreguy and Xandri2015). In these experiments, subjects treat the assets, or signals, as though they were independent. This phenomenon is known as correlation neglect. Similarly, we find that subjects in Experiment 1 make nearly equivalent decisions regardless of whether the outcomes are independent or dependent. Our subjects exhibit patterns that are similar to correlation neglect as they act as if they are ignoring the fact that the payoff depends on the outcomes of all the lotteries in their portfolio when the lotteries are rival. We refer to this as “dependence neglect”. While a formal theory of dependence neglect is beyond the scope of this paper, we think it might explain the observed choices.
The flowchart found in Figure 3 describes an algorithmic way at looking at the problem subjects are asked to solve in the experiments. Specifically, the figure begins with splitting the decisions into ones with rival payoffs and ones with random payoffs. Under Random payoffs, subjects need to follow a fairly simple algorithm which simplifies to selecting the k lotteries with the highest expected utility for the agents. However, when the payoffs are Rival the next step in the algorithm depends on the agent’s type. Consider two types of agents, Sophisticated and Simple. The Sophisticated agents do not exhibit dependence neglect and will follow the greedy algorithm described by Chade and Smith Reference Chade and Smith(2006). Note that this algorithm involves both additional steps, compared to the Random algorithm, and conditional arguments in those steps. Thus, the ‘greedy’ algorithm is more complex. The Simple agents, in contrast, exhibit Dependence Neglect, and choose to rely on the algorithm that maximizes utility under Random payoffs, despite the payoffs being rival.
Type specific algorithm for selecting portfolio

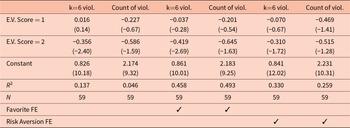
To support this potential explanation, we present evidence both that more ‘sophisticated’ subjects make fewer errors, and that the greedy algorithm seems difficult to ‘learn’. To quantify sophistication we rely on two survey questions, shown in Appendix B.1. Two questions ask subjects to calculate expected values. We create a variable  $E.V.$ Score equal to the number of correct answers to those questions. Using Experiment 3, where we can identify individual subjects who make NSST violations, we regress binary indicators of those violations on fixed effects for $E.V.$ Score. We additionally include either fixed effects for the subject's “favorite lottery” which is an indicator of risk preferences, or fixed effects from the explicitly stated risk aversion survey question. We consider two measures of NSST violations. The first is whether the subject’s safest lottery in k = 6 was safer than their choice when k = 1. These violations appear as dots above the 45-degree line in the rightmost panel of Figure 2. The second is a count of how many NSST violations a subject makes across k = 2, k = 4, and k = 6.
The results of these regressions are found in Table 10. The first thing to notice is that all but one coefficient is negative, suggesting that those who answered the E.V. corrections correctly, were on average less likely to violate the no safety schools theorem. Additionally, the coefficients for  $E.V.$ Score = 2 are often much more negative than for $E.V.$ Score = 1, suggesting that the more ‘sophisticated’ agents are even less likely to violate the NSST. The $E.V.$ Score = 2 coefficient is statistically significant at the 5% level for the k = 6 violations outcome without additional fixed effects, and at the 1% level with favorite lottery fixed effects but only at the 10% with risk aversion fixed effects. The coefficients for the count of NSST violations are not statistically significant at conventional levels. Taken together, this evidence is suggestive of individuals with a better understanding of expected values being less likely to violate the no safety schools theorem.
Effect of score on violation measures (k = 6)
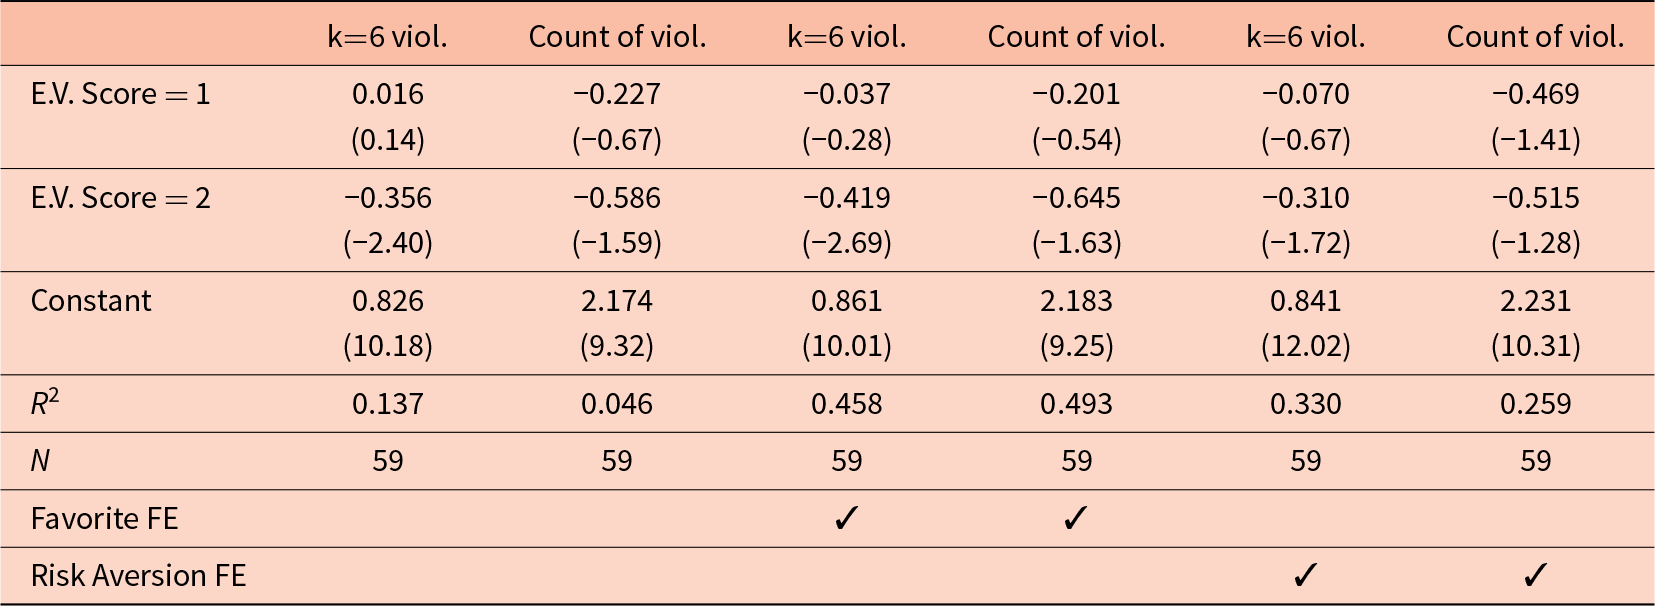
Note: Each column presents a separate regression of the violation outcome on EV scores. T-statistics based on robust standard errors are shown in parentheses. Favorite lottery fixed effects and risk aversion fixed effects included where indicated. Constant terms included but not shown.
To show that the greedy algorithm is complex, or just difficult to learn, we turn to Experiment 2, which has repeated choices per subject with fixed k and Rival payoffs. Recall, from Figure 1, that the optimal bundles look quite different under Rival or Random payoffs. The optimal Random bundles are comprised of k adjacent lotteries. Conversely, the Random bundles are not adjacent. Chade and Smith Reference Chade and Smith(2006) refer to these types of bundles as being upwardly diverse. These patterns hold across different levels of risk aversion. These patterns allow us to implicitly test whether a subject is relying on the dependence neglect heuristic or not. Note that the Experiment 2 regression results in Section 4 examine summary statistics about the portfolios, rather than the strategy directly.
To do this, we create the variable  $\text{Four in a Row}$ which is equal to 1 when all four choices are adjacent lotteries and one otherwise. We then regress this variable on Period indicators, with the first period as the omitted group. We estimate standard errors clustered at the subject level. We estimate these regressions separately for the three informational treatments. These regressions allow us to determine whether reliance on the heuristic changed over the periods, and whether the type of information matters.
These results can be found in Table 11. The first thing to note is how large the constants are. This suggests that 37% of subjects chose adjacent lotteries in the Practice+EV treatment, 56% in the Practice+Best treatment, and 65% in the Practice treatment. The next thing to note is that all but one of the coefficients is positive. The positive coefficients indicate that subjects in those rounds were more likely to choose adjacent lotteries than in the first round. Note that the majority of these coefficients are not statistically significant, the exceptions being Period 2 for Practice+EV and Practice+Best. The most notable coefficient is the Period 4 coefficient for Practice+Best which is -0.244. Not only is this the only negative coefficient, it is significant at the 1% level. These results suggest two things. The first is that the algorithm is quite hard to learn, as it takes individuals being told the expected value maximizing portfolio to actually pick a bundle that is less likely to contain adjacent lotteries. Recall, the information on the ‘best’ lottery is only presented before the final round in this treatment. In contrast, after four rounds individuals who were only allowed to practice, with or without the expected value information, were more likely to choose adjacent lotteries. The second is that the improvements from practice seen in Section 4 are driven in large part from subjects picking adjacent bundles that are riskier, rather than from picking non-adjacent bundles.
Four in a row by treatment and period
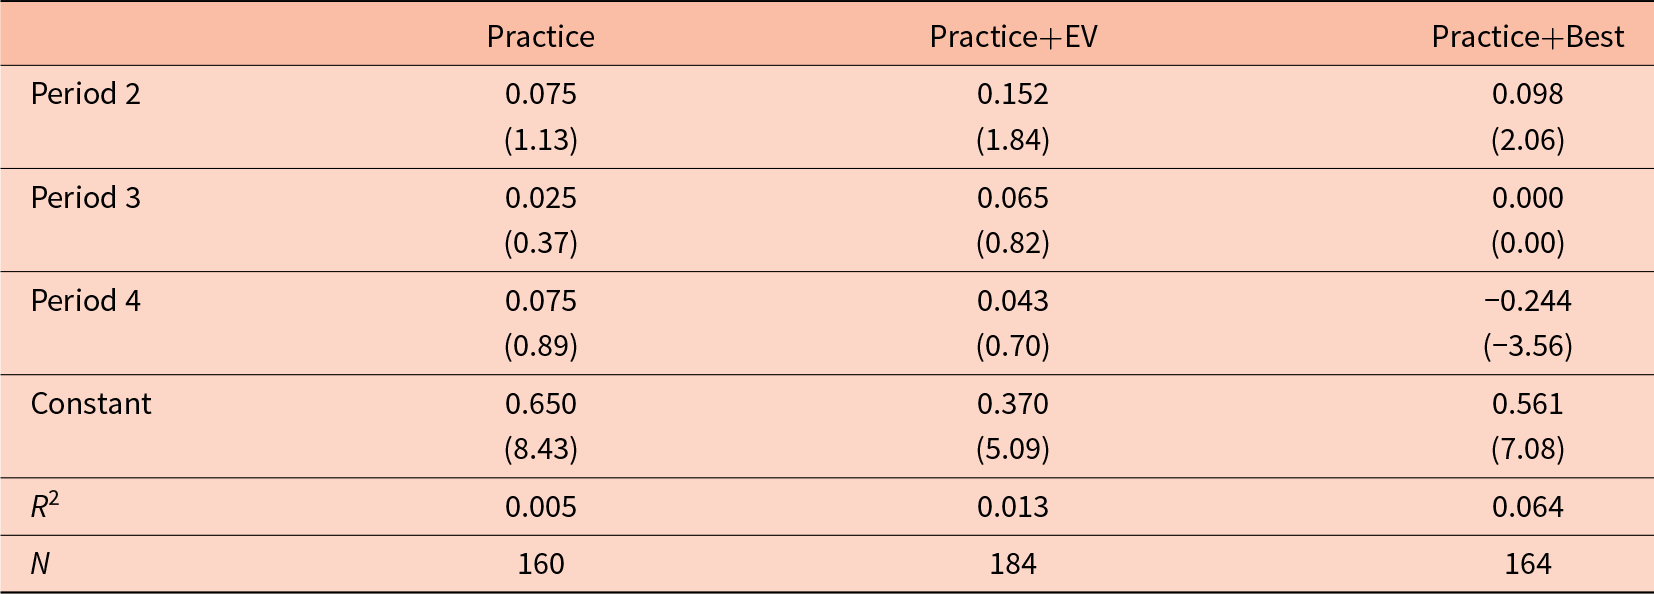
Note: Each column presents estimates from a separate regression of “four in a row” behavior on period indicators for each treatment arm. T-statistics based on standard errors clustered at the worker level are shown in parentheses. Constant terms included but not shown.
5.2. Policy and research relevance
These findings are relevant both for researchers and policymakers. In particular, resolving the problem of under-matching, when high-ability students attend colleges with low-ability peers, becomes more difficult. Organizations such as the College Board have attempted to remedy this problem by providing free applications to low-income students. Interestingly, Manjunath and Morrill Reference Manjunath and Morrill2023 show that when one side in a simultaneous search setting has more choices that side is worse off on average if the other side does not expand its portfolio size as well. One could construct a structural model to estimate the impact of such a program. One might do so assuming that individuals maximize expected utility as in Chade et al. Reference Chade, Lewis and Smith2013 and Fu Reference Chao(2014). The estimated policy impacts of increasing the number of applications from one to three for treated individuals would be large. The NSST implies that the two ‘additional’ applications would be sent to riskier schools which would increase the probability of a better match for all students. However, given our findings, students would likely send applications to riskier and safer schools. This would mean that the model’s predicted increase in match quality would be significantly overstated. Similarly, algorithms to infer the latent preference distribution over colleges when the number of choices is restricted, such as Hernandez-Chanto Reference Hernandez-Chanto(2021) rely on the No Safety Schools Theorem to estimate the unobserved choices. If many students are not in fact following the NSST then the counterfactual distribution would be biased towards riskier choices.
Our results suggest programs offering advice along with additional choices would be much more beneficial than a program with additional choices but without advice. The quality of schools attended by low-income students may be better improved by “expert advice” type interventions (c.f., Hoxby & Avery, Reference Hoxby and Avery2013, Carrell & Sacerdote, Reference Carrell and Sacerdote2017) which encourage students to apply to more “stretch” schools. This policy prescription is consistent with recent empirical studies. For example, Hoxby and Avery Reference Hoxby and Avery(2013) finds that expert advice leads to students applying to more selective universities and therefore increases their likelihood of attending more selective schools
Our findings may also be informative for the school choice literature, which is usually concerned with lower levels of education. Often this literature involves specific allocation mechanisms and a centralized application system. Previous research has found an interesting relationship with risk aversion and the number of choices. Hernandez-Chanto Reference Hernandez-Chanto(2020) shows that when risk aversion is high, students play safe strategies. This is confirmed by our computational results. However, the specific mechanism can matter as Klijn et al. Reference Klijn, Pais and Vorsatz(2013) shows that risk aversion results in safer strategies under a Gale-Shapley Mechanism than under the Boston Mechanism. Calsamiglia et al. Reference Calsamiglia, Haeringer and Klijn(2010) experimentally tests the implications of restricting the number of choices for schools under popular school assignment algorithms. It shows that restricting choices can lead to truth-telling no longer being dominant, and safety schools being chosen with excessive caution. Clearly, accommodating deviations from the no safety schools theorem into already technical school assignment mechanisms will be quite challenging.
6. Conclusion
We have shown that subjects routinely violate the no safety schools theorem. In both our within-subject and our between-subjects experiments individuals make decisions that are inconsistent with the no safety schools theorem. In the within-subjects design experiment, for the majority of individuals, the safest selection in a portfolio becomes safer as the portfolio size increases.
In the between-subjects experiments, the safest choice in the portfolio becomes safer on average as portfolio size increases. This is consistent with the findings of Pallais Reference Pallais(2015) which analyzes the effect of an exogenous increase in the number of ACT score reports a student can send to colleges after completing the ACT. She finds that “when students sent more score reports, they sent scores to a wider range of colleges: that is, those that were both more- and less-selective than any they would have sent scores to otherwise.”Pallais (Reference Pallais2015, p. 503) However, in the natural experiment Pallais analyzed the probabilities across schools are correlated and student’s private valuations would be unknown. Our experiments have known payoffs and uncorrelated probabilities which allow for a cleaner test of the no safety schools theorem.
Our between-subjects experiment also allows us to compare selections made when the payoff is rival versus when it is random. In making these comparisons, we see that the selected portfolios are quite similar, holding portfolio size fixed. Notably, in contrast to the theoretical predictions, the safest lottery chosen under rival payoffs is not riskier than the safest lottery chosen under random payoffs. This suggests that individuals fail to understand the rival nature of the payoffs, or exhibit dependence neglect. Why this misunderstanding occurs is left for further study, however Experiment 2 illustrates that outcomes can be improved with practice, feedback, and/or advice. An open question is the marginal benefit of each of these mechanisms.
Supplementary material
The supplementary material for this article can be found at https://doi.org/10.1017/esa.2025.10018.
Acknowledgements
We thank Nikolai Cook, Chris Cotton, Yoram Halevy, Anthony Hayes, Julian Hsu, Steven Kivinen, Steve Lehrer, Rob Oxoby, John Ryan, Tim Salmon, Ran Shorrer, Lones Smith, Derek Stacey, Radovan Vadovič, Marie-Louise Vierø , Ryan Webb, Sevgi Yuksel, and Lanny Zrill for helpful discussions and suggestions. All mistakes are our own. Much of this research was done at the University of Calgary and we are grateful for our time spent there. We are also thankful for helpful comments from audience members at several conferences and seminars and to past referees. Webb’s research was supported, in part, by a grant from the Social Sciences and Humanities Research Council. Grant Number: 430-2014-00712. A previous version of this paper circulated as “Decision Making with Risky, Rival Outcomes: Theory and Evidence”. Declarations of interest: none.
Conflict of interest
The authors have NO affiliations with or involvement in any organization or entity with any financial interest (such as honoraria; educational grants; participation in speakers’ bureaus; membership, employment, consultancies, stock ownership, or other equity interest; and expert testimony or patent-licensing arrangements), or non-financial interest (such as personal or professional relationships, affiliations, knowledge or beliefs) in the subject matter or materials discussed in this manuscript. Human subjects approval was obtained at the University of Calgary and the University of Central Missouri.





 Open access

