

Introduction
Layers in a snowpack are differentiated by their morphological and physical properties, both of which depend on snow microstructure. The stratigraphy, and thus the differences in microstructure, also determine the mechanical behaviour of a snowpack. Studying layering at the micro-structural scale (10−2–10 –4 m) is essential to find micro-structure-based parameters that reveal layers relevant to mechanics (e.g. Reference KryKry, 1975).
Snow is constantly deforming due to its high homologous temperature, and the deformation behaviour is highly strain-rate dependent (Reference NaritaNarita, 1980; Reference ScapozzaScapozza, 2004). Creep compacts the snow permanently, but does not lead to its failure. In contrast, fast deformation induces high strain rates (> 10−2 s−1), whereby snow deforms mainly elastically and can fracture and fail in a brittle way. Weak layers consist of snow structures that are more prone to brittle fracture and failure than others. If buried under a bonded slab, an evolving and propagating crack therein can lead to partial or entire failure of a snowpack. The formation of dry-snow slab avalanches is mainly a brittle process, caused by the failure of a weak layer (Reference Schweizer, Jamieson and SchneebeliSchweizer and others, 2003). The identification of potential weak layers is a key element in assessing the stability of a snowpack. To distinguish weak layers from non-weak layers, microstructural differences act as an indicator (e.g. Reference Schweizer and WiesingerSchweizer and Wiesinger, 2001). Moreover, in many cases, the detection of weak layers requires mechanical stability tests, whereby several weak layers can be found. Their identification and characterization by these field tests can be difficult for manifold reasons. First, the most important drawback is the limited spatial resolution of a traditional snow profile. Second, weak layers are often very thin, making it difficult to precisely localize the failure in the snow profile. Third, structural and mechanical properties are hard to quantify for layers <1 cm thick. For these reasons weak layer properties are seldom quantified or quantifiable by hand measurements in the field.
Highly resolved measurements of the mechanical penetration resistance (e.g. with the SnowMicroPen (SMP); Reference Schneebeli, Pielmeier and JohnsonSchneebeli and others, 1999) enable us to overcome the limited resolution of hand measurements. Although the force/signal interpretation is not clear (Reference Johnson and SchneebeliJohnson and Schneebeli, 1999; Reference Marshall and JohnsonMarshall and Johnson, 2009; Reference Löwe and Van HerwijnenLöwe and Van Herwijnen, 2012), microstructural parameters can be deduced with high resolution. The SMP was recently used to quantify relative differences between layers (Reference Lutz, Birkeland and MarshallLutz and others, 2009; Reference Van Herwijnen, Bellaire and SchweizerVan Herwijnen and others, 2009) and to detect weak layers by signal analysis (Reference Pielmeier and SchweizerPielmeier and Schweizer, 2007; Reference Bellaire, Pielmeier, Schneebeli and SchweizerBellaire and others, 2009; Van Reference Van Herwijnen, Bellaire and SchweizerHerwijnen and others, 2009). However, uncertainty remains in the signal interpretation with respect to weak layers. One key factor is that the microstructure of weak layers is poorly known.
Microstructural layering was also studied in this context, by imaging cast snow structures with surface sections. Reference Kronholm, Schneebeli and SchweizerKronholm and others (2004) and Reference Pielmeier and SchweizerPielmeier and Schweizer (2007) compared them qualitatively with SMP measurements. Reference Föhn, Camponovo and KrüsiFöhn and others (1998) used this method to quantify the microstructure of an embedded weak layer and to relate it to measured shear strength. They concluded that stereo-logical measurements cannot differentiate the weak layers from the adjacent layers well enough to find such a relation. They suggested that three-dimensional (3-D) reconstructions are necessary to describe a mechanically relevant change in microstructure by microstructural parameters alone. In the context of investigating weak layer properties, this has not yet been done.
The two elastic constants, Young’s modulus E and Poisson’s ratio ν, are characteristic material properties of snow and are required in many applications, for example in fracture mechanical models of slab avalanche release (Reference McClungMcClung, 1981; Reference Heierli, Gumbsch and ZaiserHeierli and others, 2008), but they are difficult to obtain experimentally. The mechanical testing of fragile snow types is very challenging, even in a well-controlled laboratory environment. Studies attempting a correlation between E, ν and microstructure were thus often limited to less fragile and often dense snow. Until now most correlations have been based on density, as high-resolution microstructural measurements are not available. To apply such correlations, a reliable density measurement is required, i.e. sufficiently resolved to ensure the sample or layer homogeneity. This requirement often hinders the use of density-based correlations for most of the weak layers: if very thin, density cannot easily be measured by hand. Furthermore, most snow types show anisotropic physical behaviour to a certain degree (Reference Löwe, Riche and SchneebeliLöwe and others, 2013), i.e. from isotropic to transverse isotropic in the horizontal plane (Reference Srivastava, Mahajan, Satyawali and KumarSrivastava and others, 2010), and hence have different Young’s moduli depending on the direction. The elasticity tensor Cijkl relating stress and strain is required for a complete characterization of snow in terms of elasticity and to calculate the Young’s moduli in each direction, but Cijkl of a given snow sample cannot be measured experimentally; a snow sample can only be tested once, since most mechanical tests are destructive. Consequently, experimentally determined Young’s moduli are mostly measured in the vertical direction and assume an isotropic material.
Numerical experiments, in contrast, allow us to calculate the full elasticity tensor based on real non-idealized 3-D snow structure. X-ray microcomputer tomography (μ-CT; Reference Coléou, Lesaffre, Brzoska, Ludwig and BollerColéou and others, 2001; Reference Schneebeli and BrebbiaSchneebeli, 2002) measures objective and highly resolved snow microstructure, which can be used as geometric input. This method was used for elastic simulations to study stress distribution (Reference Pieritz, Brzoska, Flin, Lesaffre and ColéouPieritz and others, 2004), to study the evolution of elastic properties during temperature-gradient metamorphism experiments (Reference SchneebeliSchneebeli, 2004; Reference Srivastava, Mahajan, Satyawali and KumarSrivastava and others, 2010) and for viscoelastic simulations to study creep (Reference Theile, Löwe, Theile and SchneebeliTheile and others, 2011).
In this study we investigate snow stratigraphy based on μ-CT measurements to quantify the microstructural change. We cast natural layered snow samples in the field with a focus on embedded weak layers. Our 32 samples cover a wide range of snow types and densities from 100 to 500 kg m−3. The microstructure of these centimetre-sized samples was reconstructed using μ-CT, as described by Reference HeggliHeggli and others (2011). The 3-D data constituted the geometric input for elastic finite-element (FE) simulations (Reference Van Rietbergen, Weinans, Huiskes and OdgaardVan Rietbergen and others, 1995). The calculated elastic constants, Young’s modulus and Poisson’s ratio were used together with microstructural information to identify layers and quantify their structural differences. We also found a logarithmic correlation for the Young’s modulus with density, based on our FE simulations. Weak layers were identified using mechanical field tests, and the corresponding layers in the μ-CT data were determined, in order to elucidate the differences between weak layers and non-weak layers. We found that the relative microstructural changes between a weak layer and the adjacent layers are up to ten times larger than between adjacent layers in general. The magnitude of relative change between layers is an indicator of a potential weak layer, but only if both the layer above and the layer below are considered.
Methods
Data acquisition of layered snow
During winter 2008/09 and 2009/10 seasonal snow, primarily weak layers and their adjacent layers, was sampled in the field near Davos, Switzerland. Winter 2008/09 had average conditions regarding snowfall events and snow-cover stability. Winter 2009/10 had temperatures and snow heights below the long-term mean and was characterized by mostly unstable snowpack conditions. Samples were taken at altitudes in the range 1600–2600 m a.s.l., on slopes of all aspects and angles between 0 and 45 ͦ. The weak layers were determined by hand profiles and stability tests using extended compression and rutschblock tests, as described by Reference Winkler and SchweizerWinkler and Schweizer (2009). Samples of 5 cm × 5 cm × 7 cm were cut parallel to the layering. For safe transport from the field to the cold laboratory, each sample was carefully cast by replacing the air in the sampled snow with dyed diethyl-phthalate and then freezing it with dry ice. In the cold laboratory, the cast samples were processed and scanned nondestructively with an X-ray microcomputer tomograph (SCANCO Medical AG, μ-CT40) with a nominal resolution of 10 μm voxel size. As described by Reference HeggliHeggli and others (2011), each sample was scanned before and after ice sublimation, necessary for a μ-CT analysis of cast snow to detect air bubbles enclosed during the casting process. The inverse of the segmented air matrix gives the ice matrix, and the original snow microstructure was then reconstructed by additional image processing. (More details are given by Reference HeggliHeggli and others, 2011.) The 32 digitized layered samples used in this study had a sample height of 4.5–7.0 cm and a side length of up to 1.5 cm.
Microstructure-based identification of layers in μ-CT samples
Microstructural layering was analysed by calculating the vertical variation in geometry. The following parameters were calculated within overlapping horizontal slices of 2 mm thickness over the entire sample height from the 3-D data: density (ρ), specific surface area (SSA), the number of ice structures per millimetre (trabecular number, Tb.N), ice thickness (Th), pore thickness (Sp) and the connectivity density (Conn.D). Snow density was obtained by calculating the ice volume fraction, ɸ ice, by counting voxels and multiplying ɸ ice by the density of ice, ρ ice = 917 kg m−3. With the triangulation of the ice surface, the ice surface area was calculated and then divided by the ice volume to obtain the SSA. Tb.N, Th and Sp were computed by the method based on the inscription of spheres (Reference Hildebrand and RüeseggerHildebrand and Rüesegger, 1997). Conn.D was calculated as described by Reference Odgaard and GundersenOdgaard and Gundersen (1993). Based on the resulting vertical distribution of these parameters and an examination of the reconstructed sample by eye, individual layers were designated. Cubic subvolumes were cut from these layers, as shown in Figure 1. These subvolumes were finally used to numerically calculate elastic properties. The snow within these layers was morphologically classified according to the scheme of Reference FierzFierz and others (2009).
Three-dimensional reconstruction from μ-CT measurements of a natural, layered snow sample. (a) Low-density cups forming a weak layer (in the middle of the sample) below a thin melt/freeze crust, both buried under small rounded grains (sample name WG3; volume 8.9 mm × 8.9 mm × 68 mm; resolution 0.01 mm). (b) Cubic subvolumes cut from (a) for FE calculations with side length 8.91 mm (resolution 0.03 mm). (c) Vertical cross sections in the x –z plane of 1.5 mm horizontal thickness.

When two snow types were present in equal amounts (e.g. faceted crystals (FC) and rounded grains (RG)), the snow in this layer was classified as a mixture (e.g. FC/RG). An additional designation of layers in the μ-CT sample (weak layer, layer above the weak layer, and layer below the weak layer) was made according to observations in the field. Allocating field observations to the highly resolved 3-D data was often difficult, and in ambiguous cases the layers were not classified as layer above, weak layer or layer below.
Finite-element calculations
A voxel-based FE code (Reference Van Rietbergen, Weinans, Huiskes and OdgaardVan Rietbergen and others, 1995, 1996) was used to calculate E and ν. For each of the 104 cubic subvolumes, one linear-elastic FE calculation simulating uniaxial strain in the vertical direction was made with displacement boundary conditions. Nodes located at the bottom, z min, had zero displacement, and nodes on the top, z max, had a prescribed vertical displacement corresponding to unit strain. Nodal displacement at lateral surfaces was restricted to the z –direction. The geometry of the snow structure was implemented by a voxel-to-element conversion of the segmented subvolume, such that, once unconnected ice structures had been removed, each ice voxel was converted into an eight-node brick element. Air voxels were not considered in the simulation. All elements were homogeneous, isotropic, of the same size, shape and orientation, and were assigned to the corresponding material property of ice. For ice, isotropic, linear-elastic behaviour was assumed, with E = 10 GPa and ν = 0.3 (Reference PetrovicPetrovic, 2003).
Representative volume element
The minimum size required to capture the representative bulk property with respect to E was determined by calculating E of cubic subvolumes of increasing size within a given volume. A variation of E of less than ±20% determined the size of the representative volume element (RVE). The size of such a RVE was determined exemplarily for three different snow types: rounded snow (RG), faceted snow (FC) and depth hoar (DH), all with densities <300 kg m-3. We assume that the snow in our given volume can be considered structurally isotropic. Nevertheless, to account for possible structural variability, the RVE calculations were started from four different corners and the cube side length was increased stepwise in all three directions until the entire volume was filled. To reduce computational time, the resolution of the 3-D data was reduced by a factor of three or four (for snow of large grain size), maintaining porosity and specific surface area.
Calculation of Young’s modulus and Poisson’s ratio
Assuming a linear-elastic and homogeneous material, the relation between stress, σ, and strain, ε, is given by the generalized Hooke’s law
written in index notation, where σij and εkl are second-order tensors and Cijkl is a fourth-order tensor and referred to as the elasticity tensor. If the material is considered to be isotropic, Hooke’s law can be expressed in terms of E and ν as
where δij is the Kronecker delta. The idealized case of uniaxial strain, where strain is applied only in one direction (e.g. vertical) and where the lateral strains are suppressed, i.e. εxx = εyy = 0, implies that

which can be rearranged to calculate Poisson’s ratio as
where ν(σxx) is equal to ν(σyy) if the material can be considered as isotropic and homogeneous. The constrained modulus M

can be used to calculate E when σzz, σzz and ν are known. The size of the RVE, and hence the size of the calculated subvolumes, was chosen according to E. However, a RVE for E is not necessarily large enough to also hold the assumption of structural homogeneity for ν. The structural variability in the horizontal plane (x –y plane) affects more than E, and the volume size meeting the RVE criteria for E does not necessarily meet the RVE criteria for ν. Therefore, the resultant apparent stresses, σxx and σyy (for some snow samples these were not equal), were used to calculate two Poisson’s ratios using Eqn (4):
and
Consequently two Young’s moduli were calculated using Eqn (5): E(ν(σxx) and E(ν(σyy) For layer analysis an averaged Young’s modulus
and an averaged Poisson’s ratio
were used. For the sake of simplicity Ē and ![]() are denoted as E and ν hereafter. When the difference between σ
xx
and σ
yy
exceeded 50%, the assumption of structural homogeneity was considered unacceptable, so E and ν of these samples were excluded from further analysis.
are denoted as E and ν hereafter. When the difference between σ
xx
and σ
yy
exceeded 50%, the assumption of structural homogeneity was considered unacceptable, so E and ν of these samples were excluded from further analysis.
Relative change in microstructure between layers
First, the subvolumes of all layers were used to calculate the relative change between geometric parameters and E and ν between adjacent layers. The relative per cent change Δ of a parameter x between two layers was calculated as
where the value of the overlying layer was the reference value x ref. If the value x of the value x ref. If the value x of the underlying layer exceeds x ref, the relative change is positive, otherwise it is negative.
Second, the difference between weak layers and their adjacent layers, i.e. layer above and below, was examined. Relative changes were calculated according to Eqn (10), but always with the weak layer as the reference layer (x ref = x WL, where WL is weak layer).
Results
Snow characterization
Twenty-two of the 32 cast layered samples contained an embedded weak layer. A sample consisting of a depth hoar layer lying under a thin melt/freeze crust, both buried under rounded snow, is shown as an example in Figure 1. Morphologically, the high resolution of 10 μm revealed the presence of very thin layers with a vertical thickness <2 mm, which were not observable in the field. Very thin layers were also revealed by strong changes in the calculated parameters. These were sometimes not even morphologically visible in the 3-D visualization. The densities in the layers were 100–500 kgm−3, the SSAs 4–44m−1 and the size of pores 0.17–0.94 mm. The values of layers chosen for FE calculations (104 layers from 32 samples) are listed in the supplementary material at http://www.igsoc.org/hyperlink/13j220suppl.pdf.
RVE for Young’s modulus
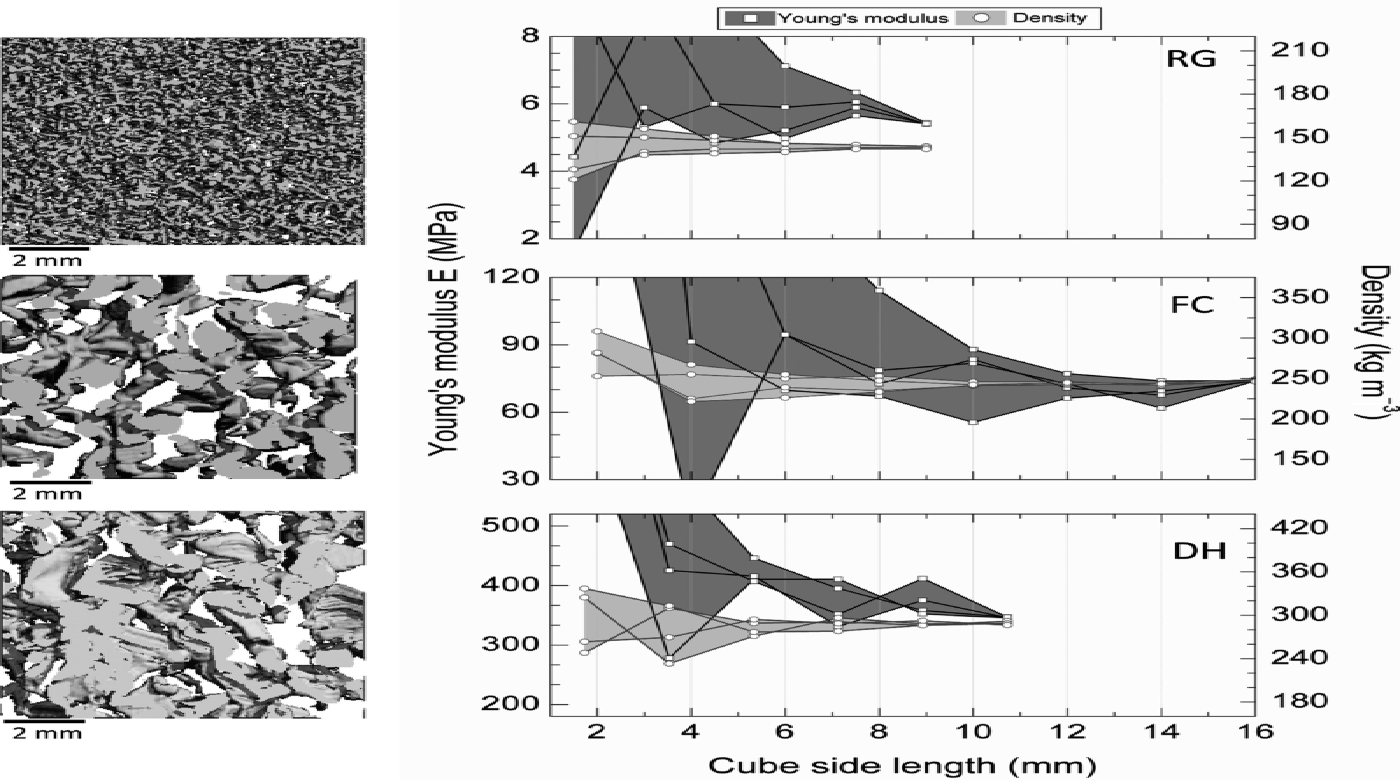
The RVE for a FE calculation of E based on tomography data was determined to be at least (7 mm)3. Figure 2 shows the RVE results for three low-density samples (ρ≤300 kgm−3): RG (volume: 3003 voxel, (9 mm)3, resolution 0.030 mm), FC (volume: 3503 voxel, (14 mm)3, resolution 0.040 mm) and DH (volume: 2983 voxel, (10.7 mm)3, resolution 0.036 mm). Resolution was lower for snow with large structures to calculate a sufficiently large volume with a reasonable computing time. The RVE with a threshold of 20% variability was ~(1.5mm)3 for density, but ~(6.5mm)3 for the Young’s modulus. The actual size of the RVE for E depends in a rather complex way on snow type and density: the larger the grain size and the lower the density, the larger the RVE. The 104 cubic subvolumes cut out of the individual layers as shown in Figure 1, which were finally used as geometric input for the FE calculations, had a side length of 7–9 mm, a resolution of 0.03–0.04mm and consisted of up to 106 elements.
RVE calculations for Young’s modulus E (left y –axis, dark-grey area) and density (right y –axis, light-grey area) vs cube side length. The RVE results for three samples are shown: rounded snow (RG, top), faceted snow (FC, middle) and depth hoar (DH, bottom). Each cube was calculated four times, starting from different corners to account for structural variability. The μ-CT images on the left show a cut-out of 9 mm × 9 mm × 1.8 mm (resolution 0.03 mm). A calculation of the Young’s modulus requires a much larger RVE than a density calculation. In general, the larger the grain size and the lower the density, the larger the RVE.
Young’s modulus and Poisson’s ratio
The logarithmically transformed Young’s modulus E correlates well with density (Fig. 3). The range of E is 0.3–1000MPa for densities 100–500 kgm−3. The fit with an exponential equation for densities ρ of 150–250 kgm−3 is
and for densities 250–450 kg m−3 the fit is
Simulated Young’s modulus E vs density ρ from this study compared with previous published data. Our own data were fitted once for low densities (100 ≤ ρ ≤ 250 kg m−3; curve a) and once for densities 250–500 kg m−3 (curve b). Previously published data from FE simulations (Reference SchneebeliSchneebeli, 2004, curve c; Reference Srivastava, Mahajan, Satyawali and KumarSrivastava and others, 2010, curve d) are similar in magnitude. In contrast, experimental results from laboratory measurements show lower values (Reference Sigrist, Schweizer, Schindler and DualSigrist and others, 2006: curve e; Reference ScapozzaScapozza, 2004:, curve f; von Moos, as published by Reference Stoffel and BarteltStoffel and Bartelt, 2003: curve g; Reference Shapiro, Johnson, Sturm and BlaisdellShapiro and others, 1997: curve h). The symbols indicate grain shape according to Reference FierzFierz and others (2009).

Our results showed no obvious grouping depending on snow type, except for melt forms (the results of E and ν for all subvolumes are listed in the supplementary material at http://www.igsoc.org/hyperlink/13j220suppl.pdf).
Poisson’s ratio ν, in contrast, shows no clear correlation with density (Fig. 4). However, snow types are rather clearly grouped. RG shows an almost constant Poisson’s ratio over the whole density range (mean ν RG (n = 17) 0.171; standard deviation ± 0.026). In contrast, the Poisson’s ratios of FC and DH were <0.15 and more scattered (mean ν FC (n = 19) 0.130 ± 0.040; mean ν FC/ DH (n = 6) 0.096 ± 0.027; mean ν DH (n = 6) 0.087 ± 0.063).
Poisson’s ratio ν vs density.

Relative microstructural change between layers
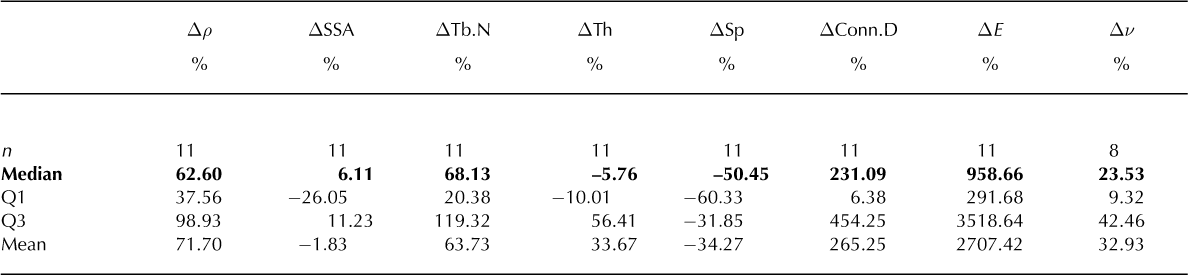
The boundary between layers is defined by a distinct gradient in properties. The magnitude of this gradient can indicate a potential weak layer if both layers adjacent to the weak layer are considered. First the layers were not classified as weak or non-weak. Table 1 shows the results for 42 pairs. We found that the layer below was denser, showed reduced SSA, had fewer and thicker ice structures per millimetre, larger pores and, consequently, fewer structural connections. The upper and lower quartile of the median are not uniquely on one side of the median, so these observations are of more general trends. Large scatter is the rule for the layer-to-layer variability.
Relative change between layers, only non-disregarded data. Parameters are: ρ: density; SSA: specific surface area; Tb.N: trabecular number; Th: ice thickness; Sp: pore thickness; Conn.D: connectivity density; E: Young’s modulus; ν: Poisson’s ratio. n is the number of pairs, and Q1 and Q3 are the first and the third quartile, respectively

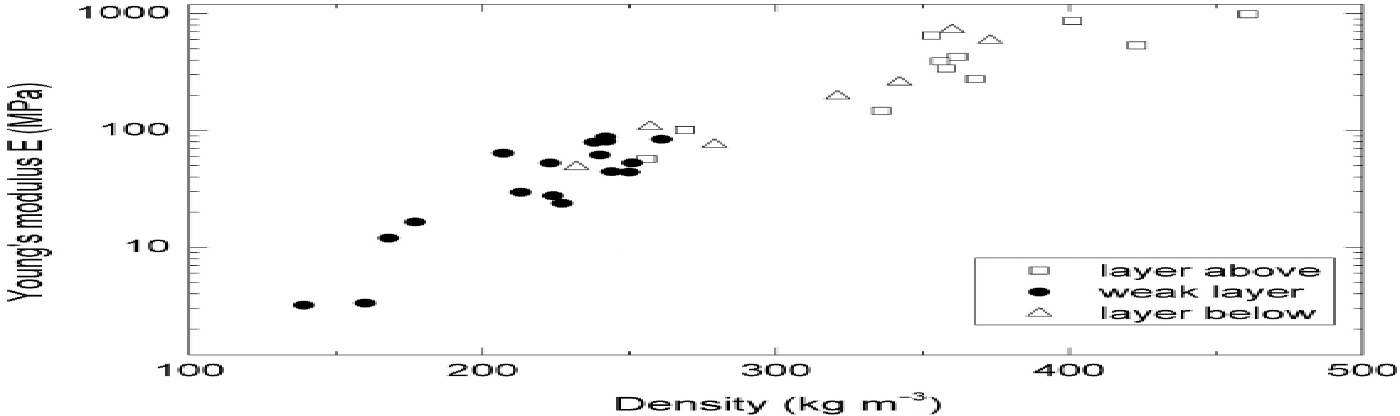
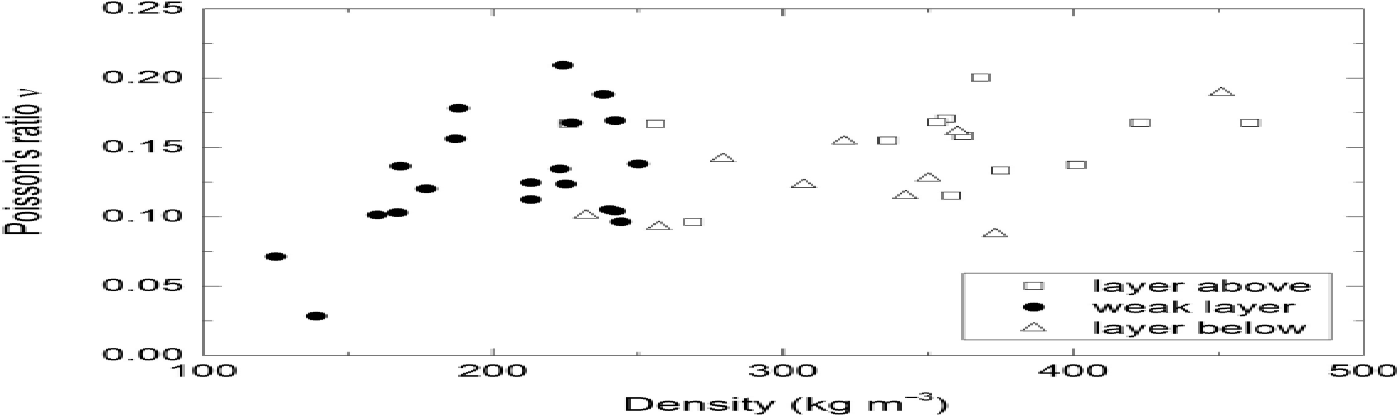
Second, the relative change from the perspective of the weak layer was calculated. All properties were therefore calculated with reference to the weak layer (Tables 2 and 3). We found that the weak layer and the two adjacent layers are sandwich-like: the layer above and layer below were, for most properties, closer to each other than to the weak layer. The most obvious difference was observed for density and elastic modulus. The weak layer was, on average, about half as dense as the layers above and below. Similarly, the elastic modulus was much higher (on average 20 times) in the layers above and below (Fig. 5). SSA was larger in the layer above compared with the weak layer and smaller in the layer below. Ice thickness (Th) was inverse to SSA. The change in the number of ice structures (Tb.N) was positive for both the layers above and below, and consequently the pore size (Sp) for both was negative. The change in was positive for the layer above, and negative for the layer below, with ν for weak layers not necessarily lower than for the layers above and below (Fig. 6).
Relative change between the weak layer and the layer above. Parameters are the same as in Table 1
Relative change between the weak layer and the layer below. Parameters are the same as in Table 1

Young’s modulus E vs density for subsamples within weak layers (n = 17), the layer above the weak layer (n = 11) and the layer below the weak layer (n = 7). If E is considered as a measure of stiffness, the weak layer is much less stiff than its adjacent layers.
Poisson’s ratio ν vs density for subsamples within weak layers (n = 20), the layer above the weak layer (n = 13) and the layer below the weak layer (n = 10).
Discussion
Three-dimensional data for snow obtained by X-ray measurements and image processing make it possible to measure the snow microstructure objectively and to perform geometry-based numerical simulations. We used these methods to investigate snow stratigraphy at a scale of 10−2–10−4 m, with a focus on the microstructure of weak layers. The geometry-based simulations helped to differentiate the layers in a sample, not only by the change in morphology or measured microstructure, but also by changes in mechanical properties.
Computational aspects
Previous studies have demonstrated the importance of the RVE for a FE calculation of physical properties (e.g. as discussed in a mechanical context by Reference Srivastava, Mahajan, Satyawali and KumarSrivastava and others (2010) and shown in studies of thermal properties of snow by Reference Kaempfer, Schneebeli and SokratovKaempfer and others (2005) and Reference Calonne, Flin, Morin, Lesaffre, Rolland du Roscoat and GeindreauCalonne and others (2011)). Here we calculated the RVE with respect to Young’s modulus for low-density snow. The required minimal cube side length for a sample depends on the density and the snow type. The larger the structural size and the lower the density, the larger the RVE.
For the FE calculations, the extraction of subvolumes of the layers – for this purpose defined as regions with constant microstructure (e.g. SSA or density) and with an apparently constant grain shape – was done with respect to the calculated RVE, resulting in a cube side length of at least 7 mm. The shape of the volume has to be cubic, based on the following considerations: 7 mm in the vertical direction, z, includes enough structure for even large grains (e.g. DH). Horizontal (x –y plane) spreading is necessary to obtain structural homogeneity in this plane, important for Poisson’s ratio. Similar considerations were reported by Reference Kaempfer, Schneebeli and SokratovKaempfer and others (2005) in a thermal context. The requirement to meet the RVE size had the drawback that the properties of layers thinner than 7 mm were not calculated, because their resulting elastic constants were biased.
Simulating only one load case (uniaxial strain in the vertical direction), we did not calculate the full elasticity tensor and hence a true vertical Young’s modulus, Ezz . Furthermore E and ν were calculated from the FE results under the assumption of isotropy and structural homogeneity of the cubic subvolumes. This introduces bias in our values. Nevertheless, for the purpose of studying layering, we consider our calculations to be sufficient. The assumption of isotropy and homogeneity is also made in the analysis of laboratory experiments and for layer properties in fracture-mechanical models of slab avalanche release.
Young’s modulus and Poisson’s ratio
The log-transformed calculated Young’s moduli correlated well with density. We compared our data with previously published values from laboratory experiments (Reference Shapiro, Johnson, Sturm and BlaisdellShapiro and others, 1997; Reference Stoffel and BarteltStoffel and Bartelt, 2003; Reference ScapozzaScapozza, 2004; Reference Sigrist, Schweizer, Schindler and DualSigrist and others, 2006) and from FE simulations with real 3-D snow microstructures (Reference SchneebeliSchneebeli, 2004; Reference Srivastava, Mahajan, Satyawali and KumarSrivastava and others, 2010) (Fig. 3). Data from FE calculations generally give higher values than data obtained experimentally (this was also noted by Reference Srivastava, Mahajan, Satyawali and KumarSrivastava and others, 2010). Apart from the large variety of measurement methods, we interpret the lower values of E obtained from the experimental data as an effect of the low strain rates used for determining the elastic modulus, which introduce viscous effects.
For densities <250 kg m−3 the slope is different to that for higher densities (Fig. 3), and the correlation is lower (R 2 = 0: 68 cf. 0.92 for higher densities). We suggest that the lower correlation of E with lower densities is due to a greater influence of microstructure. Structural dead ends that do not contribute to the stress distribution have a larger impact in snow samples with low densities and introduce scatter.
Although our calculated elastic constants were primarily used to identify layers, we consider it an interesting result that no dependence on morphological snow type was found for E (Fig. 3). To be more precise, no range for E can be assigned to a given snow type. As a consequence, it cannot be generalized that a low Young’s modulus per se indicates weak snow: Young’s moduli of the weak layers were only low relative to the values in their adjacent layers (Fig. 5). To use E as an indicator for weak layers, the ’sandwich’, i.e. both the weak layer and the two adjacent layers, must be considered.
Microstructure could have more influence on Poisson’s ratio. If Poisson’s ratio is close to zero, the material is more compressible and more resistant to transverse contraction or expansion. This is associated with materials having stiff structures in the direction normal to the loading (Reference Greaves, Greer, Lakes and RouxelGreaves, 2011). Figure 4 shows that DH and DH mixed with facets have the lowest Poisson’s ratio. This would support the picture of vertically oriented load-bearing chains within DH which expand little in the horizontal direction. We note, however, that Poisson’s ratio within the sandwich does not distinguish the weak layers as E does. Figure 6 shows that weak layers can consist of many different structures, and not only of cup crystals and facets.
Layering at the microstructural scale
Layer transitions in our high-resolution μ-CT samples have a natural roughness given by the size of the microstructure. The high resolution also revealed layers only a few millimetres thick, which were often not observable in the field. Assigning the layers within the μ-CT sample to the layers found in the field was challenging. When the weak layer or the adjacent layers (defined as such in the field) were not clearly distinguishable in the corresponding μ-CT sample, the subvolume was not considered in the context of examining structural changes around a weak layer. We found that microstructural parameters from μ-CT measurements distinguished an a priori known weak layer from non-weak layers, not by absolute values but by the magnitude of their relative change. It is important to note that the relative change has to be calculated for the sandwich, i.e. layer-above–weak-layer–layer-below. By considering only two layers, a large change could also be due to a crust and is not necessarily due to a weak layer. More generally, the difference between a stratigraphic sequence without and with an embedded weak layer is the magnitude of the relative microstructural change over three adjacent layers.
Conclusion
The 3-D microstructure of 32 layered snow samples, cast in situ, with 22 embedded weak layers, was reconstructed with X-ray microcomputer tomography. The high-resolution data allowed objective quantification of structural changes at a scale of 10−2–10−4 m. Layers were distinguished by morphology, microstructural parameters and the elastic constants, Young’s modulus E and Poisson’s ratio ν. The two latter were calculated from CT-data-based FE calculations. This required a definition of a RVE with respect to Young’s modulus, as a RVE determined with respect to density would be too small to capture the representative elastic bulk properties. The relative vertical change in microstructure and elastic parameters was calculated for each sample. Layers were best distinguished through relative differences, but, except for Young’s modulus, no parameter consistently accounted for a structural change. Elastic properties are characteristic for a certain microstructure and E and ν are closely linked to the fracture properties of the snow. Mechanical properties are therefore a much better parameter to differentiate weak layers than purely structural properties. The comparison between layering in general and layering with a weak layer showed that the weak layer is most clearly distinguished by a strong relative change in microstructure when compared to both adjacent layers, and not by a single value.
Acknowledgements
M. Matzl processed the cast samples and evaluated the CT scans. M. Matzl, M. Proksch and J. Singer helped to sample the fragile snow. We thank Scanco Medical for support.


