


What does it take for state policymakers to enact policies in line with citizens’ preferences? A long literature shows that state policy is generally responsive to the symbolic ideology of the citizenry. Yet, more recently, Lax and Phillips (Reference Lax and Phillips2012) have shown that there is often a disconnect between what a majority of the public wants on a specific issue and what policy the state actually has in place. They call this incongruence between majority public preference and public policy a democratic deficit. Among their findings, however, a key implication is that salient issues are more likely to show policy congruence.
To contextualise this article’s contribution, Lax and Phillips (Reference Lax and Phillips2012) established that there is a democratic deficit in the states. They also established cross-sectionally that issues that are more salient are more likely to exhibit policy responsiveness and congruence with opinion. This article’s contribution first reaffirms the democratic deficit with newer data. However, we add that on seven salient health and immigration policy issues, there have been some improvements in the deficit. Notably, when controlling for past policy, states are more likely to change policies to make them congruent with opinion when there is a more lopsided majority to one side of an issue. In this way, we supplement Lax and Phillips’s story by illustrating that salience matters not only in an issue-to-issue cross-sectional comparison but also in understanding how democratic deficits can be moderately alleviated over time. We add the important caveat that we are limited in the degree to which we can assess dynamics and why change emerges over time because we only have two waves of data. However, what we do observe does fit with the theory that salience can improve policy congruence.
In elections near the end of the Obama Administration, culminating in Donald Trump’s election as president, issues that regularly drew attention were immigration and healthcare. Consider the 2014 election: That year, immigration was salient over anticipation that President Obama might take unilateral executive action to allow millions of undocumented immigrants to stay in the United States, and many Republican congressional candidates campaigned on a harsh immigration platform. Health was prominent in the election as the recently implemented Patient Protection and Affordable Care Act, or Obamacare, played prominently in voters’ minds. In particular, the 2013 botched rollout of the individual health insurance mandate and the insurance marketplace was still getting political play at the time. When considering programs like the State Children’s Health Insurance Program (SCHIP), attention to Obamacare likely shaped public opinion. Additionally, medical marijuana was a health issue that gained particular attention in 2014: Florida considered a medical marijuana ballot initiative and was one of four more states to consider marijuana-related ballot measures on the heels of 2012 ballot enactments in Colorado and Washington. Hence, the 2014 campaigns substantially drew voters’ attention to these issues.
To what degree do we still see a democratic deficit when issues rise to a particularly high level of salience? Burstein cites the role of salience and how it affects the responsiveness of policy to public opinion as a particularly important question that merits further study (Reference Burstein2003, 37). Lax and Phillips (Reference Lax and Phillips2012) showed cross-sectionally that policy is more responsive to and more congruent with public opinion when an issue is salient, which calls for the opportunity to also evaluate the complementary temporal story: Policy may become more congruent with opinion as legislators and referendum voters react to the heightened attention to these issues. By issue salience, we mean that an issue is getting a lot of media attention and, therefore, is a high priority for members of the public. We would generally expect that politicians will be more concerned about public preferences for issues that are covered extensively in the press and draw a lot of concerns from voters. We see evidence of how salient these issues were by examining public opinion data: Immigration and health rated higher on voters’ minds in 2014 than in 2008, with each issue drawing an increased share of Americans who declared the respective topic to be the nation’s “most important problem.”Footnote 1
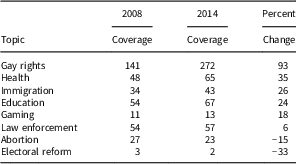
Table 1 offers additional evidence on just how much more salient these health and immigration issues were in 2014 relative to 2008. Doing a search for the number of articles in the New York Times archive related to each of 39 policies that Lax and Philips analysed, it appears that the health and immigration questions saw a higher rise in news coverage than most issue areas. The only issue class that saw a greater rise in coverage that these two topics were gay rights, where coverage of eight policy questions saw a 93% rise. Healthcare saw the second highest rise, with a 35% increase in five issues in this area, and immigration saw the third highest rise, with a 26% increase in coverage of four policy questions. After that, education (four policies) saw a 24% increase, gaming (two policies) saw an 18% rise and law enforcement (six policies) saw a 6% rise. Abortion questions (five policies) and electoral reforms (five policies) each actually saw a decrease in coverage. Hence, in the domain of issues studied before, health and immigration do show a noticeable jump in coverage. We focus on seven health and immigration issues because of their prominence in 2014 to see if there were substantial movements by states to create more congruence on these issues.
Number of stories in the New York Times about Policy Topics in 2008 and 2014
This article evaluates the degree to which state policy is responsive to and congruent with public opinion on these prominent issues by applying Lax and Phillips’s framework to an original dataset for 2014. For seven policy questions related to immigration (bilingual education, immigrant drivers’ licenses, immigrant in-state tuition, and E-Verify) and health care (medical marijuana, SCHIP eligibility, and doctor-assisted suicide), we developed a module for the 2014 Cooperative Congressional Election Survey (CCES). Our original survey uses the same question wording as Lax and Phillips’s work, but updates the dates of the survey by at least seven years on each issue. This allows us to reassess opinion-policy congruence while holding the exact issues at hand constant. Using these survey data, as well as policy measures updated for 2014, we evaluate which factors shape policy congruence when health and immigration issues draw a lot of political attention. This way, we revisit the persistence of the democratic deficit for prominent issues and add an over-time look at the story.
The principal reasons for revisiting the question of a democratic deficit in the states are twofold: First, immigration and health are salient, so they merit attention in their own right as important issues that have routinely risen to the top of the agenda in American history. Plus, we can tell a more temporal story about issues that stayed salient for a few years going into 2014. Second, Lax and Phillips did an impressively thorough job of finding public opinion questions on important issues from a variety of areas. However, some of the surveys that went into the public opinion measures were relatively old – dates of surveys ranged from 2003 to 2007 on the seven issues we consider in their model of policy as of 2008. By reanalysing these seven issues, we can update the data considerably and measure public opinion at the same time as we observe policy in 2014. Hence, this new analysis serves multiple purposes.
We proceed first by reviewing our theoretical expectations. Next, we describe our data, measurement strategies and empirical model specifications. In describing our data, we present our new 2014 estimates of state public opinion on these seven health and immigration issues. After that, we explain our results by offering descriptive analysis of policy outcomes, a model of policy responsiveness to opinion and a model of policy congruence with opinion. Finally, we conclude by describing the implications of our study.
Theoretical expectations
There is a consensus in the state policy literature that lawmaking is guided at least to some degree by public sentiment. Various studies, however, differ in whether they emphasise citizen ideology or issue opinion as a driving factor. To this end, it is worth distinguishing issue opinion, operational ideology and symbolic ideology as concepts. First, an issue opinion refers to the citizenry’s preference on one particular policy question, independent of other considerations. Second, operational ideology reflects citizens’ overall policy preferences across a variety of issues. Namely, would the person usually favour liberal policies across many issues, conservative policies across many issues, or some mixture? At the individual level, operational ideology might be thought of as ideological consistency and whether issue positions bind together as public discourse would suggest they should (Converse Reference Converse1964). At the aggregate level, operational ideology might be seen as the public’s overall preference for government activity and programs (Stimson Reference Stimson1991). Third, symbolic ideology refers to how voters personally identify themselves. At the individual level, this refers to whether the person thinks of him or herself as a liberal, moderate or conservative. This kind of measure is tied more to philosophical outlook of how government ought to function in principle, which may or may not relate to issue-specific positions. At the aggregate level, symbolic ideology can often be unique from what the public prefers on issues (Ellis and Stimson Reference Ellis and Stimson2012). Broockman (Reference Broockman2016) argues in favour of studying responsiveness one issue at a time as opposed to with an ideological scale that captures operational ideology. To that end, this study focuses primarily on issue-specific opinion and its relationship to policy, though we also control for symbolic ideology given past studies’ evidence that it too predicts policy outcomes.
Beyond the questions of issue opinion, operational ideology and symbolic ideology, there is a distinction between responsiveness to opinion, whereby higher levels of liberal opinion are associated with a higher propensity to enact liberal policy, versus congruence, which asks whether state policy corresponds to what a majority of a state’s electorate prefers (Lax and Phillips Reference Lax and Phillips2012, 148). In the responsiveness vein, Erikson et al. (Reference Erikson, Wright and McIver1993) seminally showed that general policy liberalism, bundling across a basket of issue areas, responds to the symbolic ideology of the electorate. This finding has been further confirmed controlling for additional factors and studying other time periods (Lascher et al. Reference Lascher, Hagen and Rochlin1996; Gray et al. Reference Gray, Lowery, Fellowes and McAtee2004; Monogan et al. Reference Monogan, Gray and Lowery2009). Moving to policy on specific issues, many laws are shaped primarily by citizens’ symbolic ideology. Lascher et al. (Reference Lascher, Hagen and Rochlin1996, 770) show that symbolic ideology separately predicts the scope of the former Aid to Families with Dependent Children program, education spending per pupil, years to state ratification of the Equal Rights Amendment, the extent of legalised gambling allowed, the scope of Medicaid in a state and the state’s tax progressivity. Other studies show that symbolic ideology predicts state-level immigrant policy (Monogan Reference Monogan2013) and that abortion policy responds to operational policy liberalism across New Deal issues (Mooney and Lee Reference Mooney and Lee1995).
For elected officials to craft laws that align with citizens’ self-identified ideology fits with Arnold’s (Reference Arnold1990) view of the electoral connection: Lawmakers enact policy based on how an opponent in the next election might characterise the issue. Hence, politicians are primarily concerned with what the public will think once an opponent actively campaigns with an issue. If incumbents enact policies that do not conform to electoral ideology, then a natural campaign tactic would be to focus on principles and argue that the incumbent violated them. Elected officials, therefore, have incentives to enact laws consistent with public ideology.
Many other studies of state-level issues show that policy responds to issue opinion, either in addition to or in lieu of symbolic ideology. These issues include the death penalty (Norrander Reference Norrander2000), gay rights (Haider-Markel and Kaufman Reference Haider-Markel and Kaufman2006; Lax and Phillips Reference Lax and Phillips2009a) and abortion policy (Arceneaux Reference Arceneaux2002). Observationally, the policies that respond to issue-specific opinion are easy issues, or issues that voters typically can state an opinion on without extensive background knowledge (Carmines and Stimson Reference Carmines and Stimson1989). Even more specifically, though, these are issues that elicit heightened emotional reactions and have many single-issue voters. As an exception to the pattern of responsiveness, past work on health care, specifically state universal health insurance mandates, shows that policy on a hard issue like this is less responsive to public opinion and more driven by elite preferences (Gray et al. Reference Gray, Lowery, Monogan and Godwin2010). Hence, there are important exceptions to the general responsiveness pattern, and it is important to account for elite actors’ dispositions when modelling policy on topics like health.
Despite general responsive patterns of policy to opinion, there is a paradox that responsiveness does not mean that a majority of the public is getting its preferred policy (Matsusaka Reference Matsusaka2010). In fact, only half of the time is policy congruent with opinion (Lax and Phillips Reference Lax and Phillips2012, 152–153). Several factors predict the likelihood of opinion-policy congruence, notably issue salience, whether public ideology aligns with or opposes issue opinion, and whether elected officials’ preferences align with or oppose public issue opinion (Lax and Phillips Reference Lax and Phillips2012, 162).
These findings are relevant because we examine seven policy questions that were particularly salient in 2014. Based on the past findings, these issues potentially can show greater responsiveness and congruence than in the past. Voter and government ideology should predict policy responsiveness on these issues as they do in general. Further, alignment of public and elite ideology with public opinion about the specific issue ought to affect congruence.
Data, measurement and model specification
To reevaluate the democratic deficit on prominent issues of immigration and health care during a salient election, we apply the framework developed by Lax and Phillips (Reference Lax and Phillips2012) to seven policy questions in 2014. For 2014, we remeasured state policy on four immigration issues and three health care issues. On immigration we studied: whether a state allows bilingual education to teach some students in their native language, whether undocumented immigrants can be granted drivers’ licenses, whether children of undocumented immigrants can receive in-state tuition for college, and whether public or private employers are required to use the E-Verify program to confirm legal immigration status.Footnote 2 On health, we observed whether the state allows SCHIP funding for children in a family of four making $60,000 a year, whether the state allows adults to use marijuana for medical purposes with a prescription, and whether doctor-assisted suicide should be allowed. It is worth noting that medical marijuana and euthanasia might be somewhat distinct from the SCHIP issue: whereas SCHIP has more of a social welfare element to it, marijuana and euthanasia have elements of culture wars about moral judgments. However, all do have an element of health policy to them, so we follow the practice of previous research and treat them all as health issues.
For these seven issues, we measured public opinion in 2014 as well. For each policy question, we asked 1,000 respondents from the 2014 Cooperative Congressional Election Study whether they would favour or oppose the policy. Since our data do not provide representative samples at the state level, we turn to the technique of multilevel regression with poststratification (MRP). In general, the MRP procedure begins by modelling individual survey responses. Then, responses are predicted for every combination of covariates and weighted based on known population quantities for the region of interest (Park et al. Reference Park, Gelman and Bafumi2004, Reference Park, Gelman and Bafumi2006; Tausanovitch and Warshaw Reference Tausanovitch and Warshaw2013). This method draws from weighting techniques also described in Gelman and Little (Reference Gelman and Little1997).Footnote 3 Adding these weighted predictions presents an estimate of issue opinion that includes a measure of uncertainty. Several studies show how versions of this technique can be useful for measuring state public opinion (Lax and Phillips Reference Lax and Phillips2009b; Pacheco Reference Pacheco2011; Monogan and Gill Reference Monogan and Gill2016). To implement this procedure in our case, we estimated a multilevel logistic regression model for each issue of the probability that a CCES respondent took the liberal position on the issue. We have two state-level predictors in the model: Obama’s vote share in 2012 and the percentage of the state identifying with a conservative religion (Evangelical or Mormon). We also include random effects by region and state. The other predictors are individual-level demographics: race, sex, education and age. With this model, we forecasted opinion in each state based on the state’s population distribution of demographic data, observed in the 2014 American Community Survey.
We present our MRP estimates of state public opinion in Figures 1 and 2. Starting with Figure 1, this graph shows opinion in the 50 states on each of four immigration issues. Each panel shows a strip plot in which the horizontal axis represents the predicted percentage of the state’s electorate that prefers the liberal policy. The vertical axis names each of the 50 states, sorted from the most conservative at the bottom to the most liberal at the top. Each point represents public opinion in the respective state, and the character for each state denotes extra information: states represented with an open black circle have the conservative policy, and states represented with a solid red triangle have the liberal policy.
Public opinion and public policy on four immigration issues in the 50 states in 2014.

Public opinion and public policy on health issues in the 50 states in 2014.

As Figure 1 shows, few voters take liberal positions for the issues of bilingual education, drivers’ licenses for illegal immigrants and opposing E-Verify. All 50 states have a conservative majority on these three questions, though there is variation in the size of that majority. By contrast, a majority of voters in all 50 states would like to offer in-state tuition to children of illegal immigrants who graduated from high school in the United States. In addition, we can see policy responsiveness to opinion pretty clearly for the issues of in-state tuition and drivers’ licenses, with the liberal policy being more probable among states with relatively liberal opinion on each respective issue. By way of illustration, the relative frequency of in-state tuition does rise as public support for the policy rises. Further, of the 10 states with drivers’ licenses for illegal immigrants, 9 are in the top 15 for public support. Oddly, though, we do not see this pattern with E-Verify. Only 19 states take the conservative position of requiring E-Verify for public or private employers, and these states are spread throughout the levels of public support. Also, descriptively, there is a noneffect for bilingual education, with the 10 states offering such classes being spread fairly evenly based on opinion.
Similarly, Figure 2 shows our predictions of public opinion for the health issues. On medical marijuana, all 50 states have majority support for the liberal policy. On euthanasia, 44 of 50 take the liberal line. SCHIP, by contrast, has a mix with 32 of 50 states preferring the liberal policy. For SCHIP, we see clear evidence of policy responsiveness. The states with the biggest majorities supporting SCHIP funding for families earning $60,000 are much more likely to provide such funding, and the nine states with the highest levels of public support all provide the higher level of coverage. On medical marijuana, there again is evidence of policy responsiveness, with bigger majorities increasing the probability that the state will allow medicinal use. This is clear as 16 of the 18 states where the policy is most popular all allow this. Lastly, on doctor-assisted suicide, only five states allow euthanasia, but they tend to be on the high end of public support. Despite the micronumerosity on this issue, then, the scarce data fit with the responsiveness hypothesis. Together, Figures 1 and 2 offer evidence in favour of policy responsiveness without accounting for any control variables, and they also describe the public opinion data we use in the larger models.
Model specification
In terms of our larger model specification, we follow Lax & Phillips’s specifications of their responsiveness model and their congruence model. Each is a multilevel logistic regression with random effects by state and by issue for both the intercept term and the partial slope coefficient for public opinion. We fit two models in each case: First, a 2008 model that uses Lax & Phillips’s data, subsetted to analyse only the seven issues examined in our updated data for the sake of providing a temporal comparison. Second, we estimate our 2014 model using new data we collected on these seven issues.Footnote 4
Our responsiveness models consider whether the state has the liberal policy as the dependent variable. Besides issue opinion, we also include symbolic voter ideology using Erikson et al.’s (Reference Erikson, Wright and McIver1993) formula of percent liberal minus percent conservative. We measure symbolic ideology in 2014 with a simple subsetting from the CCES common content (with 56,200 observations). We measure government liberalism with an average from 1990 to 2014 of Berry et al.’s (Reference Berry, Ringquist, Fording and Hanson1998) measure. We include the average Democratic state legislative seat share, the percentage of years that the governor was a Democrat, and the number of years of unified party control (e.g. “one-party dominance”) – all measured from 1990 to 2014.Footnote 5 Additionally, we control for whether there is single-sided powerful interest group support in favour of or opposed to the liberal policy: We use Lax & Philips’s coding of Nownes et al. (Reference Nownes, Thomas and Hrebenar2008) data, in which they coded interest groups that Nownes, Thomas and Hrebenar deemed to be powerful in each state as being likely to favour (+1) or oppose (−1) the liberal policy. Scores ranged from −1 if there were only powerful groups supporting the conservative position to 0 if there were offsetting interests or no interests with a position, to +1 if there were only powerful groups supporting the conservative position.
We also interact public opinion with one-party dominance in case consistent unified party control raises the prospect of more responsive government. Similarly, opinion is interacted with voter turnout (average turnout in presidential elections from 1992 to 2012) in case politicians are more responsive to a highly engaged public. Public opinion also is interacted with the overall salience of health versus immigration policies in case, cross-sectionally, we still see additional responsiveness for the more salient policies. We measure salience as Lax & Phillips do, by examining New York Times coverage of the general topics that the policy issues fall under. In this case, a LexisNexis search for 2014 shows that “healthcare” was a term used in 308 stories, while “immigration” was used in 1,680 stories, so these two story counts are put on a standardised scale. Unfortunately, this kind of measure does not allow for state-to-state variation due to the lack of reliable state newspapers of record in all 50 states, so we miss out on potential differential salience. Further, with only two topics it would be hard to find a dynamic measure that captured growth in salience, and we do not expect salience to have much additional impact because health and immigration issues are the focus precisely because they are prominent. Had we included some nonsalient issues as controls, we would have had greater expectations for this interaction term.
Finally, it is possible that institutions designed to empower the people electorally in a state could raise the degree to which state law responds to what voters want. For this reason, the responsiveness models also interact issue opinion with several state institutional features, including legislative professionalism (Squire Reference Squire2012), whether the state has term limits in the legislature, whether the state allows citizen ballot initiatives and whether the state’s highest court is elected. For each of these, we would expect that the effect of public opinion is heightened when the institution is present, which we test by examining whether the coefficient on the interaction term between each institution and public opinion is positive. Some studies have shown that ballot initiatives are not universally important for improving responsiveness but may only be effective in certain circumstances (Monogan et al. Reference Monogan, Gray and Lowery2009; Leemann and Wasserfallen Reference Leemann and Wasserfallen2016). We still include interactions for these institutions to control for the prospect that they may condition the effect.
Our congruence models consider whether the state’s policy is consistent with the will of the public majority as the dependent variable. We predict this with the size of the public opinion majority and an indicator for whether the majority prefers the conservative side of the issue. Presumably, a bigger majority is more likely to lead to congruence due to a clearer voice from the public, and a conservative position is more likely to see congruence because it is less likely to call for a change in policy. We also control for the degree to which symbolic ideology is at odds with issue opinion (e.g. “voter ideological opposition”): if the public supports the liberal position on an issue but ideologically thinks of itself as conservative (or vice versa) then this sends a mixed signal to legislators and can reduce congruence.
In terms of elite preferences, the congruence model accounts for the degree to which government ideology is unaligned with issue opinion (measured as government liberalism when the public wants the conservative policy and −1 times government liberalism when the public wants the liberal policy). This model also considers whether elective offices have been controlled by parties that would oppose the majority-preferred law. Legislative partisan opposition is coded as the percentage of the legislature that is Democratic if the public wants the conservative policy, or −1 times this quantity if the public wants the liberal policy.Footnote 6 Similarly, governor partisan opposition is coded as the percentage of years the governor was a Democrat if the public wants the conservative policy, or −1 times this quantity if the public wants the liberal policy. We again code one-party dominance exactly as we did in the responsiveness model, the percentage of years of one-party control, as this may elevate the chance for lawmakers to move policy in line with opinion.
As another set of predictors, we again consider that the probability of congruence may be affected by the institutional variables of legislative professionalism, term limits, citizen initiatives and elected courts. These variables are coded the same way they are in the responsiveness model; however, we need not interact these terms with any other predictor. For congruence, we need only a main effect to see if the probability of opinion-policy alignment is higher in the presence of each institution. Lastly, we consider that the political context could affect the probability of congruence. Hence, we include interest group opposition to the majority will, which uses the same coding of interest group liberalism as described in the responsiveness model if the public prefers the conservative policy, and it is coded as −1 times the original scale if the public prefers the liberal policy. We include average voter turnout in the 1992–2012 presidential elections to allow that policy may be more prone to congruence when politicians are mindful of an active electorate. Finally, we distinguish health versus immigration in terms of salience of news coverage in case there is an additional cross-sectional effect in terms of congruence. Just as in the responsiveness model, salience distinguishes that immigration received more national coverage than healthcare in 2014, so as a limited measure we do not expect an additional effect between these highly salient issues.
Results
Table 2 presents the distribution of our dependent variable of state policy as well as our key predictor of issue opinion, for each issue in turn. Each row represents one of our immigration or health care issues. The first numeric column presents the percentage of states with the liberal policy in the issue area. The second column presents the average level of support for the liberal opinion across the states. The third column presents the percentage of states in which a majority of the public prefer the liberal policy. The fourth column reports the percentage of states in which policy is congruent with public issue opinion. The fifth column shows the number of states with the liberal policy despite having a majority preferring the conservative policy. The sixth column shows the number of states with the conservative policy despite having majority liberal support. Seventh, we report the difference between these to show the net policy bias in favour of the liberal or conservative line. Lastly, we report what percentage of incongruent states is incongruent by adopting the liberal policy.
The democratic deficit by policy in 2014
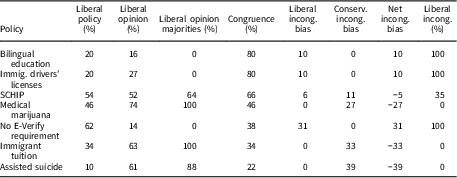
Table 2 is sorted based on the issue’s level of congruence. For three of these seven issues – bilingual education, undocumented immigrant drivers’ licenses and SCHIP funding – a majority of the states have a policy in line with voters’ preferences. For the other four, though, fewer than half of states have the policy that their citizens would prefer. This finding of which policies are mostly congruent is similar to past results using 2008 data by Lax and Phillips (Reference Lax and Phillips2012), though they found assisted suicide showed noticeably more congruence and bilingual education showed notably less. Averaging across states and issues, then, opinion and policy are congruent 52% of the time in 2014. For the same seven issues, the 2008 report showed an average congruence of 42 percent. So there is moderate improvement in the alignment of opinion and policy with a 10 percentage point rises from 2008 to 2014, perhaps in part due to the heightened attention to health and immigration at that time.Footnote 7
Another observation from Table 2 is that opinion majorities on five of the seven issues all fall on either one side or the other. (SCHIP and assisted suicide are the exceptions.) This means that the last four columns are not as informative for 2014 as they were for 2008 policy. For the five consistent-side issues, incongruence can only come from one side. If 0% of states have a liberal opinion majority (as is the case with bilingual education, for instance), then only the conservative policy can be congruent with opinion and any state that has an incongruent policy has the liberal policy. Similarly, if 100% of states have a liberal opinion majority (as is the case with in-state tuition for children of immigrants), then any state that has an incongruent policy has the conservative policy. By contrast, whenever states are split across the issue, policy incongruence can cut both ways.
Looking at specific issues in Table 2, for five of these issues (immigrant drivers’ licenses, use of E-Verify, in-state tuition, bilingual education and medical marijuana), the lopsided public opinion we observe matches what Lax and Phillips (Reference Lax and Phillips2012) found in their study of opinion and policy in 2008. So these five issues have been one-sided among the public for several years. However, we see a large shift on the issue of physician-assisted suicide, with liberal preferences to allow the practice expanding: In 2006, the year of Lax & Phillips’s survey data on the issue, average state-level support for allowing the practice was 49% with 52% of states having a liberal majority. Eight years later, our 2014 data show a higher average level of support for the policy at 61%, and now 88% of states have a liberal majority. We see a bigger shift on SCHIP funding, which can be explained by the passage of time: Lax and Phillips examine opinion in 2007 as to whether a family earning $60,000 should be eligible for SCHIP, and in 2014 we again asked about a family earning $60,000. Average support rose from 36% with only one state having a majority supporting funding in 2007 to an average of 52% support with 32 states having a majority supporting funding in 2014. This dramatic shift is likely on account of seven years’ inflation and respondents’ changing beliefs about how far $60,000 will go. So as we study these issues, public opinion has changed substantially in a couple of areas, which is informative in its own right and also opens up the potential for changing patterns in policy decisions.
Turning to a full analysis of policy choices, Table 3 reports our responsiveness models. Each column reports a multilevel logistic regression model that treats a state-issue as the unit of analysis, so observations of states are repeated to consider various issue areas. The response variable in each column is whether the given state has the liberal policy on the respective issue. The first numerical column subsets Lax and Phillips’s data from 2008 to consider only the seven health and immigration issues of interest in this study. The second column considers the same seven issues, but variables have been updated to their 2014 values. The third numerical column again models the 2014 values, but also controls for the 2008 policy as a predictor, to get a sense of why some states changed policies. Each row of the table reports a predictor’s partial coefficient, with standard errors listed below in parentheses. Coefficients which are discernible at the 95% level for a one-tailed test are marked with an asterisk. We use one-tailed tests because we have clear research hypotheses for all coefficients.Footnote 8
Policy responsiveness models for seven issues in two years

Note: *p<0.05 (one tailed). Each model is a multilevel logistic regression model with varying intercepts and slopes for opinion by policy and state. 49 states in each model, nonpartisan NE excluded (N 343). Continuous variables standardised by subtracting variable mean and dividing by two standard deviations. Estimates computed in R 3.4.3.
The results in Table 3 correspond well with the original results reported by Lax and Phillips (Reference Lax and Phillips2012). The first numeric row shows the partial coefficient for public opinion. While this coefficient was positive and significant in past research, we do not see an effect on the established level of policy in either 2008 or 2014. However, when past policy is controlled for, it has the positive effect that would be expected. In other words, whenever we hold a past state’s policy constant, the probability of a liberal policy rises with liberal opinion. This implies that changes from 2008 to 2014 were the result of changes to conservative policies in states below average in support for the left wing solution, and changes to liberal policies in states with a relatively high support for the left wing solution.
Symbolic voter ideology behaves uniquely in Table 3. While public ideology had a positive and significant effect in Lax & Phillips’s 39-issue model, for the seven-issue model of 2008, we do not see a discernible effect for public ideology. In 2014, however, liberal public ideology predicts liberal public policies. This 2014 result implies that lawmakers are concerned with how voters might see these issues in principled terms during the next election. Further, in the last column we see a strong effect for symbolic voter ideology in the last column, suggesting that movement may also have been to align with voters’ general philosophies.
A final result worth drawing attention to in Table 3 is the partial coefficient for percentage of the legislature that is Democratic. For both the static 2008 and 2014 models, we find a negative and significant effect of legislative partisanship.Footnote 9 The result here is important in that it validates an earlier result by Erikson et al. (Reference Erikson, Wright and McIver1993, 126), which demonstrates that when government liberalism is controlled for the marginal effect of party is negative. While counterintuitive at first, and not at all implying that electing Republicans is the path to liberal policy (or vice versa), this result makes sense once we consider that officeholders’ partisanship and ideology are usually aligned. Whenever the two are unaligned, the party likely sees a need to adopt more moderate policies to appeal to an electorate that normally would vote against them. This result is further reinforced in 2014 by the negative coefficient for percentage of years the governor was a Democrat (though such an effect is not present for gubernatorial partisanship in 2008). It is possible that these results emerge largely on account of multicollinearity but they are nevertheless worth reporting as being consistent with Erikson et al.’s work (Reference Erikson, Wright and McIver1993).Footnote 10 Importantly, these variables and government ideology all have an effect of the established level of policy; however, when we model 2014 policy with 2008 policy as a control, we see that neither of these variables speaks to how policy changes when we account for past policy in the last column.
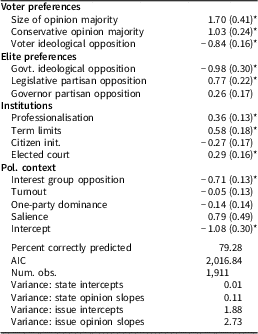
We now turn to our policy congruence models in Table 4. We expect that larger majorities are more likely to get their preferred policy. Yet, this effect does not hold up in the static models of 2008 or 2014 when we study the established state of policy for the seven issues: the coefficient for the size of the issue opinion’s majority is indiscernible. However, the 2014 model with a lag does show a positive and significant effect for size of opinion majority. Here we get a possible sense for how congruence rose from 42 to 52%: states that moved into alignment on an issue had a larger portion of the public backing the change.
Policy congruence models for seven issues in two years
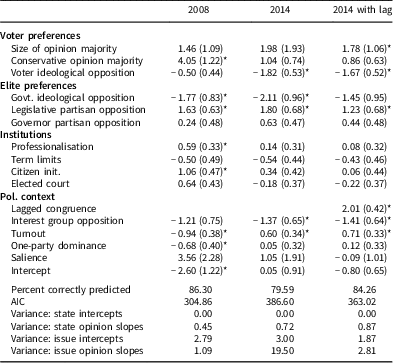
Note: *p<0.05 (one tailed). Each model is a multilevel logistic regression model with varying intercepts and slopes for opinion by policy and state. 49 states in each model, nonpartisan NE excluded (N 343). Continuous variables standardised by subtracting variable mean and dividing by two standard deviations. Estimates computed in R 3.4.3.
Importantly in Table 4, government ideological opposition has a deterring effect on policy congruence. That is, when the ideology of officeholders is unaligned with majority opinion on a policy issue, the probability of opinion-policy congruence diminishes. This holds for 2008 as well as 2014 (for the static models). Meanwhile, the coefficient for voter ideological opposition is always negative, but this effect was significant only for the 2014 models (static and dynamic) and not the 2008 seven-issue model. We do not see a discernible effect for salience in any model, which again is not surprising given that these are national measures for two issue areas that are both highly salient.
Finally, a noteworthy result comes in the effect of legislative partisan opposition. Substantively, once ideological and opinion-based factors are held constant, having a party in the legislature that normally adopts a line opposite a majority’s preferences incrementally raises the probability of policy becoming congruent. This result also fits well with Erikson et al. (Reference Erikson, Wright and McIver1993) finding that partisanship can have a moderating effect when holding ideology constant. This finding would suggest that parties strategically moderate on specific issues in which the public majority prefers a policy other than the party line. Legislative partisanship also has a discernible effect on congruence in the model controlling for the past – further suggesting that when politicians change policy they may be looking toward policies that are associated with the other side but popular. Since lawmaking originates in the legislature, it makes sense that legislative partisanship would be more relevant than gubernatorial partisanship. Like the responsiveness model, these results may be due to multicollinearity. Yet, they are still worth reporting as being consistent with Erikson et al. (Reference Erikson, Wright and McIver1993) argument that understanding the role of party requires a sense of the broader ideological and public opinion context.Footnote 11
Implications
Updating public opinion and public policy data on seven health and immigration issues, we find that a democratic deficit that existed on these issues in 2008 improved slightly in 2014. Even with this improvement, only 52% of the time on these seven issues will state policy be in line with voters’ preferences. Yet, we see that public opinion has a stronger effect on policy in 2014 relative to 2008. All of this is consistent with the expectation that issue salience has moderately altered the way in which lawmakers choose what to implement on these topics, and issue opinion has become more important on these policies.
In particular, a pooled model of the issues of bilingual education, undocumented immigrant drivers’ licenses, in-state tuition, E-Verify, SCHIP funding, medical marijuana and euthanasia shows that policies are responsive to opinion in 2014, with liberal opinion predicting liberal policy, but only if policy from 2008 is considered as a control. This means that as any states changed policies from 2008 to 2014, policies changed in line with public preferences. Importantly, other factors that shape policy choices in these areas consistently at both times of observation are government ideology and partisanship of the state legislature. For these seven issues, whether policy is congruent with public preferences is not contingent on the size of the majority in static models of 2008 or 2014, but the lopsidedness of issue opinion does have an impact on how policy changed from 2008 to 2014. Hence, the states moving into alignment on a particular issue were those with big majorities supporting the policy. Additionally, two factors that predict consistently whether the state’s policy will be congruent with public issue opinion include ideological opposition from elected officials and partisan opposition in the legislature. So elite ideology and partisanship play an important role from the perspective of either responsiveness or congruence. A key finding, therefore, is that as salience changes over time, so too can the impact of public opinion.
Some important limits of our results should be recognised because we only have two waves of data on a group of issues that is salient. We focus on healthcare and immigration issues because they are prominent and salient, but this limits our ability to test the effect of salience in other ways. Both healthcare and immigration grew more salient over the time period we studied, but future work should consider issues that maintain the same level of salience or that experience a drop in media coverage. If we could observe in this time frame whether issues with steady attention or a drop in salience increase, maintain or lose congruence levels it would make for a nice comparison. Finally, because we only have two waves of data, we cannot definitively establish why we would see improvement in congruence for these issues due to data limitations. It may be because these issues are salient, as theory would have implied, or perhaps some other factor drove this change.
As an example of the last point, some might argue that our improved responsiveness and congruence in 2014 may be due to polarisation. Under this view, both voters and elites across regions have diverged, thereby inducing greater congruence. If anything, though, we believe that our results imply that polarisation would be harmful to the quality of representation. Voter and elite ideology have continued to prove important for determining what policies are enacted. This might raise the specter that policy will only become less aligned with opinion in the future as elites and voters become more polarised. In particular, with greater polarisation, elected officials may be less inclined to enact policies that are popular with the general public but not within their own party for fear of how their primary constituencies may be mobilised on ideological terms by in-party challengers.
Another possibility that could be raised is that, if opinion-policy congruence has improved, it may be that political elites are leading public opinion. This study’s theory is based on literature that argues that policymakers are responsive to the public will, even if a democratic deficit has emerged on specific issues. However, scholars like Jacobs and Shapiro (Reference Jacobs and Shapiro2000) and Lenz (Reference Lenz2012) argue that politicians seek to lead the public, so congruence between opinion and policy is the result of public opinion’s moving in line with elites’ preferences. While we cannot definitively separate the reasons why these results contrast without more time waves, these findings of improved opinion-policy congruence certainly do support our expectations given the salience of the issues, even if we cannot rule out all other possibilities.
For the time being, the encouraging finding is that with increased salience on health and immigration came a moderate improvement in policy congruence to public opinion for these issues. Perhaps, representation is occurring more through elections as opposed to reacting directly to public opinion (Stimson et al. Reference Stimson, MacKuen and Erikson1995). Policy is responsive to government ideology, which changes in response to voters’ overall preferences. With time and large support among the public, democratic deficits may gradually be alleviated.
Acknowledgements
Paper prepared for presentation at the Subnational Political Dynamics Conference, February 9–10, 2018, Tempe, AZ, USA. A previous version of this research was presented at the 15th Annual State Politics and Policy Conference, May 28–30, 2015, Sacramento. For helpful assistance, we thank Keith T. Poole, Alex Garlick, Mark D. Ramirez, Stephen Ansolabehere, Thomas M. Carsey, Jamie L. Carson, Iliyan Iliev, Thorin Wright, Reed Wood, Sarah Shair-Rosenfield, Rodney Hero and several anonymous reviewers. For sharing data, we thank Jeffrey R. Lax, Justin H. Phillips, Keith T. Poole, Stephen Ansolabehere, Carl E. Klarner, William D. Berry, Richard C. Fording and Mike Malecki. This work was part of the 2014 Cooperative Congressional Election Study and was supported by the National Science Foundation, Award #1430505. Replication materials are available at our Dataverse (http://dx.doi.org/10.7910/DVN/PLVYXH) and at the Journal of Public Policy Dataverse (https://doi.org/10.7910/DVN/1WDJVC).
Appendix
This appendix proceeds in six parts. First, it describes the sources of all of the data we use. Second, it lists the exact question wording from our survey questions on the 2014 CCES. Third, it reports the results of our multilevel logistic regression models of issue opinion, which are then used to forecast state aggregate opinion using multilevel regression with poststratification. Fourth, it reports a replication of Lax and Phillips’s (Reference Lax and Phillips2012) full 39-issue models. Fifth, it presents additional details about the New York Times news coverage information presented in the introduction. Sixth, it presents some robustness checks and additional information from models.
Data sources
The list below details where we gathered 2014 state policy data, as well as our various predictors to fit our updated models of policy responsiveness and congruence.
∙ Policy outcomes by state:
− Bilingual education policies enacted: ProEnglish Language Advocates. https://www.proenglish.org/projects/bilingual-education.html (accessed 1 October 2014)
− Doctor-assisted suicide laws: Euthanasia ProCon organization. http://euthanasia.procon.org/view.resource.php?resourceID=000132 (accessed 1 October 2014)
* Change in New Mexico law, New York Times. http://www.nytimes.com/2014/01/14/us/new-mexico-judge-affirms-right-to-aid-in-dying.html? (accessed 1 October 2014)
− Driver’s licenses for illegal immigrants by state in 2014. National Immigration Law Center. http://www.nilc.org/driverlicensemap.html (accessed 7 October 2014)
− E-Verify state laws. Justifacts Credential Verification, Inc. http://www.justifacts.com/e-verify-state-map/ (accessed 2 October 2014)
− In-state tuition for undocumented immigrants. National Immigration Law Center. http://www.nilc.org/basic-facts-instate.html (accessed 2 October 2014)
− Medical Marijuana laws: Medical Marijuana ProCon group. http://medicalmarijuana.procon.org/view.resource.php?resourceID=000881 (accessed 30 September 2014)
− SCHIP guidelines in 2014: Kaiser Family Foundation. http://kff.org/medicaid/fact-sheet/where-are-states-today-medicaid-and-chip/ (accessed 2 October 2014) Cutoff for liberal policy: 252% of federal poverty line, or $60,000.
∙ Public opinion measures:
− Citizen ideology is measured using the 2014 Cooperative Congressional Election Survey Common Content, which includes 56,200 respondents. We applied Erikson:1993’s (Erikson:1993) formula of subsetting the data by state, and then taking the difference between percent liberal and percent conservative.
− Public opinion ideology is measured using our module in the 2014 Cooperative Congressional Election Survey. We fitted a multilevel logistic regression model for liberal opinion on each policy issue question using demographic variables. Then we forecast overall state opinion with population-level demographics measured in the 2014 American Community Survey, downloaded from the Integrated Public Use Microdata Series (Ruggles et al. Reference Ruggles, Alexander, Genadek, Goeken, Schroeder and Sobek2010)
∙ State characteristics:
− Elected or appointed judges. American Bar Association. http://www.americanbar.org/content/dam/aba/migrated/leadership/fact_sheet.authcheckdam.pdf (accessed 6 March 2015).
− Government ideology data (NOMINATE-based version) averaged from 1990-2014. Update of Berry et al. (Reference Berry, Ringquist, Fording and Hanson1998) downloaded from Richard C. Fording’s website. https://rcfording.wordpress.com/state-ideology-data/ (accessed 8 March 2015).
− Initiative and referendum policies by state. Initiative and Referendum Institute. http://www.iandrinstitute.org/statewide_i%26r.htm (accessed 6 February 2015).
− Interest group balance. Three-category measure based on whether there are strong interest groups taking the conservative or liberal line, using data from Nownes et al. (Reference Nownes, Thomas and Hrebenar2008). Data provided by Jeffrey Lax and Justin Phillips from Lax and Phillips (Reference Lax and Phillips2012).
− State legislative professionalism. 2009 value of Squire index (Squire Reference Squire2012).
− State legislative seats per party and party of governor.
* Legislatures, 1990-2011: Carl Klarner’s “State Partisan Balance Data, 1937-2011.” http://hdl.handle.net/1902.1/20403 (accessed 24 May 2016).
* Governors, 1990-2011: Carl Klarner’s “Governors Dataset.” http://hdl.handle.net/1902.1/20408 (accessed 24 May 2016)
* Legislatures and governors, 2012-2014: National Conference of State Legislatures. (accessed 16 May 2016)
· 2012: http://www.ncsl.org/documents/statevote/legiscontrol_2012.pdf
· 2013: http://www.ncsl.org/documents/statevote/legiscontrol_2013.pdf
· 2014: http://www.ncsl.org/documents/statevote/legiscontrol_2014.pdf
− State legislator term limits. National onference of State Legislatures. http://www.ncsl.org/research/about-state-legislatures/chart-of-term-limits-states.aspx#1 (accessed 6 February 2015).
− Voter turnout in 1992–2012 presidential elections. United States Election Project. http://www.electproject.org/ (accessed 25 May 2016).
Question wording from 2014 CCES
For the seven policies we studied, we had a question on the 2014 CCES asking respondents’ preferences on each issue. The exact question wording is presented in the list below.
Bilingual education: Do you think all public school classes should be taught in English or do you think children of immigrants should be able to take some courses in their native language?
Doctor-assisted suicide: If someone is terminally ill, is in great pain and wants to kill themselves, should it be legal for a doctor to help them to commit suicide or not?
Drivers' licenses for illegal immigrants: Do you think state governments should or should not issue drivers’ licenses to illegal immigrants?
E-Verify: Do you favour or oppose requiring employers to check with a federal government database that verifies the legal immigration status of any job applicant they are considering hiring, including both native-born and foreign-born applicants?
In-state tuition for immigrant children: Do you think the children of illegal immigrants who graduate from high school in the United States should be allowed to attend state public colleges at the same reduced in-state tuition rates as other state residents, or should they pay higher tuition?
Medical marijuana: Do you think adults should be allowed to legally use marijuana for medical purposes if their doctor prescribes it or do you think that marijuana should remain illegal even for medical purposes?
SCHIP eligibility: The Children’s Health Insurance Program, or SCHIP, is a program in which the federal government joins with states to fund health insurance for children whose parents make too much to qualify for Medicaid. Currently, approximately 8 million children get health insurance through this program at a cost to the federal government of $27.5 billion over 5 years. Thinking about who should be eligible for the program, what about children in a family of four making about $60,000 per year, should they be eligible or not?
Multilevel regression with poststratification results
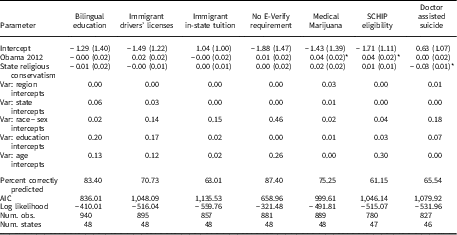
Table A.1 presents the results of seven multilevel logistic regression models fitted to our policy issue questions on the 2014 CCES. Each equation models the probability that the respondent chooses the liberal option. The first three rows report the estimate and standard error for the intercept, partial slope for Obama’s 2012 vote share and partial slope for the percentage of the state having a conservative religion (Mormon or Evangelical Christian). All other terms are random effects based on region, state, race-sex category, educational group and age group. Cell entries for these terms are the estimated variances of the random effects. Residual variance is fixed at 1 in every model for identification purposes. Each question was posed to 1,000 respondents, and the reported sample size reflects the number of valid responses obtained. This model was then used to forecast aggregate public opinion in each state using the distribution of demographic data from the 2014 American Community Survey, which is treated as the population distribution of demographics.
Multilevel logistic regression models of whether the respondent prefers the liberal position on an issue
Full replication of Lax and Phillips (Reference Lax and Phillips2012)
In these two tables, we exactly replicate the models presented by Lax and Phillips (Reference Lax and Phillips2012). Table A.2 reproduces their responsiveness model across 39 issues in 2008. Table A.3 reproduces their congruence model across 39 issues in 2008. The models reproduce well in comparison to the printed results of the original article.
Policy responsiveness model for 39 issues in 2008

Policy congruence model for 39 issues in 2008
Salience of 39 policy questions in 2008 and 2014
Table 1 in the main article evaluates salience of the policy areas examined by Lax and Phillips (Reference Lax and Phillips2012) in 2008 and in 2014. To develop this table, we searched the archives of the New York Times at https://query.nytimes.com/search/sitesearch/ on 3 February 2018. We restricted our searches to articles printed in the US section from January 1 to December 31 of each respective year. We conducted 39 searches for each year to consider terms related to each of 39 policy questions. Article Table 1 aggregates these counts based on the topic area of each policy question. The terms we searched on, and their broader topic areas, are as follows:
Abortion: abortion notification, abortion counselling, abortion partial birth, abortion waiting period and abortion parental consent.
Education: education affirmative action, education charter schools, education standardised tests and education vouchers.
Gaming: gaming casinos and gaming lottery.
Gay rights: gay rights adoption, gay rights hate crimes, gay rights health benefits, gay rights housing, gay rights employment, gay rights marriage, gay rights sodomy and gay rights civil unions.
Electoral reform: electoral reform corporate contributions, electoral reform individual contributions, electoral reform photo id, electoral reform recall elections and electoral reform term limits.
Health care: health care medicaid access, health care medical marijuana, health care schip, health care stem cell and health care assisted suicide.
Immigration: immigration bilingual education, immigration driver’s licenses, immigration in-state tuition and immigration e-verify.
Law enforcement: law enforcement assault weapons, law enforcement concealed weapons, law enforcement death penalty, law enforcement waiting period, law enforcement marijuana decriminalisation and law enforcement drug sentences.
Additional model information and robustness checks
Figure A.1 shows additional information about the models reported in main article Table 4. Specifically, for the static models from 2008 and 2014, these are the best linear unbiased predictors for the random effects on the size of opinion majority coefficient. On each axis, the horizontal axis represents the value of the random effect, and the states are represented on the vertical axis, sorted in both figures based on the values of their 2014 random effects. For each state, the total effect of size of opinion majority would be the reported coefficient from article Table 4, plus the number represented by the random effect pictured. Since the states are sorted in both panels based on their 2014 values, we can see that there is no persistent ordering in which states are more responsive to a large majority than others. In 2008, the random effects appear to be randomly distributed when sorted on the 2014 values. Hence, there does not appear to be any pattern of particular states that tend to do a consistently better job of responding to the size of the opinion majority holding the model’s predictors constant.
Random slope terms of effect of size of opinion majority terms. Random effects by states in the static models of policy congruence in 2008 and 2014. States sorted based on 2014 random effects in both panels.

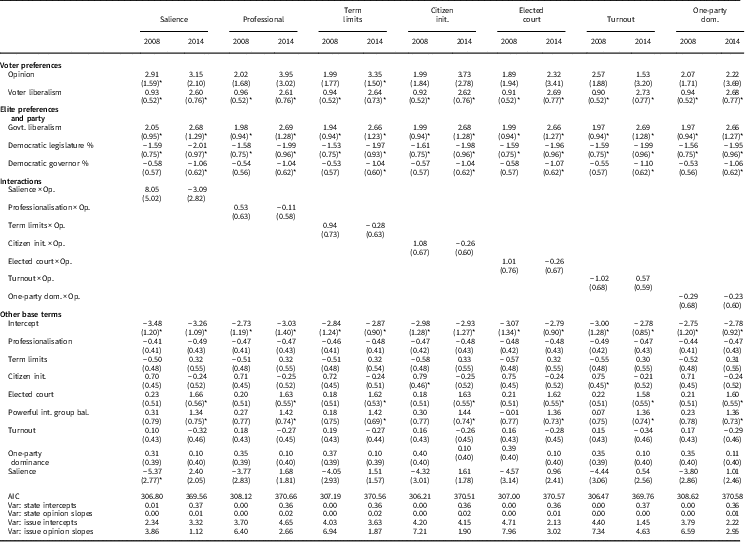
Turning to robustness checks, Table A.4 repeats the responsiveness models using only one interaction term at a time. Since the original model contains seven interaction terms, it is worth considering whether the results are sensitive to having so many interactions at once. The results in the one interaction at a time models are pretty similar to what is found in the fully specified model. The exceptions are as follows: In 2008 when there is only an interaction for salience and in 2014 when there is only an interaction for term limits, public opinion shows a positive and significant effect (whereas it is null in all other specifications). Meanwhile, for the interactions themselves, none showed a discernible effect in 2014 for either the full specification or for the one-at-a-time specifications. For 2008, the full specification showed discernible effects for the interactions between turnout and opinion as well as one-party dominance and opinion. In the one-at-a-time specifications, though, these effects were no longer discernible. The main effect for citizen initiative is positive and significant in the 2008 full specification, and it is only significant in some specifications of the one-by-one interaction models. On balance, the results reported in the main model are robust, with none of the main predictors seeing a change in their effects.
Policy responsiveness models for seven issues in two years, one interaction at a time
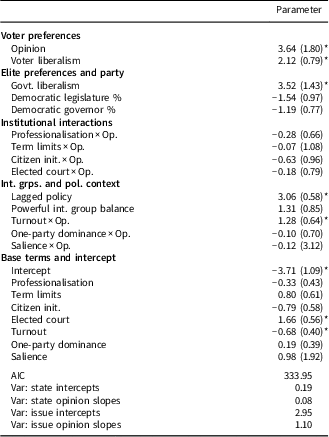
A final pair of robustness checks can be found in Tables A.5 and A.6. These tables repeat the dynamic models of policy in 2014 reported in the final columns of Tables 3 and 4 of the main article, respectively. However, in the main text, several predictors were measured over the 1990–2014. These models, however, shorten the measurement window to 2009–2014. This ensures that information after 2008 (when lagged policy is observed) is all that is included in covariate values. Hence, these results trade off a shorter window of measurement for being better able to capture information that could speak to why policy may have changed from 2008 to 2014.
Policy responsiveness model for 2014 with measures computed 2009–2014
Policy congruence model for 2014 with measures computed 2009–2014



