


Media summary: Fieldwork suggests two paths to develop cross-cultural competence; one may promote cultural sustainability, the other loss.
The last 40,000 years of human evolutionary history are characterized by a diversity of behavior without precedent in nature (Foley and Lahr Reference Foley and Lahr2011). This behavioral diversity, often structured in symbolically marked groups (e.g. ethnic groups; Barth Reference Barth and Barth1998), is a consequence of our evolved dependence on both individual and social learning for the acquisition of many skills and beliefs that have been, on balance, adaptive in the varying socioecological conditions encountered and created as our ancestors spread across the planet (Henrich and McElreath Reference Henrich and McElreath2003; Richerson and Boyd Reference Richerson and Boyd2005). Much of the richness of human history derives from interaction between members of such culturally distinct ethnic groups, be it mutually beneficial exchange, inter-marriage or exploitation and violence (Wolf Reference Wolf1982; Sahlins Reference Sahlins, NB Dirks, Eley and SB Ortner1994). However, at present, we have only a rudimentary understanding of mechanisms underlying the cultural dynamics that often accompany such inter-ethnic interaction, entailing adoption of both adaptive and non-adaptive group-typical (i.e. cultural) behaviors and beliefs across group boundaries (Bunce and McElreath Reference Bunce and McElreath2017). We thus require a more comprehensive theory of cultural dynamics at ethnic boundaries in order to better understand patterns in the linked genetic and cultural evolutionary history of our species (e.g. the spread of dairying culture and lactase persistence; Ségurel and Bon Reference Ségurel and Bon2017). Importantly, such theory may also shed light on the foundations of some contemporary societal problems.
For instance, fears of cultural loss or dilution as a consequence of inter-ethnic interaction form an important component of both domestic and international politics, and appear to be especially salient in recent discourse. They have motivated international protections for minority indigenous cultures undergoing social integration (United Nations General Assembly 2007), as well as nationalistic rhetoric decrying the influence of immigrants on host nation culture (Akkerman and Hagelund Reference Akkerman and Hagelund2007; Betz and Meret Reference Betz and Meret2009; Rydgren Reference Rydgren2007; Golder Reference Golder2016). The effect of such inter-ethnic interaction on cultural maintenance or change is likely to depend crucially on individuals who can interact successfully on both sides of an ethnic boundary. For instance, studies of language contact show that bilingual individuals can play a critical role in both the rate and direction of language change (Kandler et al. Reference Kandler, Unger and Steele2010; Fernando et al. Reference Fernando, Valijärvi and Goldstein2010; Lambert Reference Lambert1981). However, current concern over cultural sustainability usually also involves perceived threats to valued non-linguistic culture-specific norms of coordination, such as beliefs about what constitutes appropriate behavior in a given context (Bunce and McElreath Reference Bunce and McElreath2017). Politically salient examples of such perceived threats include conflicting norms of gender relations (Akkerman and Hagelund Reference Akkerman and Hagelund2007), democratic participation (Betz and Meret Reference Betz and Meret2009) and pedagogy (Trapnell Reference Trapnell2003; United Nations General Assembly 2007). Interaction between members of groups with incompatible norms can result in costly failures (Sahlins Reference Sahlins, NB Dirks, Eley and SB Ortner1994), as well as the eventual loss of one group's distinctive norms (Bunce and McElreath Reference Bunce and McElreath2017, Reference Bunce and McElreath2018). This perceived loss, when associated with group identity, can lead to both political backlash and harm to individual psychological health (Berry Reference Berry1997).
As a generalization of the concept of bilingualism to include such non-linguistic cultural norms, I here use the term cross-cultural competence – the ability to interact successfully using both in-group and out-group norms. Knowledge of norms and values important to the out-group is a characteristic of peaceful multiethnic societies (Wise and Velayutham Reference Wise and Velayutham2014), and is a potentially vital component of inter-group coordination to avoid violent conflict (Ginges et al. Reference Ginges, Atran, Medin and Shikaki2007). Cross-culturally competent individuals are expected to have the ability to consciously recognize and compare such out-group norms with the norms of their own group, i.e. they manifest a cultural metacognition that may entail cultural perspective-taking (Mor et al. Reference Mor, Morris and Joh2013). Like bilingualism, general cross-cultural competence probably plays an important role in cultural maintenance and change. However, despite considerable attention in psychology (Hong et al. Reference Hong, Morris, Chiu and Benet-Martínez2000; Berry Reference Berry1997), medicine (Anand and Lahiri Reference Anand, Lahiri and Deardorff2009), business (Johnson et al. Reference Johnson, Lenartowicz and Apud2006) and inter-cultural education (Trapnell Reference Trapnell2003), and its importance in the historical record (Lamana Reference Lamana2008) and contemporary lived experience (Wise and Velayutham Reference Wise and Velayutham2014; Kopenawa and Albert Reference Kopenawa and Albert2013), cross-cultural competence is conspicuously absent in all but a few (Kuran and Sandholm Reference Kuran and Sandholm2008; Carvalho Reference Carvalho2017) studies of cultural dynamics (Bunce and McElreath Reference Bunce and McElreath2018; Boyd and Richerson Reference Boyd and Richerson2009; Creanza et al. Reference Creanza, Kolodny and Feldman2017; Erten et al. Reference Erten, van den Berg and Weissing2018; Mesoudi Reference Mesoudi2018), primarily because it both complicates theoretical models and is notoriously difficult to operationalize and measure (Spitzberg and Changnon Reference Spitzberg, Changnon and Deardorff2009; Fantini Reference Fantini and Deardorff2009).
Measuring cross-cultural competence
One of the difficulties of measuring cross-cultural competence is that, unlike bilingualism, it must account for uncertainty in individual norms. For instance, although all members of an ethnic group may be able to communicate using the same language (despite within-group speech variants: Labov et al. Reference Labov, Fisher, Gylfadottír, Henderson and Sneller2016), rarely do they all hold exactly the same norms in other domains (Bunce and McElreath Reference Bunce and McElreath2017). Thus, when deciding how to behave with unfamiliar in-group and out-group members, a cross-culturally competent individual must employ heuristics about the probability distributions (commonness) of particular norms in the respective groups. Figure 1 shows how such heuristics, manifesting as guesses about the norms held by in-group and out-group members, can be used to derive an experience-level measure of cross-cultural competence. Different experiences with out-group norms may be associated with different degrees of relative cross-cultural competence, which is indicated by lower inaccuracy of out-group guesses and no greater inaccuracy of in-group guesses. Here, guess accuracy is used as a proxy (i.e. a necessary but not sufficient condition) for the ability to interact successfully using those norms.
Derivation of experience-level cross-cultural competence. (a) Determine the probability that individuals with a given type of inter-ethnic experience hold a given norm, as well as their guesses about the norm held by an anonymous, randomly chosen out-group and in-group member. (b) Compare guess probabilities with the actual probabilities that out-group and in-group individuals hold the norm, and compute Kullback–Leibler divergence (Kullback and Leibler Reference Kullback and Leibler1951) between these probability distributions as a measure of guess inaccuracy (in natural units of information entropy – see Materials and Methods). (c) Relative cross-cultural competence for an experience type is defined as less inaccurate out-group guesses and no more inaccurate in-group guesses than individuals with other types of experience. Two paths to cross-cultural competence (Y and Z) are distinguished by the norms that individuals hold.

Figure 1 also shows that this measure distinguishes between two forms of cross-cultural competence, which differ in whether an individual personally holds norms typical of the in-group (Experience Y) or typical of the out-group (Experience Z). As discussed below, these two forms appear to have profoundly different implications for the sustainability of valued cultural traits within a multiethnic society. A norm that is personally held is here defined as that which an individual would prefer to employ when interacting with a(nother) cross-culturally competent individual capable of employing either norm. This preference could be associated with an internalized injunctive norm or with a pragmatic descriptive norm (Morris et al. Reference Morris, yi Hong, Yue Chiu and Liu2015; Bicchieri Reference Bicchieri2006) contingent on the contextual cues present during an individual's most frequent or most important coordination interactions in that domain.
Measuring cross-cultural competence in this way requires several additional assumptions. First, we must assume that an individual's personally held norms can be investigated through her/his responses to ethnographically informed interview questions. Care must taken in interpretation of such data, as the norms people express in response to interview questions may, as a result of perceived social pressure, not necessarily correspond to their actual behavior (Cronk Reference Cronk1991). Furthermore, people's perceptions of which norms are widely distributed within their own society, and, therefore, the norms it behooves them to follow in public, may bear little resemblance to the actual distributions of the norms that people in the society personally hold. In the extreme case, known as pluralistic ignorance (Katz and Allport Reference Katz and Allport1931; Miller and McFarland Reference Miller and McFarland1987; Prentice and Miller Reference Prentice and Miller1993), the norm believed to be widely held, and followed, by most members of a society conflicts with the norm that those same individuals hold. Cultural competence in such a context would require knowledge of the norms that people in a society believe to be widespread (intersubjective cultural knowledge: Chiu et al. Reference Chiu, Gelfand, Yamagishi, Shteynberg and Wan2010), rather than knowledge of the commonness of people's personally held norms. The measure of relative cross-cultural competence described here is applicable only under the assumption that knowing a person's personally held norm provides information about how they are likely to behave. When most people's guesses of in-group norms are highly inaccurate, pluralistic ignorance is possible and this assumption may not hold. In such cases, the measure described here should be used with caution.
The goal of the present exploratory study is to demonstrate the applicability of the above measure by using it to characterize patterns of cross-cultural competence in an indigenous Matsigenka community and neighboring communities of Mestizo colonists in Amazonian Peru. Results of the quantitative analysis are checked against ethnographic observations in these communities, and discussed in light of long-term consequences for the maintenance or loss of group-typical cultural norms. This empirical examination of cross-cultural competence sheds light on the understudied, and important, role it may play in human cultural dynamics, and perhaps those of other cultural species.
Methods
Overview
An interview comprising fourteen ethnographically informed vignette questions (Table 1) measured personally held cultural norms across a range of interaction domains among adult residents of a Matsigenka community and neighboring Mestizo communities. A subset of these interviewees was then asked to guess the most common personally held norm (i.e. the response of a randomly chosen member) in their own ethnic group (in-group) and in the other ethnic group (out-group) for each vignette question, similar to previous methods for measuring inter-group perceptions (Medin et al. Reference Medin, Ross, Cox and Atran2007; Gurven et al. Reference Gurven, Zanolini and Schniter2008). Based on ethnographic observations collected over a year (Matsigenka) and five months (Mestizos) of participation in community life, domains of salient inter-ethnic interaction (e.g. education, labor) were identified and interviewees’ self-reported experience in each domain was recorded. To distinguish among the associations between these inter-ethnic experiences and cross-cultural competence, data were analyzed using Bayesian estimation of item–response theory (IRT) models (Bunce and McElreath Reference Bunce and McElreath2017), which resulted in posterior distributions (i.e. model estimates with associated uncertainties) of the probabilities of holding particular norms and guessing the most common norms held by in-group and out-group members, for each experience type. Using the procedure illustrated in Figure 1, the degree and form of cross-cultural competence associated with each inter-ethnic experience type were then compared.
Vignette questions administered in this study, and their respective social contexts. Column four contains the response arbitrarily coded as 1 (positive). An alternative response was coded as 0. The number of Matsigenka and Mestizo interviewees answering each question is indicated in column 5. The upper row corresponds to the number of Matsigenka responses with regard to personally held norms (ego, E), in-group guesses (I) and out-group guesses (O). The lower row contains analogous sample sizes for Mestizos. Further explanation, ethnographic validation, and translations of these questions are provided in Supplementary Appendix A.2

Study population
The study was conducted among residents of the Matsigenka Native Community of Tayakome (adult population 79), located inside Manu National Park, in the department of Madre de Dios, in the lowland Amazonian region of southeastern Peru, and in the Mestizo towns of Boca Manu (adult population ~80) and Atalaya (adult population ~65), located just outside the boundary of the park, in the departments of Madre de Dios and Cusco, respectively (see Figure S1). Detailed descriptions of these communities can be found in Bunce and McElreath (Reference Bunce and McElreath2017), Shepard et. al (Reference Shepard Glenn, Rummenhoeller, Ohl and Yu2010), and Llosa Isenrich and Nieto Degregori (Reference Llosa Isenrich and Nieto Degregori2003). As detailed in Supplementary Appendix A.2, there are salient norm differences between Matsigenka and Mestizos across many domains of life. This population is ideally suited to investigation of cross-cultural competence because, at the time of fieldwork, there was an almost complete absence of mass media exposure to the other ethnic group's cultural norms. This constrained the development of cross-cultural competence to: (a) contexts of personal inter-ethnic experience; and (b) intra-ethnic social learning from those with out-group experience. Such conditions contribute to substantial measurable variation in out-group norm exposure among individuals, which would probably be much less pronounced if norms were learned through mass media.
Personal norm interviews
I lived in Boca Manu for approximately three months (September and November 2012, January 2014), Atalaya for two months (December 2012 and February 2014) and Tayakome for 13 months (January–December 2013, March 2014). Over several rounds of semi-structured interviews, I recorded interviewees’ life histories and recollections of personal inter-ethnic interaction experience. For Matsigenka, domains of such inter-ethnic experience included education, working as wage laborers and commerce, all with Mestizos. For Mestizos, domains included indigenous family members (e.g. adopted children), hiring Matsigenka wage laborers, and living (previously) in a majority-indigenous community. I then designed a set of vignette questions (Table 1) for the purpose of learning about specific norms in nine contexts of social coordination (commerce, wage labor, education, spousal relations, parent–offspring relations, inheritance, fairness, healthcare and religion) and administered these questions privately to 74 (94%) residents of Tayakome (including the Mestizo health technician), 45 (~56%) residents of Boca Manu (including four Matsigenka), and 42 (~65%) residents of Atalaya (including two Matsigenka), all of whom had been previously interviewed regarding life history and inter-ethnic interaction experience. I refer to this round of interviews as Personal Norm interviews, and people's responses during this interview are referred to as their personally held, or ‘ego’, norms. No interviewee self-identified as bi-cultural, i.e. belonging to both Matsigenka and Mestizo ethnic groups (see also Supplementary Appendix A.3.3). Here and in subsequent rounds of interviews, interviewees were selected out of convenience: I interviewed whoever was available and willing during the days I was present in the communities.
Guesses about ingroup and outgroup norms
I wrote, on index cards, the Personal Norm responses to each of the 14 vignette questions provided by a sample of 25 interviewees whose responses were representative of the Matsigenka of Tayakome and 24 interviewees whose responses were representative of the Mestizos of Boca Manu and Atalaya, one card for each interviewee. Figure S3 illustrates the representativeness of the cards for the respective communities.
I then re-interviewed 53 residents of Tayakome (all Matsigenka), 26 residents of Boca Manu (including two Matsigenka) and 24 residents of Atalaya (including two Matsigenka), all of whom had participated in Personal Norm Interviews approximately five months prior (Tayakome), 16 months prior (Boca Manu) or one week prior (Atalaya). Owing to people's work schedules and temporary absences from the communities, I was able to re-interview only a subset of all participants who had previously completed Personal Norm Interviews. I briefly reminded interviewees about the previous Personal Norm Interviews in which I had asked them the 14 vignette questions. I then repeated each question one by one. After each, I asked the interviewee to guess how the majority of people in their own community had answered each question (in-group guess), and how the majority of people in the other ethnically distinct community had answered each question (out-group guess). The out-group for both Mestizo communities of Boca Manu and Atalaya was the Masigenka community of Tayakome. The out-group for Tayakome residents was a generic Mestizo from either Boca Manu or Atalaya. For the four Matsigenka interviewees who resided in Boca Manu and Atalaya, the in-group was Tayakome and the out-group was the Mestizo community in which they lived. Thus, in-group and out-group designations used here reflect the emphasis of this study on self-identified ethnicity and do not necessarily reflect feelings of community-belonging on the part of interviewees.
To motivate serious guesses, after an interviewee had made both an in-group and an out-group guess for a given question, I presented her with the two stacks of index cards upon which Personal Norm responses representative of the Matsigenka and Mestizo communities had been written, and explained how the cards had been generated. The cards were shuffled and presented face-down, and the interviewee was asked to select one card from the Matsigenka stack, and one from the Mestizo stack. After each card was chosen, I compared the answer written on the card for the appropriate question with the interviewee's in-group guess (or out-group guess, as appropriate) for that question. I verbally narrated this comparison and, if the guess corresponded to the answer on the card, I congratulated the interviewee on winning 0.5 Peruvian Nuevos Soles (~US$0.15) for that question. If the guess did not correspond to the answer on the card, I explained that she did not win money for that question. Further description of data collection methodology, as well as translations of vignette questions, are provided in Supplementary Appendix A.2. General characteristics of the participants are provided in Table 2.
Characteristics of the participants in this study. Columns 3 and 4 contain numbers of participants in Personal Norm interviews and Guess (both in-group and out-group) interviews, respectively. For the first four categories, proportions of interviewees per interview type (Personal Norm or Guess) are given in parentheses. For the last two categories, proportions of Matsigenka or Mestizo interviewees (respectively) per interview type are given in parentheses. Note that each individual can have multiple types of experience, so proportions in these last two categories do not sum to 1. Definitions of characteristics, as well as additional details, are provided in Supplementary Appendix A.3.3

Statistical analysis
I fit a series of IRT models (Bafumi et al. Reference Bafumi, Gelman, Park and Kaplan2005; Jackman Reference Jackman2001; Schacht and Grote Reference Schacht and Grote2015; Bunce and McElreath Reference Bunce and McElreath2017; van der Linden Reference van der Linden and van der Linden2016), in a Bayesian framework (McElreath Reference McElreath2016), to interviewees’ Personal Norm (ego) responses, in-group guesses and out-group guesses using the software R (R Core Team 2017) and RStan (Stan Development Team 2018). IRT models are a standard extension of logistic regression, using covariances to construct a representation of individuals’ responses to multiple questions simultaneously (i.e. as positions on a latent axis or axes), as well as characteristics of particular questions, such as their usefulness for discriminating among (i.e. separating) respondents on the latent axis. Responses to the 14 vignette questions for each of the targets (ego, in-group and out-group) co-varied in a single dimension, represented by a latent axis for each target. Models estimated individual-level variance in interviewees’ positions on the three latent target axes (random intercepts), covariance in interviewees’ positions across target axes, covariance in question positions and discriminations within and across target axes, as well as the effects of binary individual-level predictors for inter-ethnic experience in the contexts of education, wage labor worker, wage labor employer, commerce, family and community (see Supplementary Appendix A.3.3). I draw statistical inference from distributions of posterior predictions for the probability of positive responses to the vignette questions (see Table 1) for each target. To represent the inaccuracy of guesses, I calculate Kullback–Leibler (K–L) divergences (Kullback and Leibler Reference Kullback and Leibler1951) between probabilities of ego responses and in-group and out-group guesses for average (randomly chosen) Matsigenka and Mestizo individuals with different types of inter-ethnic experience (Figure 1). K–L divergence is a standard measure of the additional uncertainty generated when using one probability distribution (e.g. probabilities of a positive and negative guess) to approximate another probability distribution (e.g. probabilities of a positive and negative ego response), and is calculated in units of information entropy (McElreath Reference McElreath2016). Note that this measure of guess inaccuracy applies only in the aggregate, and is not a measure of the inaccuracy of guesses made by individual participants. For instance, the out-group guesses of individual Matsigenka participants are used together to calculate the probability that a randomly chosen Matsigenka would guess that a randomly chosen Mestizo would give the positive response to a given question. The inaccuracy of Matsigenka guesses, in the aggregate, is calculated by comparing this probability with the actual probability that a randomly chosen Mestizo participant would give the positive response. Because each participant provided only one guess per condition (in-group or out-group) per question, it is not possible to calculate such probabilities, and thus inaccuracies, at the individual level. For all analyses, Mestizo residents of Boca Manu and Atalaya are grouped together in the category Mestizos, as the distributions of responses in these two communities are similar (Figure S3). Further details of analysis, including IRT model definitions and priors, K–L divergence calculations and links to data and analysis scripts are provided in Supplementary Appendix A.3.
Research ethics
I obtained informed consent from all study participants under University of California, Davis IRB 226284-2, and I presented and discussed results during assemblies in each study community prior to publication. Permission to conduct research inside Manu National Park was provided by the Peruvian Servicio Nacional de Areas Naturales Protegidas (SERNANP), with permit numbers 23-2012-SERNANP-PNM-JEF and 23-2013-SERNANP-PNM-JEF.
Results
General response characteristics
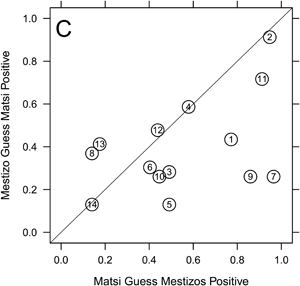
Figure 2a and the first column of Figure 3 show that Matsigenka and Mestizo participants tended to answer the 14 vignette questions in different ways. For all questions, a larger proportion of Matsigenka than Mestizos gave the response that was arbitrarily coded as positive. This suggests that Matsigenka and Mestizo participants tend to differ in the norms that they personally hold. For example, question 9 dealt with a norm for how to fairly divide an inheritance consisting of two pots among two daughters. One daughter already has her own two pots, while the other has none. Some 68% of Mestizos responded that each daughter should receive one pot, with a typical justification being ‘so that they don't fight’. In contrast, 75% of Matsigenka responded that both pots should go to the daughter who has none, with a typical justification being that ‘the other one already has pots’. Supplementary Appendix A.2 provides ethnographic descriptions of the norms that I attempted to illustrate with each question, as well as typical participants’ justifications for their responses. Figures 2b and c and S9 show that Matsigenka and Mestizo participants tended to guess more accurately about norms personally held by their co-ethnics than about norms held by members of the respective out-group.
Raw proportions of personally held norms, and in-group and out-group guesses. Proportions of interviewees giving the positive response to the 14 vignette questions in Table 1 are plotted. The diagonal is the line of equal proportions between Matsigenka and Mestizos. The vertical (or horizontal) distance from a point to the diagonal is the difference in proportion between ethnic groups. (a) Personal (ego) Norms for Matsigenka (n = 79) and Mestizos (n = 82). Note that, for all questions, a larger proportion of Matsigenka than Mestizos gave positive responses, i.e. all points fall above the diagonal. (b) In-group guesses for Matsigenka (n = 57) and Mestizos (n = 46). Proportions of interviewees who guessed that most members of their in-group gave the positive response to a given question are plotted. Note that if in-group guesses were perfectly accurate in the aggregate for this sample (see Methods: Statistical Analysis), plots (a) and (b) would be identical. (c) Out-group guesses for Matsigenka (n = 57) and Mestizos (n = 46). Proportions of interviewees who guessed that most members of the out-group gave the positive response to a given question are plotted. Note that if out-group guesses were perfectly accurate in the aggregate for this sample, plots (a) and (c) would be identical.

Personally held norms and inaccuracy of in-group and out-group guesses. The four rows of (a) refer to counterfactual (McElreath Reference McElreath2016) (i.e. model estimates of hypothetical) Matsigenka who have interaction experience with Mestizos in only one of the respective domains of education, wage labor or commerce, or none of the three previous domains. Analogously, the four rows of (b) refer to counterfactual Mestizos who have experience in only one of the respective domains of living in an indigenous community, employing indigenous Matsigenka or living in a household with indigenous people, or none of the three previous domains (Supplementary Appendix A.3.3). Left column: posterior distributions (i.e. model estimates with associated uncertainties) of mean probabilities of a positive personally held norm response across all 14 vignette questions (Table 1). Center column: posterior distributions of mean inaccuracy of out-group guesses (calculated as in Figure 1b). Right column: posterior distributions of mean inaccuracy of in-group guesses. Posterior distributions are derived from IRT models (A, m11; and B, m19 in Tables S1 and S2). The 90% highest posterior density intervals (HPDI) are shown in grey.

There was little evidence of strong pluralistic ignorance among participants for the norms of interest. Inaccuracies of in-group guesses were generally low (see Figure S9), which increases confidence in the appropriateness of the measure of cross-cultural confidence developed here. The most inaccurate in-group guesses are associated with Mestizos on question 5. A randomly chosen Mestizo participant has a 0.37 probability of expressing a personal norm for the corporal punishment of under-performing students, but only a 0.04 probability of guessing that this norm is held by a randomly chosen co-ethnic (compare question 5 on the Mestizo axes in Figure 2a and b). A potential cause of this discrepancy is discussed in Supplementary Appendix B.1.6.
Cross-cultural competence
In general, Matsigenka tend to make less accurate out-group guesses and more accurate in-group guesses than Mestizos (compare columns 2 and 3 of Figure 3, and see also Supplementary Figures S2, S9, S10 and S13). Thus, by the above definition of cross-cultural competence, it is not possible to make a general claim that one ethnic group is more cross-culturally competent than the other. Figure S9 shows that these results are driven by particularly inaccurate Matsigenka out-group guesses in the domain of healthcare, and particularly inaccurate Mestizo in-group guesses in the domain of education. This finding is discussed in more detail in Supplementary Appendix B.1.6, and its implications for Fiske's (Reference Fiske1993) theory of stereotyping and group-level power differences are explored in Supplementary Appendix B.1.7.
For Matsigenka, Figures 3a and 4a show that education experience with Mestizos, in the absence of and relative to other types of inter-ethnic experience, tends to be associated with: (a) holding cultural norms more similar to those of an average Mestizo; (b) lower inaccuracy when guessing about the norms of Mestizos (particularly compared to no inter-ethnic experience); and (c) comparable inaccuracy when guessing about the norms of co-ethnics (see also Figures S11, S12, S14 and S15). Thus, for Matsigenka, education experience tends to be associated with higher levels of cross-cultural competence. Figure S14 shows that this is due to relatively more accurate guesses about Mestizo norms in the domains of education, healthcare and fairness.
Contrasts (differences) of mean guess inaccuracy. (a) Above diagonal: each cell contains the contrast (row minus column) of the posterior distributions for the mean inaccurary of out-group guesses by counterfactual Matsigenka with each experience type in Figure 3a. Distributions to the right of 0 indicate that the row experience type tended to make more inaccurate guesses than the column experience type. Distributions to the left of 0 indicate the opposite. Distributions around 0 indicate no detectable differences in guess inaccuracy between experience types. (a) Below diagonal: analogous contrasts for Matsigenka mean in-group guess inaccuracies. (b) Analogous contrasts for Mestizo mean out-group (above diagonal) and in-group (below diagonal) guess inaccuracies. The 90% HPDI are shown in grey.

For Mestizos, Figures 3b and 4b show that the experience of living in an indigenous community, in the absence of and relative to other types of inter-ethnic experience, is associated with holding norms more similar to those of an average Matsigenka. This experience, as well as that of employing Matsigenka wage laborers, tends to be associated with: (a) lower inaccuracy when guessing about the norms of Matsigenka, compared with no inter-ethnic experience or indigenous family experience; and (b) comparable inaccuracy when guessing about the norms of co-ethnics (see also Figures S11, S12, S16–S19). Thus, for Mestizos, community experience and employer experience, although each associated with holding different norms, both tend to be associated with higher levels of cross-cultural competence. Figures S16 and S18 show that this is due to relatively more accurate guesses about Matsigenka and Mestizo norms in the domains of education, healthcare, fairness and labor. Additional aspects of these results, including comparisons of variance in responses and implications of ethnic differences in power, are presented and discussed in Supplementary Appendix B.1.
Ethnographic interpretation
Ethnographic evidence suggests that Matsigenka students acquire certain Mestizo-typical norms while attending Mestizo-run boarding schools, partly as a consequence of their low bargaining power in student–teacher coordination occurring exclusively with Mestizos (Bunce and McElreath Reference Bunce and McElreath2017). Cross-cultural competence probably results from learning that such norms are common among Mestizos, yet not forgetting that alternative norms are common among their fellow Matsigenka. An analogous process is plausible for Mestizos who live temporarily as minorities in indigenous communities (see Supplementary Appendix B.1.8). In contrast, Mestizos who employ Matsigenka wage laborers (e.g. in agriculture, logging, and tourism) usually also employ at least as many Mestizos for the same jobs. The frequent shortage of labor in this region increases laborers’ bargaining power relative to employers (Bunce and McElreath Reference Bunce and McElreath2017). Thus, cross-cultural competence of employers (e.g. in domains of labor, fairness and healthcare) facilitates good relations with a wider range of potential laborers, yet there is little incentive for employers to personally adopt Matsigenka-typical norms, as interactions in this domain with their fellow Mestizos are at least as important. Such accommodation of perceived Matsigenka-typical norms is illustrated in the words of a Mestizo who routinely contracted both Matsigenka and Mestizo field hands: ‘[Matsigenka] work well, but I let them work in their own way, because their world is different. A type of person like us [Mestizos] already knows how this kind of work is. [We] work until late, [and are] more demanding. But a Machi [recte Matsigenka], when you bring him [to the agricultural field], you let him work in his own way. If he wants to leave, then we leave. If he wants to go for a little while because he is tired, I let him … If I say something to them, like demanding that they do something, they get angry and they leave you, just like that’ (Bunce and McElreath Reference Bunce and McElreath2017).
Discussion
As shown, cross-cultural competence may develop in individuals who retain personal norms typical of their co-ethnics, such that knowledge of out-group norms is added in a supplementary capacity to the norms that they personally hold (e.g. Mestizo employers of Matsigenka). For convenience, I refer to this as the ‘supplement’ path to cross-cultural competence. Alternatively, cross-cultural competence may be a side effect of the process of adopting out-group norms, such that these new norms replace in-group-typical norms as those that individuals personally hold (e.g. Matsigenka educated among Mestizos). I refer to this as the ‘replacement’ path. The ethnographic evidence above suggests that the path taken may be a function of the frequency of intra- and inter-ethnic coordination interactions and the balance of bargaining power during such interactions. Other factors may also contribute. For instance, the desire both to maintain an ethnic identity closely linked to a suite of cultural norms, while also engaging with members of an ethnically distinct group, may facilitate the supplement path to cross-cultural competence (e.g. integration of immigrants: Berry Reference Berry1997). In contrast, if ethnic groups exhibit salient differences in subjectively perceived success or prestige, cultural norms of the more prestigious group may be personally adopted by members of the other, regardless of the frequency of direct inter-group interaction (success-biased inter-ethnic social learning; Bunce and McElreath Reference Bunce and McElreath2017), facilitating the replacement path.
The two paths to cross-cultural competence suggested here parallel two paths to bilingualism proposed by Lambert (Reference Lambert1981): additive bilingualism occurs when two languages learned by an individual have comparable social value and respect. The second language is learned in order to supplement, rather than replace, the first. In contrast, subtractive bilingualism results from social pressure on individuals to reject their native language in favor of a more prestigious second language. Subtractive bilingualism constitutes a transition state from a low- to a high-status language, and, as such, would be expected to result in the eventual loss of language diversity in a population (Kandler Reference Kandler2009).
Multiethnic societies are often characterized by a high prevalence or prominence of cross-culturally competent individuals (Wise and Velayutham Reference Wise and Velayutham2014). However, the long-term sustainability of extant cultural diversity in such societies seems doubtful if one ethnic group becomes cross-culturally competent as a consequence of adopting personally held out-group norms. Similar to subtractive bilingualism, this replacement path to cross-cultural competence may contribute to the loss of cultural diversity, as it can facilitate the invasion of a group by out-group-typical norms (see Supplementary Appendix B.2). Inversely, the scope for sustainability may be wider if the supplement path is followed, such that cross-cultural competence is achieved while retaining personally held in-group norms.
Supplementary Appendix B.2 outlines theoretical support for this latter prediction. The argument depends on cross-culturally competent individuals receiving a benefit to inter-ethnic coordination interactions that outweighs the benefit to such interactions received by non-cross-culturally competent individuals. Under such conditions, the supplement path to cross-cultural competence could facilitate stable states of a population where cultural norms typical of each group are present. Whether these conditions are sufficient, and relevant in the real world, awaits further theoretical and empirical investigation. However, if shown to be widely applicable across populations, this finding suggests that immigration-induced inter-ethnic engagement following the supplement path to cross-cultural competence may, in theory, result in neither the inevitable loss nor dilution of either host-nation or immigrant cultural norms within their respective communities. Consequently, the two paths to cross-cultural competence suggested here have potentially important implications for our understanding of cultural dynamics in humans, and perhaps other species that use horizontal social learning to acquire group-specific coordination behavior (e.g. Cebus: Perry et al. Reference Perry, Baker, Fedigan, Gros-Louis, Jack, MacKinnon, Manson, Panger, Pyle and Rose2003).
It is important to emphasize the tentative nature of the above proposals regarding paths for the individual-level development of cross-cultural competence, and the population-level implications of these paths for the long-term sustainability or loss of cultural norms. A rigorous empirical study of individual development or cultural dynamics requires a longitudinal research design, preferably replicated in multiple societies. The primary contribution of the present cross-sectional study is methodological: I present a simple field data collection technique that can be used to construct a quantifiable proxy of two forms of cross-cultural competence, and a statistical method to compare people's interaction experiences on the basis of this measure. These tools facilitate future longitudinal cross-cultural work.
Acknowledgements
I thank participants in Tayakome, Boca Manu, and Atalaya. N. Oyeyoyeyo, R. Chiqueti and family, C. Huamantupa, J. Poma and family, V. Chávez, C. Flores, F. Rayan, and the Cocha Cashu Biological Station, N. Santullo, C. Matos, and Rainforest Flow, J. Flores, N. Anaya, and the Servicio Nacional de Áreas Naturales Protegidas por el Estado del Perú, O. Espinosa and the Pontificia Universidad Católica del Perú, P. Alvarez, M. Minaya, O. Revilla, N. Revilla, G. Lugon, and C. Revilla provided support with permits and fieldwork. R. McElreath, C. Ross, and B. Beheim provided advice on statistical models and code. A. Kandler, B. Purzycki, D. Lukas, B. Beheim, C. Ross, L. Benoit, G. Shepard, D. Yu, C. Revilla, members of the Department of Human Behavior, Ecology, and Culture at the Max Planck Institute for Evolutionary Anthropology, and several anonymous reviewers provided valuable comments and criticism on earlier versions of this paper. All errors are mine.
Author contributions
J.A.B. designed and conducted the research and wrote the paper.
Financial support
This research was supported by the US National Science Foundation (grant number BCS 1227152) and the Max Planck Society.
Publishing ethics
The manuscript is J.A.B.’s own original work, and does not duplicate any other previously published work; The manuscript has been submitted only to Human Evolutionary Sciences – it is not under consideration, accepted for publication or in press elsewhere. It is posted on the pre-print server SOCARXIV here: https://osf.io/preprints/socarxiv/468ns
Conflicts of interest
J.A.B. declares no conflict of interest.
Ethical standards
J.A.B. asserts that all procedures contributing to this work comply with the ethical standards of the relevant national and institutional committees on human experimentation and with the Helsinki Declaration of 1975, as revised in 2008.
Research transparency and reproducibility
Data and code in R and Stan to reproduce the analysis in the main text and the Supplementary Materials are available on Github at https://github.com/jabunce/bunce-2018-cross-cultural-competence.
Supplementary material
The supplementary material for this article can be found at https://doi.org/10.1017/ehs.2020.1.


 Open access