


1. Introduction
The recession of calving glaciers often results in glacier fragmentation. This involves the detachment of a tributary glacier from the main glacier trunk, which subsequently splits into smaller units (Jiskoot and others, Reference Jiskoot, Curran, Tessler and Shenton2009; Jiskoot and Mueller, Reference Jiskoot and Mueller2012; Davies and others, Reference Davies2022). To date, previous studies on glacier fragmentation have mainly focused on ice sheets in Antarctica (Rott and others, Reference Rott and Rack2002; Scambos and others, Reference Scambos, Bohlander, Shuman and Skvarca2004; Chandler and others, Reference Chandler2018; Benn and others, Reference Benn2022), whereas our understanding of fragmentation processes in other glaciated regions remains limited. It is crucial to monitor these changes, as glacier fragmentation can result in the separation of accumulation areas from ablation areas, leading to a sudden increase in mass loss rates (Jiskoot and Mueller, Reference Jiskoot and Mueller2012). This is a particularly critical issue in the context of present-day climate change scenarios (Davies and others, Reference Davies2022; Van Wyk de Vries and others, Reference Van Wyk de Vries, Romero, Penprase, Ng and Wickert2023). Furthermore, there are the potential impact on downstream regions, such as newly induced glacier-related hazards such as glacial lake outburst floods, lake-tsunamis and landslides driven by glacier retreat (Kargel and others, Reference Kargel2005; Hulbe and others, Reference Hulbe, Scambos, Youngberg and Lamb2008; Orlove and others, Reference Orlove, Wiegandt and Luckman2008; Moragues and others, Reference Moragues, Lenzano, Rivera, Oberreuter and Vich2021).
The Southern Patagonian Icefield (SPI) is the largest glacierized area in the Southern Hemisphere outside Antarctica, with an area of 12 231 ± 201 km2 in 2016 (Meier and others, Reference Meier, Grießinger, Hochreuther and Braun2018). The icefield is drained by outlet glaciers, most of which terminate in lacustrine or marine calving settings (Fig. 1a). Driven by frontal ablation, glaciers in the SPI have retreated and lost mass rapidly in recent decades (e.g. Davies and Glasser, Reference Davies and Glasser2012; Malz and others, Reference Malz2018; McDonnell and others, Reference McDonnell, Rupper and Forster2022). The recession of Upsala glacier has accounted for 21% of total mass loss experienced by SPI glaciers since 2000 (Minowa and others, Reference Minowa, Schaefer, Sugiyama, Sakakibara and Skvarca2021). In May 2011, after rapid and sustained retreat between 2008 and 2010, the terminus of Upsala Glacier reached the confluence zone between the main (western) glacier trunk and the Bertacchi tributary (Sakakibara and others, Reference Sakakibara, Sugiyama, Sawagaki, Marinsek and Skvarca2013; Sakakibara and Sugiyama, Reference Sakakibara and Sugiyama2014; Minowa and others, Reference Minowa, Schaefer and Skvarca2023). Previous studies suggest that increases in surface velocity and retreat rates were caused by the calving front moving into a basal overdeepening (Sakakibara and others, Reference Sakakibara, Sugiyama, Sawagaki, Marinsek and Skvarca2013; Minowa and others, Reference Minowa, Schaefer and Skvarca2023). Typically, the low effective pressure found at an overdeepening of the glacier bed increases glacier buoyancy, increasing surface velocities and leading to increased retreat rates (Post and others, Reference Post, O'Neel, Motyka and Streveler2011; Bown and others, Reference Bown2019). Recent studies carried out by Millan and others (Reference Millan, Mouginot, Rabatel and Morlighem2022) and Lannutti and others (Reference Lannutti2024) revealed an overdeepening in the confluence zone between the Bertacchi tributary and the main trunk (Fig. 1e), which was suggested by Sakakibara and others (Reference Sakakibara, Sugiyama, Sawagaki, Marinsek and Skvarca2013). However, the terminus of the Upsala main trunk remained stable when the glacier terminus was situated over this area of greater water depth (Minowa and others, Reference Minowa, Schaefer, Sugiyama, Sakakibara and Skvarca2021).
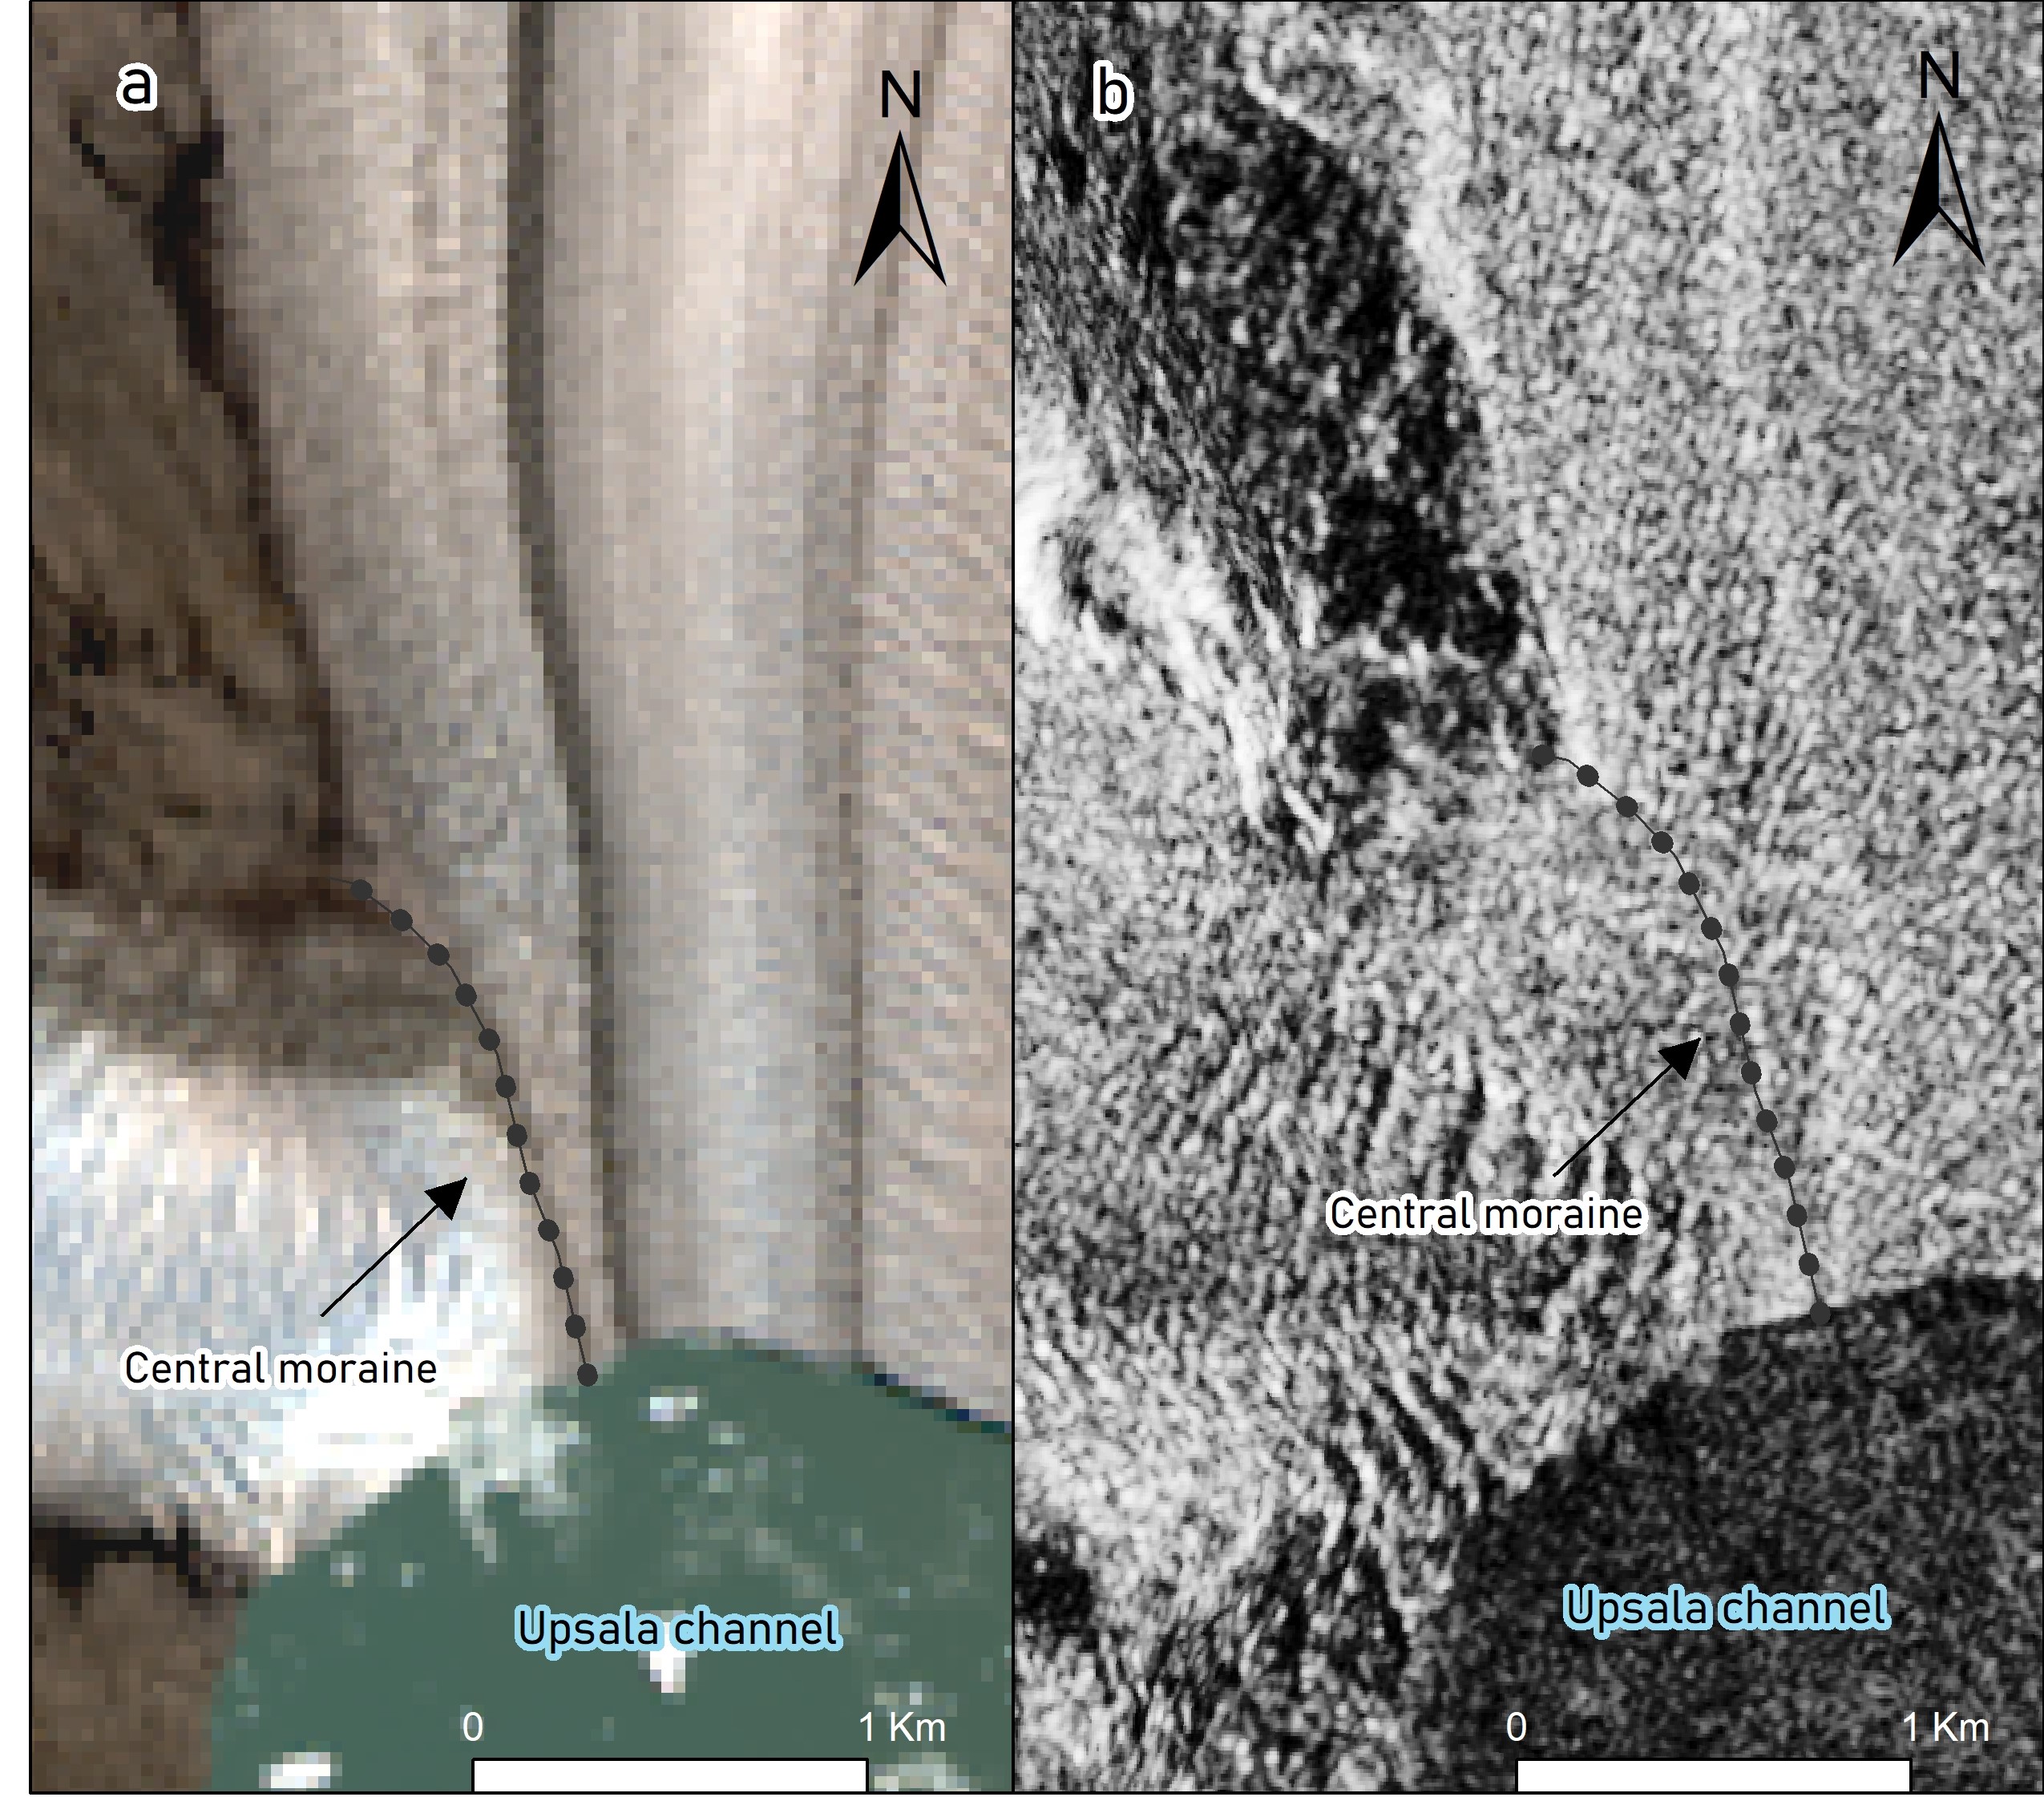
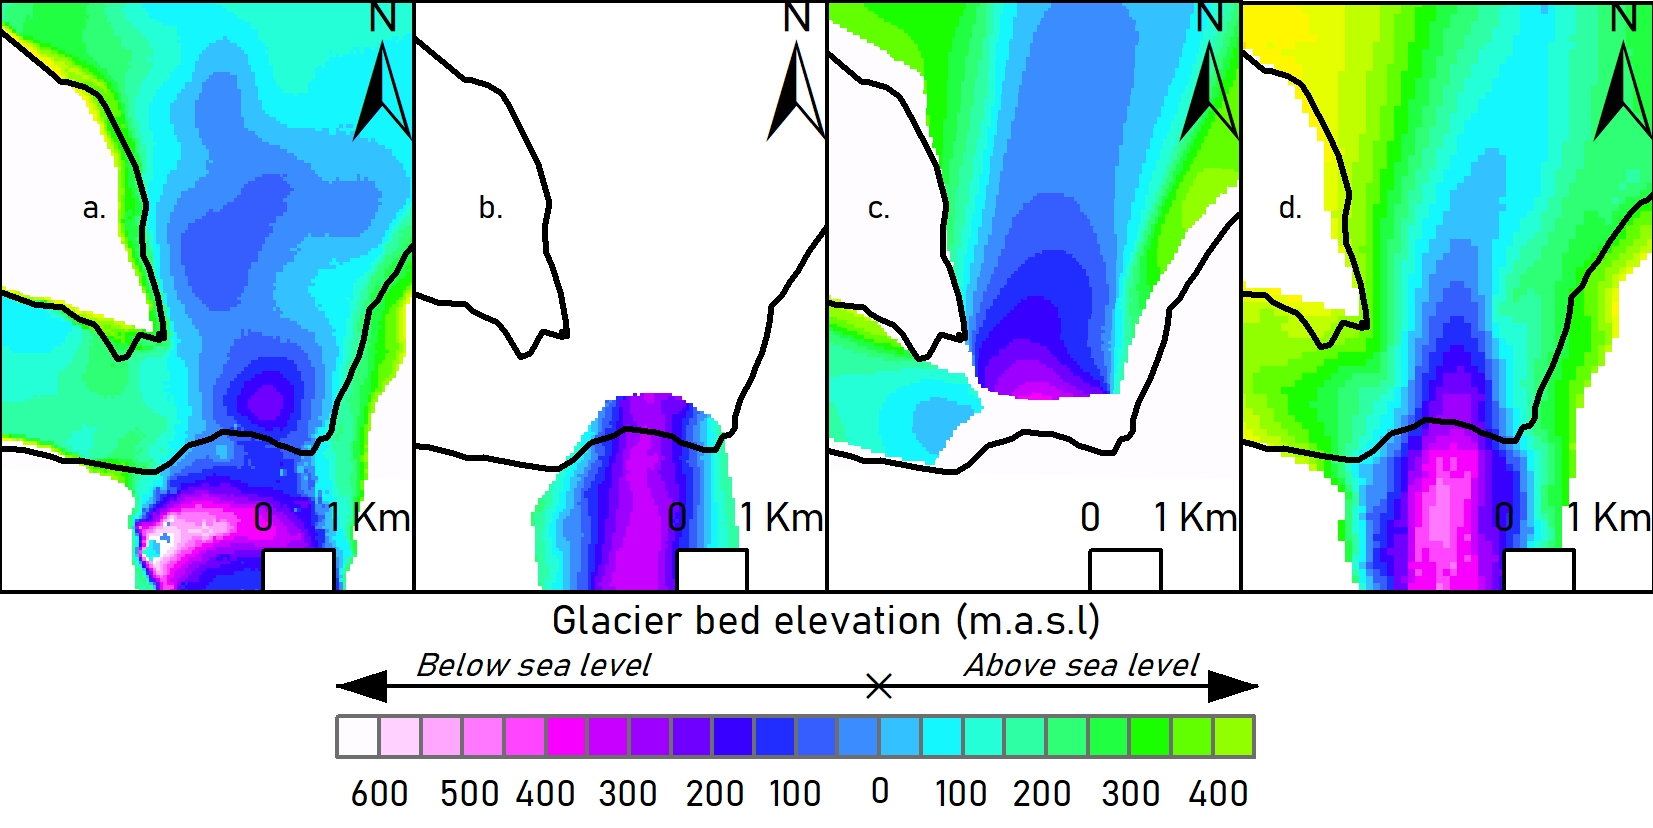
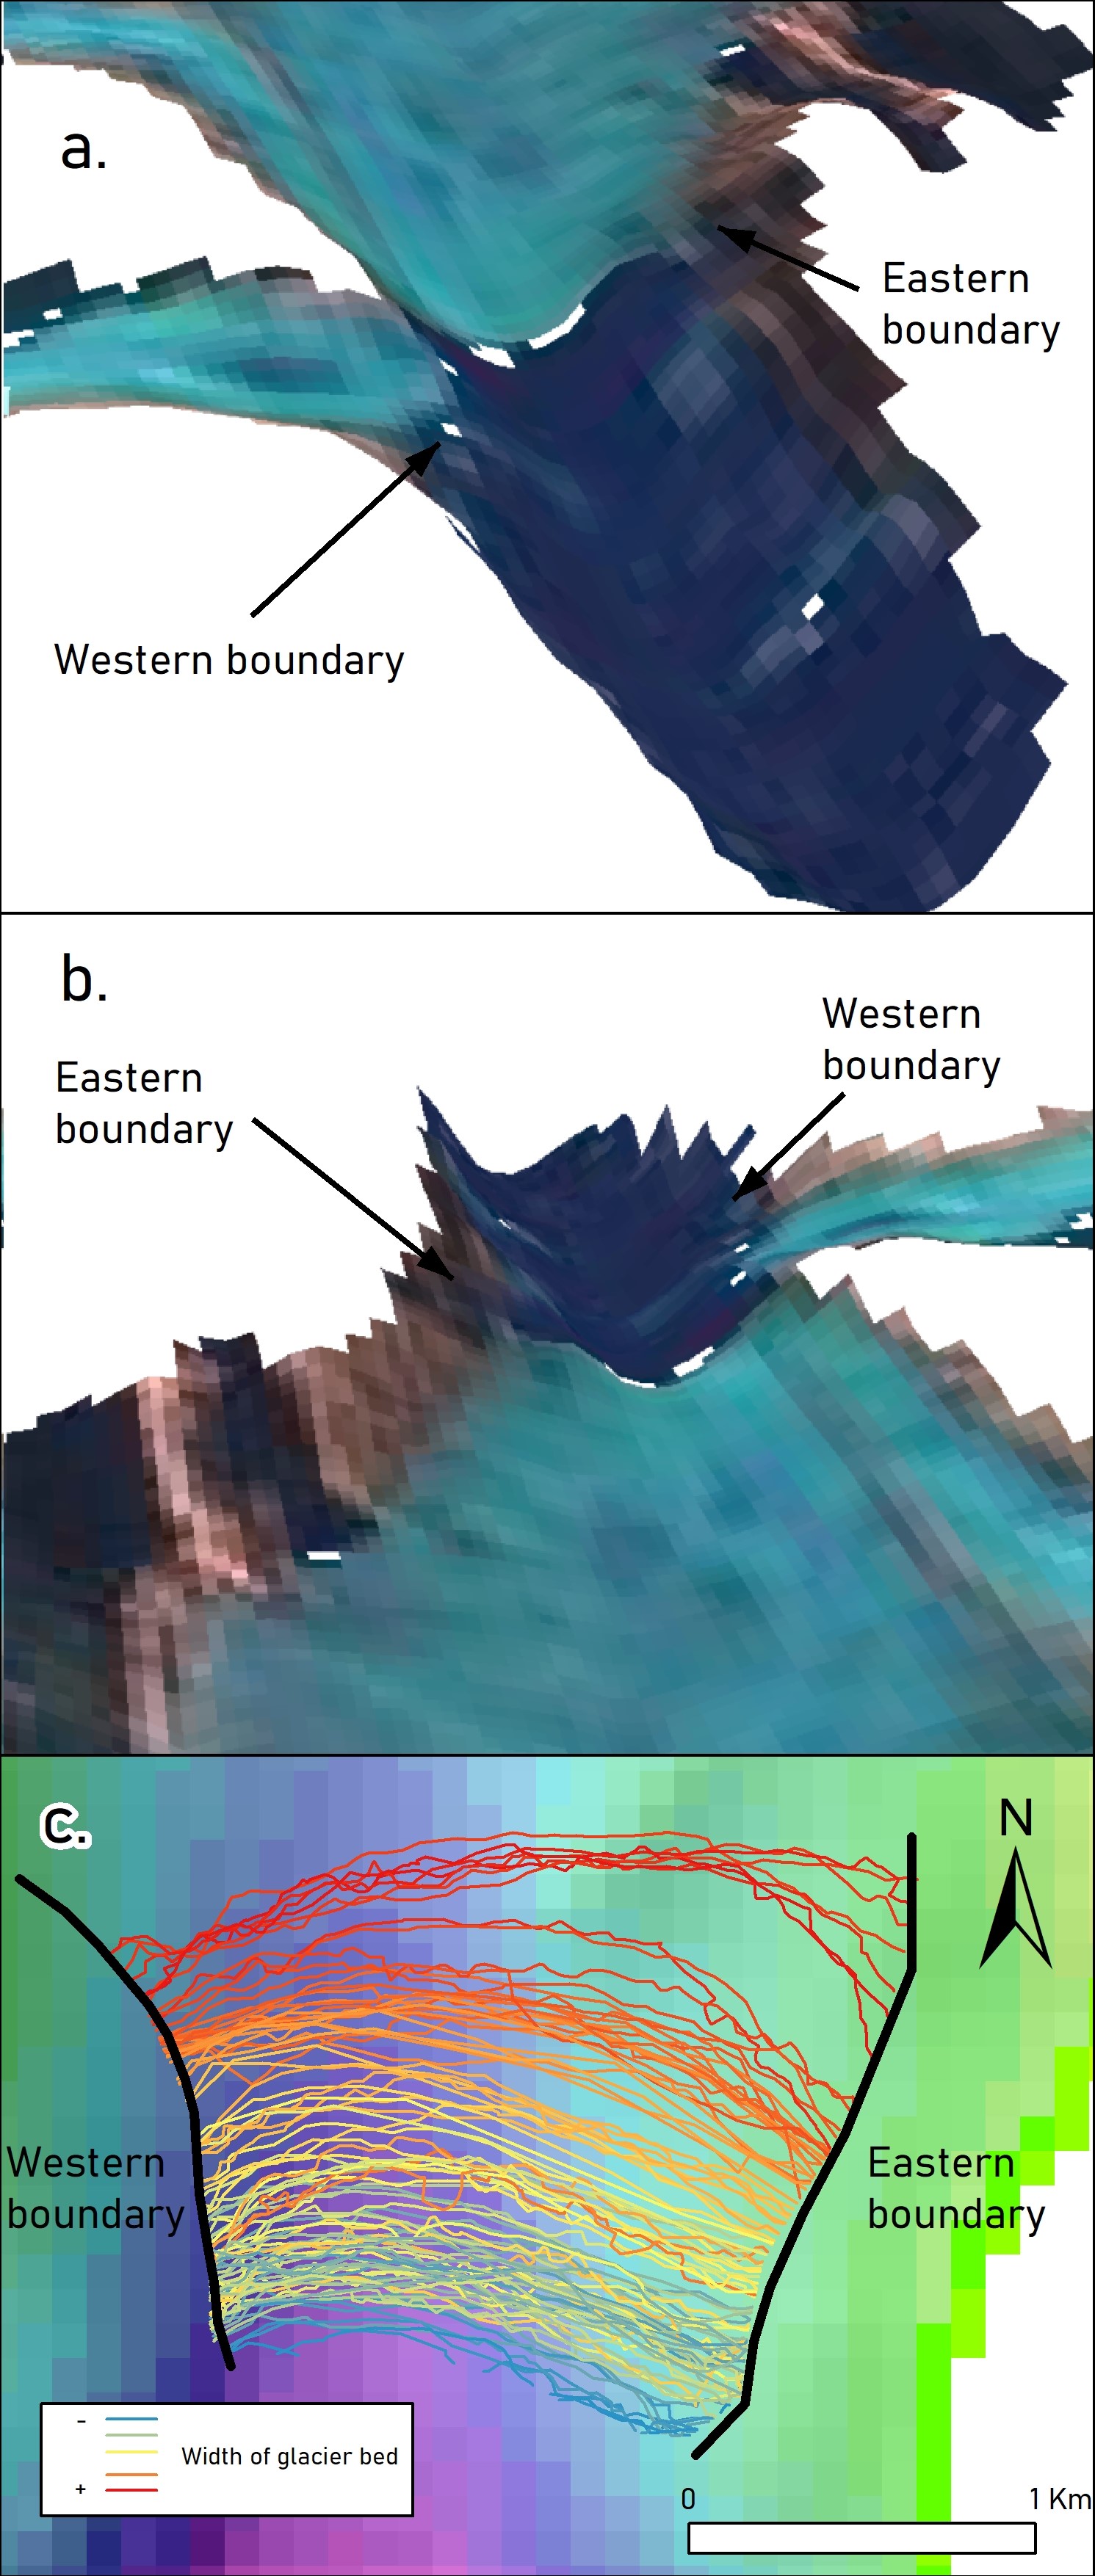
Geographic setting of Upsala Glacier, showing the Southern Patagonian Icefield (SPI), Upsala Glacier (UG), and the Viedma and Argentino proglacial lakes (VL and AL respectively) (a). Panel (b) shows the outline of Upsala Glacier (and sub-basins) in January 2015 and the longitudinal profiles used to analyze surface velocities and frontal position changes. Detailed view of the confluence zone between the Bertacchi and western Upsala termini (c). The distance between the central moraines serves as a reference to illustrate the compression of the ice flow over the glacier confluence zone. The background image is an RGB true color Landsat 8 composite from 14 January 2015. The panoramic view in panel (d) shows the confluence area between the Bertacchi and western termini in April 2016. (e) Glacier bed elevations along the 2 km lowest of the western (e) and Bertacchi (f) profiles shown in panel (b).

The analyses of short-term glacier changes around the SPI are complicated by their remote nature and size, which makes in situ observation challenging (Naruse and others, Reference Naruse, Skvarca, Kadota and Koizumi1992b; Skvarca and others, Reference Skvarca, Satow, Naruse and Leiva1995; Minowa and others, Reference Minowa, Schaefer, Sugiyama, Sakakibara and Skvarca2021). As a result, investigations of glacier dynamics derived from remotely sensed data have become increasingly frequent to monitor the evolution of the glaciers in the region (e.g. Skvarca and others, Reference Skvarca, Raup and De Angelis2003; Sakakibara and others, Reference Sakakibara, Sugiyama, Sawagaki, Marinsek and Skvarca2013; Mouginot and Rignot, Reference Mouginot and Rignot2015; Jaber, Reference Jaber2016; Moragues and others, Reference Moragues, Lenzano, Lo Vecchio, Falaschi and Lenzano2018). Persistent cloud cover over the SPI drastically reduces the potential for optical imaging (Lo Vecchio and others, Reference Lo Vecchio2018). In this regard, synthetic aperture radar (SAR) imagery has been increasingly used over the last decade, as data can be acquired largely independent of weather conditions compared to optical sensors (Rott and others, Reference Rott, Stuefer, Siegel, Skvarca and Eckstaller1998; Ciappa and others, Reference Ciappa, Pietranera and Battazza2010; Casu and others, Reference Casu, Manconi, Pepe and Lanari2011; Euillades and others, Reference Euillades2016; Vijay and others, Reference Vijay2019; Benn and others, Reference Benn2022; Berthier and others, Reference Berthier2023). The public availability of SAR imagery (e.g. Sentinel-1, since April 2014) has thus allowed for improved monitoring of short-term changes in cloudy glacierized regions such as the SPI (Luckman and others, Reference Luckman2015; Nagler and others, Reference Nagler, Rott, Hetzenecker, Wuite and Potin2015; Lemos and others, Reference Lemos2018; Lei and others, Reference Lei, Gardner and Agram2021a, Reference Lei, Gardner and Agram2021b, Reference Lei, Gardner and Agram2022; Strozzi and others, Reference Strozzi, Wiesmann, Kääb, Schellenberger and Paul2022).
In this study, we focus on the changes in glacier dynamics during the fragmentation and separation of the main trunk of Upsala Glacier from the Bertacchi tributary. We analyze short-term changes in frontal positions and surface velocities at the confluence area using a temporally well-resolved Sentinel-1 SAR data compilation covering the period between January 2015 and January 2023, and discuss the observed changes in the context of bed topography and ice thickness.
1.1. Upsala Glacier
Upsala Glacier (49.88°S; 73.28°W) is one of the largest calving glaciers (~645 km2 in July 2022) of the SPI (Fig. 1a). The medial moraine of Upsala Glacier divides the main glacier trunk into two parts. The eastern part of the glacier is fed by ice flowing from the area south of the Upsala–Viedma divide, while the western part is currently fed by the Cono, Murallón and Olezza tributaries (Fig. 1b). Prior to fragmentation, the Bertacchi tributary was the main ice source for the western part of Upsala Glacier (Aniya and Skvarca, Reference Aniya and Skvarca1992). The western terminus calves into the ~600 m deep Upsala channel (Fig. 1e) (Sugiyama and others, Reference Sugiyama2016; Moragues and others, Reference Moragues, Lenzano, Rivera, Oberreuter and Vich2021; Minowa and others, Reference Minowa, Schaefer and Skvarca2023).
The western terminus of Upsala Glacier is close to the critical buoyancy thickness (Warren and others, Reference Warren, Greene and Glasser1995; Naruse and Skvarca, Reference Naruse and Skvarca2000; Skvarca and others, Reference Skvarca, Raup and De Angelis2003; Minowa and others, Reference Minowa, Schaefer and Skvarca2023; Lannutti and others, Reference Lannutti2024). This is an important feature, as increased buoyancy at the terminus of lake-terminating glaciers (such as Upsala) promotes flow acceleration and decoupling from the glacier bed, which in turn lead to buoyant calving and rapid ice loss (Sakakibara and others, Reference Sakakibara, Sugiyama, Sawagaki, Marinsek and Skvarca2013). Indeed, Upsala Glacier has been losing mass at a rate of 2.2 Gt a−1 since 1979 (McDonnell and others, Reference McDonnell, Rupper and Forster2022; Vacaflor and others, Reference Vacaflor, Lenzano, Vich and Lenzano2022), the highest mass loss rate among calving glaciers in the SPI over the last two decades (Minowa and others, Reference Minowa, Schaefer, Sugiyama, Sakakibara and Skvarca2021). Before the Upsala Glacier front reached the confluence zone in February 2011, the glacier transitioned from a relatively stable phase to a rapidly retreating and fast-flowing state throughout the 2000–2011 period. The glacier surface velocity increased by 20–50%, the mean surface lowering rate was 29.5 m a−1, and the front retreated by 2.9 km between 2008 and 2011 (Sakakibara and others, Reference Sakakibara, Sugiyama, Sawagaki, Marinsek and Skvarca2013; Minowa and others, Reference Minowa, Schaefer and Skvarca2023).
2. Data and methods
2.1 Glacier surface velocity
Estimation of surface velocities near the terminus of fast-flowing calving glaciers such as Upsala through in situ surveys (e.g. GNSS) is challenging due to the high rates of surface deformation and crevasse formation (Naruse and others, Reference Naruse, Fukami and Aniya1992a; Skvarca and others, Reference Skvarca, Satow, Naruse and Leiva1995; Minowa and others, Reference Minowa, Schaefer, Sugiyama, Sakakibara and Skvarca2021), as well as logistical and safety concerns. In this context, remote sensing provides a unique opportunity to estimate remote glacier velocities (Berthier and others, Reference Berthier2023).
Among various methodologies, intensity cross-correlation-based offset tracking techniques applied to two SAR satellite images acquired at different times can be used to track glacier surface features, such as crevasses and debris cover to measure surface displacement (Scambos and others, Reference Scambos, Dutkiewicz, Wilson and Bindschadler1992; Strozzi and others, Reference Strozzi, Luckman, Murray, Wegmüller and Werner2002, Reference Strozzi, Wiesmann, Kääb, Schellenberger and Paul2022). In recent times, the development of offset-tracking algorithms to derive glacier surface displacements has led to the automation of image processing (Gray and others, Reference Gray2015; Nagler and others, Reference Nagler, Rott, Hetzenecker, Wuite and Potin2015; Strozzi and others, Reference Strozzi, Wiesmann, Kääb, Schellenberger and Paul2022). Among these efforts, the NASA MEaSUREs project Inter-mission Time Series of Land Ice Velocity and Elevation (ITS_LIVE V2) delivers ice surface velocity products with global coverage using temporally dense time series of multi-sensor observations from both SAR (Sentinel-1) and optical (Landsat TM, ETM + , OLI and Sentinel-2) satellite data (Gardner and others, Reference Gardner, Fahnestock and Scambos2019; Friedl and others, Reference Friedl, Seehaus and Braun2021). ITS_LIVE products are available from 2016 onwards, with a larger number of products starting in 2017. A similar product has also been released by Friedrich Alexander University (FAU), which is generated using SAR Sentinel-1 scenes only (Lei and others, Reference Lei, Gardner and Agram2022), covering the 2015–2021 period. Both datasets provide regularly updated velocity fields for all glaciers in the Randolph Glacier Inventory (Gardner and others, Reference Gardner, Fahnestock and Scambos2019; Friedl and others, Reference Friedl, Seehaus and Braun2021; Lei and others, Reference Lei, Gardner and Agram2022).
To analyze changes in surface velocities, we extracted them along two longitudinal profiles along the western Upsala and Bertacchi termini, respectively, from velocity fields dated to between January 2015 and January 2023 (Fig. 1b). In doing so, we combined the SAR surface velocity products generated by the ITS_LIVE and FAU datasets to fill temporal gaps and generate a longer and more robust spatiotemporal series. Due to the frequent and extensive cloud cover over the SPI (Schaefer and others, Reference Schaefer, MacHguth, Falvey, Casassa and Rignot2015; Viale and others, Reference Viale2019), we discarded surface velocities derived from optical imagery. From this combined product, we assessed the changes in surface velocity through time and determined the longitudinal velocity gradient (LVG) and the near-terminus surface velocity.
The LVG was calculated as the difference between the maximum velocity near the terminus and velocities recorded 2 km (Bertacchi) and 4 km (western) upstream of the termini. These thresholds (hereafter referred to as the ‘breaking point’) were chosen on the basis of the peak velocity slope change over the historic mean surface velocity along profiles (from ~0.01 to >0.5 md−1 per km). Importantly, the LVG is a primary control on calving processes. Calving will occur where the velocity gradient is sufficiently high to allow crevasses to penetrate through the glacier. Crevasses which have opened in response to velocity gradients provide an important first-order control on the position and geometry of calving margins (Benn and others, Reference Benn, Warren and Mottram2007). To calculate the near-terminus surface velocity (Fig. 4), we averaged all available observations between the glacier front and the respective breaking points. Lastly, we estimated the near-terminus surface velocity anomalies using the historical monthly average as a reference.
2.1.1 Cross-validation between ITS_LIVE and FAU datasets
Due to the differences in the methodologies used to generate the ITS_LIVE and FAU datasets, we performed a cross-validation of the ITS_LIVE and FAU time series prior to extracting surface velocities along the Bertacchi and western Upsala tongue longitudinal profiles. The FAU velocity maps (200 m spatial resolution) are derived from consecutive image-pairs, with the temporal baseline ranging from 6 to 12 d (Friedl and others, Reference Friedl, Seehaus and Braun2021). In contrast, ITS_LIVE generates velocity maps (120 m spatial resolution) between all image-pairs separated by <12 d (Gardner and others, Reference Gardner, Fahnestock and Scambos2019; Lei and others, Reference Lei, Gardner and Agram2021a, Reference Lei, Gardner and Agram2022). Consequently, multiple velocity values are typically available for the same location and date. Furthermore, while FAU uses regionally fixed reference and search windows (Friedl and others, Reference Friedl, Seehaus and Braun2021), ITS_LIVE searches for a ‘valid’ window based on the iterative autoRIFT module (Lei and others, Reference Lei, Gardner and Agram2022). While previous studies have reported average differences of ±0.2 md−1 between ITS_LIVE and FAU, both datasets perform well in detecting fast-flowing ice (Friedl and others, Reference Friedl, Seehaus and Braun2021; Lei and others, Reference Lei, Gardner and Agram2022).
From the combination of ITS_LIVE and FAU, we used a total of 446 surface velocity maps. We compared the surface velocity between 53 ‘twin’ images (i.e. scenes from the exact same dates from ITS_LIVE and FAU datasets). To facilitate comparison, we analyzed the velocity data at seven sampling points over Upsala Glacier (W1–4, B1–2 and C1), and three additional points on stable rock outcrops over Herminita Peninsula (H1–3) (Fig. 2). Sampling points W1–W2 and B1–B2 are located near glacier termini, where surface deformation and crevassing due to fast ice flow is greatest (Muto and Furuya, Reference Muto and Furuya2013). The W3–W4 sampling points are located 9 and 16 km upstream of the western terminus, respectively, and thus situated away from high deformation zones. The performance of the datasets was evaluated by calculating the root mean square error (RMSE) and the median absolute difference (MAD) (Vacaflor and others, Reference Vacaflor, Lenzano, Vich and Lenzano2022). Additionally, the spatial correlation on a pixel basis between twin image-pairs was assessed (Fig. S1).
Overview of surface velocity products derived from ITS_LIVE and FAU datasets. (a) Surface velocity differences between the ITS_LIVE and FAU datasets. The background image is a LANDSAT8 from 20/08/2013; (b) number of surface velocity maps per year; and (c) number of surface velocity maps per month.
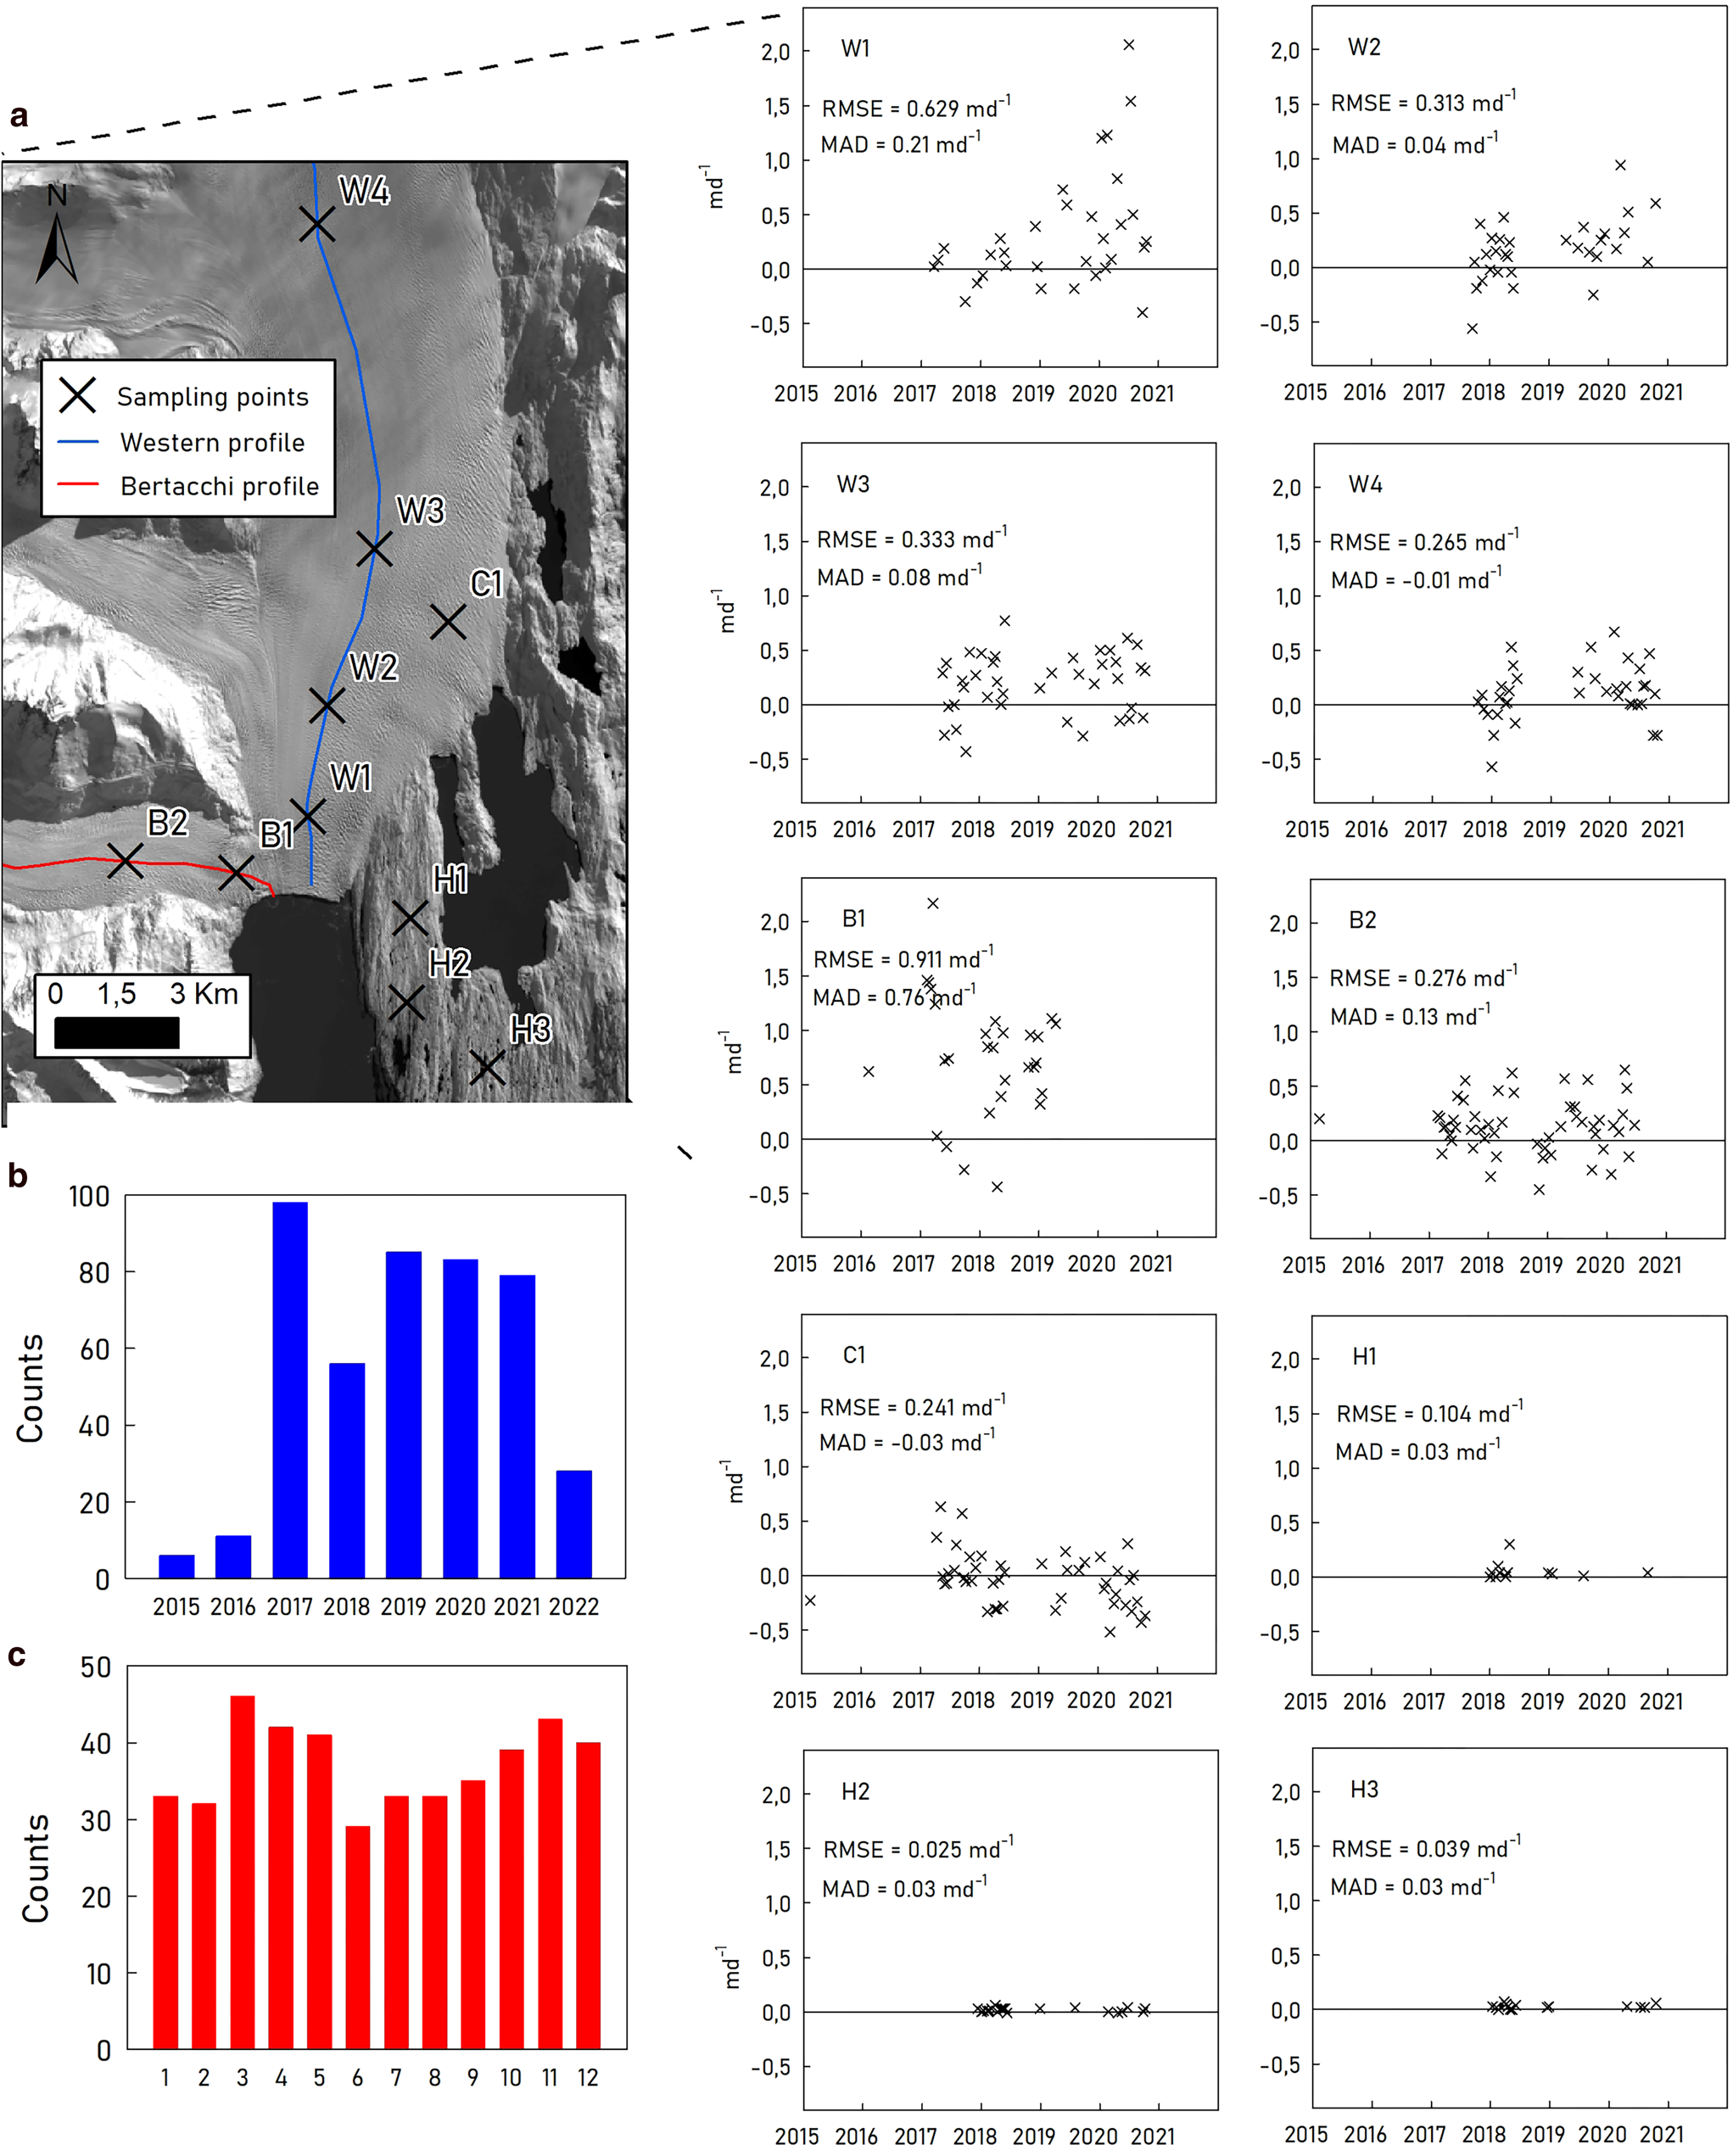
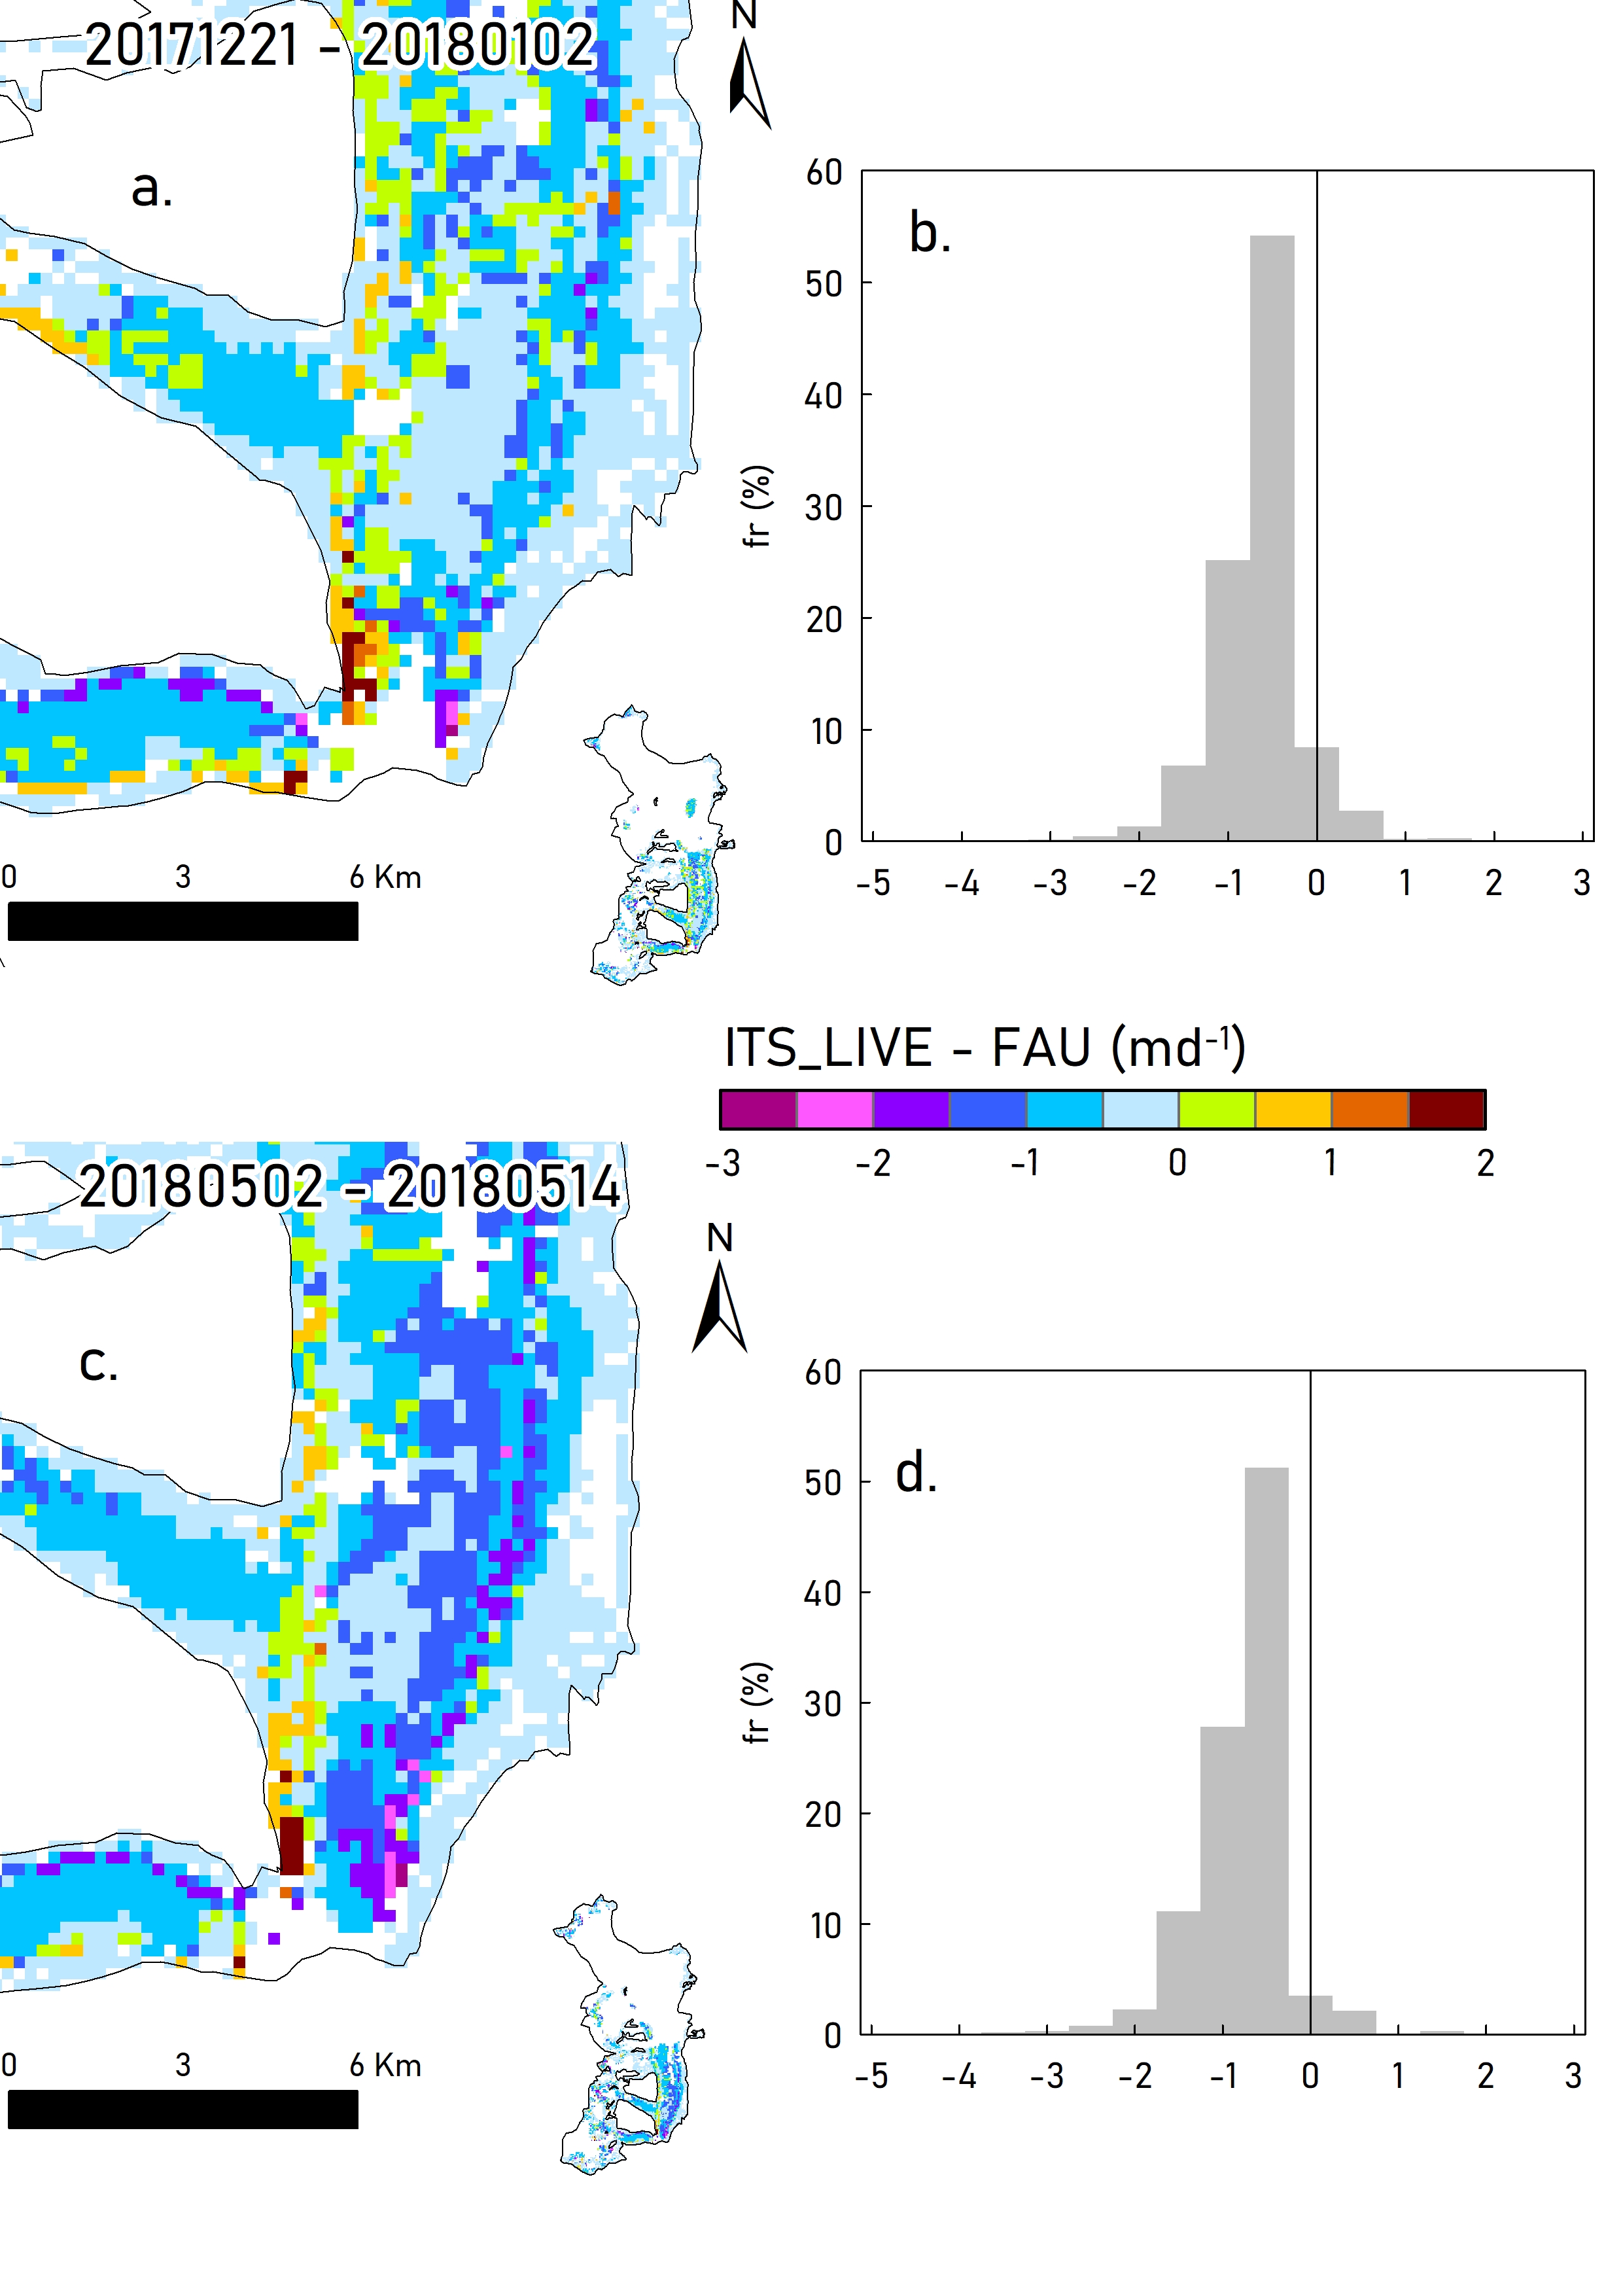
Over glacier ice, the highest MAD and RMSE near the western and Bertacchi termini ranged from 0.21 to 0.76 (MAD), and from ±0.62 to 0.91 md−1 (RMSE), respectively (Figs 2a, b). If the sampling sites close to the Bertacchi and western termini (B1 and W1) are excluded from the comparison, the maximum MAD and RMSE are reduced to 0.13 and ±0.33 md−1, respectively. Over stable outcrops on the Herminita Peninsula (H1–3), the MAD and RMSE decreased to 0.03 and ±0.02 md−1, respectively. The spatial comparison of twin velocity maps (ITS_LIVE – FAU) revealed an average difference of −0.43 ± 0.51 md−1. Figure S1 illustrates these differences over two distinct periods. Overall, the majority of differences (60%) ranged between 0 and −0.5 md−1. The greatest discrepancies (±1.5 md−1) were observed exclusively in the vicinity of the Bertacchi and western Upsala termini, representing <10% of the total dataset.
2.2 Changes in terminus position
We mapped 103 terminus positions of the western and Bertacchi termini between January 2015 and 2023 (Fig. 1). We used ground range detected (GRD) Sentinel-1A images (Table S1), which coincide in time with those used in the ITS_LIVE and FAU datasets. The GRD products focus on SAR data, resampled and projected to ground range (10 m of spatial resolution) in UTM Zone 18S projection. The main pre-processing steps included thermal noise removal, radar backscatter adjustment and image co-registration (Serco Italia SPA, 2018). The various pre-processing steps were performed using the SAR image workflow in the Sentinel Application Platform 8.0 (SNAP). Sub-pixel co-registration of SAR imagery is a mandatory requirement and a critical component (Strozzi and others, Reference Strozzi, Wiesmann, Kääb, Schellenberger and Paul2022). To improve the co-registration, we applied precise orbit ephemeris information (Nagler and others, Reference Nagler, Rott, Hetzenecker, Wuite and Potin2015; Lemos and others, Reference Lemos2018). This information is available within 3 weeks after image acquisition and guarantees the highest geolocation accuracy (Friedl and others, Reference Friedl, Seehaus and Braun2021). Therefore, we neglected any uncertainty in the terminus position change owed to image misregistration.
We manually delineated glacier termini using on-screen visual interpretation to avoid common errors in automated methods, such as the inclusion of ice mélanges near the terminus (Atwood and others, Reference Atwood, Meyer and Arendt2010; Ciappa and others, Reference Ciappa, Pietranera and Battazza2010; Nagler and others, Reference Nagler, Rott, Hetzenecker, Wuite and Potin2015; Lemos and others, Reference Lemos2018). We then measured the rate of change in frontal position (L) along the longitudinal profiles on the Bertacchi and western Upsala tongues (Fig. 1b).
We defined the uncertainty in terminus position change (σ L) as (Eqn (1)):

where σ m is the mapping uncertainty and dt is the temporal baseline between the initial and final images of each pair. We assumed σ m to be equal to the spatial resolution of the Sentinel-1 imagery (10 m) (Paul and others, Reference Paul2013, Reference Paul2017). As the temporal baseline of the Sentinel-1 images used ranged between 6 and 120 d, the associated uncertainties spanned from 0.16 to 3.33 md−1. Lastly, we mapped the length of the central moraine separating the Bertacchi and western tongues across all images (Fig. S2), assuming that this line represents the ʿcontactʾ surface between the two glacier tongues and an indicator of their physical separation.
3. Results
3.1 Surface velocity
Upsala Glacier shows a clear spatial pattern of surface velocity, ranging between 0.3 ± 0.03 and 6.5 ± 0.03 md−1. Surface velocities along the longitudinal profiles showed much higher velocities in the lowermost 4 km of the western Upsala terminus and in the lowermost 2 km of the Bertacchi glacier (we term these two locations as ʿbreaking pointsʾ) (Fig. 3). Only below the breaking points do surface velocities exceed 3 md−1.
Surface velocities along the western Upsala (a), and Bertacchi (b) profiles between January 2015 and 2023. These panels present the 446 velocity profiles reconstructed for each glacier tongue. The shaded area in a–b comprises the surface velocity values used to estimate the near-terminus surface velocity displayed in Figure 4.

3.1.1. Surface velocity near terminus
We observed clear differences between surface velocities near the western and Bertacchi termini. The average surface velocity was 1.6 times higher at the western tongue (3.40 ± 0.03 md−1) than on the Bertacchi tongue (2.13 ± 0.03 md−1) (Fig. 4). The maximum velocities observed at the western terminus exceeded 4 md−1, while at Bertacchi they never exceeded 2.5 md−1. Furthermore, the interannual velocity at the western terminus decreased by ~1 ma−1 between 2015 and May 2020, but then increased by ~0.5 ma−1 until January 2023 (Fig. 4f).
Panels a and b show the longitudinal velocity gradient at the Bertacchi and western termini, respectively. The mean surface velocities near the Bertacchi and western termini are shown in panels c and d, respectively. Panels e and f show the surface velocity anomalies for panels c and d, respectively.

3.1.2 Longitudinal velocity gradient
The mean LVG at the Bertacchi tongue was 2.3 md−1, 28% larger than that observed at the western tongue (1.8 md−1). In both cases, the relative maxima of LVG were reached in September 2017, 2018 and 2021, with peaks of 5.3 and 4.7 md−1 at western and Bertacchi tongues, respectively. A negative trend of LVG was observed for the western tongue only, equal to 0.1 ma−1 (p-value <0.005) (Figs 4c, d).
3.2 Glacier frontal fluctuation
We noted a heterogeneous pattern of cumulative retreat among the investigated glacier termini throughout the study period 2015–2023 (Fig. 5). The western Upsala terminus showed greater cumulative retreat (1063 ± 20 m) than the Bertacchi terminus (297 ± 20 m) (Figs 5a, b). In addition, the retreat rates of these termini showed a strong temporal variability. The majority (96%) of the retreat of the Bertacchi terminus occurred between March 2015 and May 2016. The terminus then remained approximately stable, only 260 m away from its position in January 2015, representing just 4% of the total retreat in the 2015–2023 period. Conversely, the majority of the cumulative retreat at the western terminus (accounting for 98% of the total retreat) occurred from January 2019 onwards (260 ± 2.5 ma−1). Prior to 2019, the retreat rate was 6 ± 2.5 ma−1.
Spatiotemporal terminus position changes (TPC) and cumulative terminus position changes for the Bertacchi (a), and the western Upsala (b) tongues, respectively, between January 2015 and 2023. (c) Percentage of fragmentation between termini. The background image is a SENTINEL1-A scene from 12/01/2023.

Tracking of the central moraine between the western Upsala and Bertacchi termini revealed that in January 2015 the length of the moraine was 1609 ± 10 m. Between January 2015 and January 2019, the fragmentation rate was progressive (0.3 ± 0.01 md−1), reaching 30% of the total. From January 2019, the rate tripled (0.9 ± 0.01 md−1) and continued until the end of fragmentation in January 2023. Fragmentation patterns showed a stronger linear correlation with the retreat of the western terminus (r = 0.95) than with the Bertacchi terminus retreat (r = 0.41). Both were statistically significant (p-value <0.05).
4. Discussion
Previous work suggests that glacial lake topography is a primary control of the rapid retreat observed in the western tongue of Upsala Glacier (Naruse and Skvarca, Reference Naruse and Skvarca2000; Skvarca and others, Reference Skvarca, Raup and De Angelis2003; Minowa and others, Reference Minowa, Schaefer and Skvarca2023). We therefore analyze the observed changes in surface velocity and terminus position relative to bed topography. To do so, we used the bed elevation models from Millan and others (Reference Millan2019), Minowa and others (Reference Minowa, Schaefer and Skvarca2023), Fürst and others (Reference Fürst2024) and Lannutti and others (Reference Lannutti2024), and ice thickness models from Hugonnet and others (Reference Hugonnet2021). Based on these data, we calculated the critical flotation thickness (CFT). We also estimated the width of the valley at all terminus positions throughout the study period. An overview of the ice thickness and bed elevation models used and full details of the data and calculations can be found in the supplementary material (S1).
4.1 Changes in the dynamics of the western and Bertacchi Terminus
The topography of Upsala channel controls the buoyancy and retreat rates of the Upsala Glacier (both western and Bertacchi tongues) (Naruse and Skvarca, Reference Naruse and Skvarca2000; Skvarca and others, Reference Skvarca, Raup and De Angelis2003; Minowa and others, Reference Minowa, Schaefer and Skvarca2023). In addition, the surface velocity near the western terminus is mainly determined by basal sliding (~94%) (Minowa and others, Reference Minowa, Schaefer, Sugiyama, Sakakibara and Skvarca2021; Lannutti and others, Reference Lannutti2024), which is inversely related to the effective pressure (Sugiyama and others, Reference Sugiyama2011). Through our study period, both termini have been situated above/close the overdeepening located at the lake bed. Based on the frontal fluctuations and velocity changes observed, we identified two different stages in glacier evolution.
During stage 1 (January 2015–December 2018), the steep LVG observed at western tongue (maximum up to 5.0 md−1) was in line with the negative CFT calculated for the four models (Figs 6c–e) (Millan and others, Reference Millan2019; Minowa and others, Reference Minowa, Schaefer and Skvarca2023; Fürst and others, Reference Fürst2024; Lannutti and others, Reference Lannutti2024), suggesting that the ice front was buoyant during this stage (Fig. 6e). Given buoyant conditions, an increase of surface velocities, retreat rate and thinning rates would be expected. However, despite the surface velocity being the highest in our velocity record (~5 ± 0.3 md−1), the western terminus retreated and thinned at a low rate of 6 ± 2.5 and 2.6 ma−1, respectively, over the deepest zone (Hugonnet and others, Reference Hugonnet2021). Contrarily, the Bertacchi terminus showed a higher retreat rate (285 ma−1) and an increase of surface velocity, which were consistent with the CFT recorded there (Fig. 6h).
(a) Surface velocity anomalies and cumulative frontal variations of western Upsala Glacier (Bertacchi Glacier – f). (b) Percentage of fragmentation and the width of the bed of western Upsala Glacier (Bertacchi Glacier – g). (c) Longitudinal velocity gradient and terminus position change rate of western Upsala Glacier (Bertacchi Glacier – h). (d) Glacier bed elevation at western terminus position (Bertacchi Glacier – i). Height below/above critical flotation thickness at western terminus position (Bertacchi Glacier – j).

During stage 2 (January 2019–January 2023), the terminus position of the western tongue retreated above the overdeepening and then toward shallower depths. The surface velocity decreased and reached its lowest value during the study period (2.75 md−1). Also, the LVG reached its absolute minimum (1 md−1), and major peaks were less frequent compared to stage 1 (Fig. 6c). It should be expected that the decrease both in LVG and bed depths would lead to a reduction in the retreat rate (Van Der Veen, Reference Van Der Veen2002; Benn and others, Reference Benn, Warren and Mottram2007; Benn and Åström, Reference Benn and Åström2018; Bunce and others, Reference Bunce, Carr, Nienow, Ross and Killick2018). Yet surprisingly, the western terminus retreat rate increased to 260 ± 2.5 ma−1, reaching a maximum rate of 325 ± 2.5 ma−1 from January 2021 onwards (Figs 6a, d). At the same time as the western terminus retreated rapidly, the Bertacchi terminus advanced by 60 ± 20 m. The loss of support from the western terminus, together with the steep surface slope of the Bertacchi terminus, would have encouraged the increase in driving stress and, in effect, the advance of the front.
4.1.1 Interpretation of Upsala fragmentation
There is strong evidence that the reduction in effective pressure due to the deeper bed drove the rapid retreat observed at the western Upsala terminus (Naruse and Skvarca, Reference Naruse and Skvarca2000; Skvarca and others, Reference Skvarca, Raup and De Angelis2003; Sakakibara and others, Reference Sakakibara, Sugiyama, Sawagaki, Marinsek and Skvarca2013; Minowa and others, Reference Minowa, Schaefer and Skvarca2023). Consequently, the effective pressure should have been low at the bed overdeepening increasing the glacier buoyancy, surface velocities and retreat rate (Post and others, Reference Post, O'Neel, Motyka and Streveler2011; Bown and others, Reference Bown2019). However, as noted above, the terminus position of Upsala Glacier was stable above the bed overdeepening during stage 1 (2015–2019), and then it retreated quickly beyond the overdeepening (Figs 6a–d).
Bunce and others (Reference Bunce, Carr, Nienow, Ross and Killick2018) examined 276 calving glaciers in Greenland and found that bed and channel geometry are the main drivers on the timing and magnitude of glacier retreat. These authors observed that where glaciers retreated more than 200 ma−1 (such as the western Upsala terminus in stage 2) the loss of a lateral pinning point and/or into a widening bed were a key factor. Narrower, shallower confluences and bends at the glacier bed and sidewalls are potential stability sites or pinning points (Warren and Glasser, Reference Warren and Glasser1992). Conversely, the retreat of a glacier into a wider channel leads to thinning of the glacier to maintain a similar ice flow rate, which in turn weakens the terminus and promotes calving (Carr and others, Reference Carr, Stokes and Vieli2014). A wider channel also reduces lateral stresses between the glacier and the channel wall (Raymond, Reference Raymond1996). This reduces flow resistance and leads to increased ice velocity, which in turn promotes thinning and increased calving (Bunce and others, Reference Bunce, Carr, Nienow, Ross and Killick2018). The retreat rate during stage 1 (6 ma−1) is the second lowest ever recorded at Upsala Glacier, after 1970–78 period (~0 ma−1 retreat rate), which was associated with a pinning point (Naruse and others, Reference Naruse, Srvarca and Takeuchi1997; Naruse and Skvarca, Reference Naruse and Skvarca2000). Firstly, we relate the highly stable phase of stage 1 to the lateral pinning exerted by the Bertacchi tongue as the western terminus retreated over the overdeepening. Secondly, the narrowing of the western tongue in the confluence zone is likely to result in a greater contribution of lateral stresses to the force budget (Carr and others, Reference Carr, Stokes and Vieli2014). In contrast to stage 1, the strong retreat during stage 2 could be related to the progressive loss of the lateral pinning point and the widening of the bed (Fig. 6b). The increase of the retreat rates has been in turn linked to a positive feedback mechanism related to changes in flow dynamics through tributary detachment (Paul and others, Reference Paul, Kääb, Maisch, Kellenberger and Haeberli2004; Kargel and others, Reference Kargel2005). In summary, we propose that the western tongue would likely have retreated much more rapidly in the absence of the Bertacchi lateral pinning point and compressive forces as in 2008-2009 (Fig. 7).
Time series of surface velocities near the terminus and position of the western Upsala terminus between 1990 and 2023, using historical records and those derived from this study. The red lines must be read on the right Y-axis.

Upsala Glacier may enter a new stage of fragmentation at the confluence between the western tongue and the Cono tributary (Fig. 1b). Bed elevation models suggest a normal slope upstream of the January 2023 terminus position, where the bed becomes shallower overall (Fig. S3). Although these models do not suggest the presence of an overdeepening at the Cono confluence zone, a zone of deeper bed elevation is seen along the western profile than at the margins. In addition, the bed widening near the confluence zone up-valley will reach three times the average bed width along 2015–2023 (from 1.9 to 5.9 km). These changes in channel geometry could lead to thinning and promote buoyancy conditions and calving (Carr and others, Reference Carr, Stokes and Vieli2014) and higher ice mass loss rates in the future.
5. Conclusions
Facilitated by the wide availability of SAR Sentinel-1 imagery, we were able to monitor glacier surface velocities and changes in frontal position between January 2018 and January 2023, during the fragmentation of one of the main outlet glaciers of the Southern Patagonian Ice Field. This fragmentation, which was completed in January 2023, resulted in the complete separation of the main Upsala Glacier trunk (western tongue) (645 km2) from the Bertacchi Glacier (111 km2).
Two main stages of terminus recession were identified within the analyzed period. Stage 1 is characterized by a steep LVG and low retreat rates as the western tongue flowed over a bed overdeepening. During stage 2, the LVG was much lower, yet the tongue retreated significantly in spite of a shallower bed.
Our results suggest that the compressive forces exerted by the Bertacchi tributary tongue stabilized the western tongue at a lateral pinning point. Both effects would tend to stabilize the front position, even under unfavorable buoyancy conditions. Even when the glacier was retreating over the bed overdeepening during stage 1, the retreat rate was only 6 ma−1 between 2015 and 2018, the second lowest rate among available records for Upsala Glacier. We conclude that in the absence of the Bertacchi tributary, the retreat rate of the western tongue would have been exacerbated by the occurrence of the bed overdeepening in the confluence zone. Once fragmentation reached 50%, and coupled with the upstream expansion of the bed glacier, the retreat rate increased and peaked at 325 ma−1.
In this study, we provide new insights into the factors involved in glacier dynamics during fragmentation processes. As the retreat of the Upsala Glacier continues unabated, it may undergo through a new stage of separation from the Cono tributary. Given that glacier retreat in the SPI is likely to continue and new glacier fragmentation processes will occur, detailed studies of glacier dynamics, glacier and lake bed topography are essential.
Supplementary material
The supplementary material for this article can be found at https://doi.org/10.1017/jog.2024.91.
Acknowledgements
We thank Dr Owen King (Newcastle University) for his invaluable assistance in improving the quality of the English language and the clarity of the manuscript. We also thank the reviewers and the editor, Professor Rachel Carr, for their contributions in moving this work forward. Finally, we thank the National Scientific and Technical Research Council for institutional and technical support. This work was not specifically funded.


 Open access