


1. Introduction
The concept of network brokerage in Burt's (Burt, Reference Burt1992) theory of structural holes integrates two foundational research traditions. The central claim is that brokerage positions confer dual advantages: access to diverse information and control over its flow. The first tradition, rooted in Emerson's (Emerson, Reference Emerson1962) theory of power and dependence, emphasizes the benefits of maintaining multiple exchange partners. Dependence limits control. When a focal actor has many substitutes for their partners, and those partners have few substitutes for the focal actor, dependence declines and control increases. The second tradition emphasizes how the bridge-and-cluster structure of social networks shapes the flow of information, as reflected in Granovetter's (Granovetter, Reference Granovetter1973) “strength of weak ties” argument. Individuals within the same cluster—whether a group, community, or organizational unit—communicate more frequently, influence one another's choices, and tend to behave similarly and express similar views (Centola, Reference Centola2018). This structure explains why Granovetter's weak ties expose individuals to a broader range of ideas and perspectives: the weak ties he emphasized serve as bridges. Burt's theory unites these insights by recognizing that power and information access both arise from gaps or structural holes in network structure. Structural holes limit communication between groups, and as a result allow distinct pools of ideas and experience to persist, with relationships that bridge these gaps providing informational benefits. Structural holes also have implications for power and control. Additional exchange partners enhance power only when they are disconnected (i.e., separated by a structural hole) and cannot coordinate their actions (Burt, Reference Burt1980, Reference Burt1982).
Extensive research documents brokerage advantages across levels of analysis—from individuals (Kwon et al., Reference Kwon, Rondi, Levin, De Massis and Brass2020; Burt, Reference Burt, Small, Perry, Pescosolido and Smith2021; Brass, Reference Brass2022; Yang et al., Reference Yang, Tian, Woodruff, Jones and Uzzi2022) to teams (Soda et al., Reference Soda, Mannucci and Burt2021), firms (Podolny, Reference Podolny2001; Shipilov et al., Reference Shipilov, Li, Bothner and Truong2023), industries (Burt, Reference Burt1980), and countries (Eagle et al., Reference Eagle, Macy and Claxton2010). Returns to brokerage vary systematically with network features, increasing with the strength and width of bridging ties (Tortoriello and Krackhardt, Reference Tortoriello and Krackhardt2010; Aral and Van Alstyne, Reference Aral and Van Alstyne2011; Burt and Opper, Reference Burt and Opper2024). Strong ties provide greater bandwidth, while wide bridges create multiple communication channels, both enhancing the transfer of tacit knowledge and improving performance on tasks that require integrating complex ideas and information (Burt, Reference Burt, Small, Perry, Pescosolido and Smith2021).
Despite this progress, a core question remains: Does brokerage increase performance, or does performance attract brokerage? The former is often assumed, but the latter is equally plausible—successful individuals, projects, and firms may draw attention from diverse others, increasing their likelihood of forming bridging ties. Most evidence is cross-sectional, documenting correlations rather than causal mechanisms. Network position and performance are mutually reinforcing, as networks and outcomes coevolve. This realism complicates inference: the observed link between brokerage and performance could reflect underlying factors, such as ability or motivation, that shape both network formation and outcomes. The challenge is to distinguish causal network effects from selection and self-reinforcing advantage. Selection captures the tendency for capable actors to occupy brokerage positions; self-reinforcing advantage reflects feedback loops through which performance and network position amplify one another. For example, Bachmann and colleagues (Bachmann et al., Reference Bachmann, Espín-Noboa, Iñiguez and Karimi2026) document an association between success and brokerage among physicists, where early brokerage begets further brokerage and success, with returns amplified in senior positions where women are underrepresented, thereby amplifying gender inequality. Perceptions of network position by self and others can sustain this self-reinforcing process. For example, Kovářík et al. (Reference Kovářík2025) show that perceptions of network position affect individual performance, with individuals perceived to be more central (and popular) performing better.
Social network experiments provide a powerful method for identifying causal network effects (An et al., Reference An, Beauville and Rosche2022). Experiments have been used to establish the network foundations of power in negotiations (Cook and Emerson, Reference Cook and Emerson1978; Cook et al., Reference Cook, Emerson, Gillmore and Yamagishi1983; Skvoretz and Willer, Reference Skvoretz and Willer1993) and have also been used to document network effects on interpersonal influence and social contagion (Centola, Reference Centola2018). Social network experiments can be used to estimate causal network effects yet allow a specific form of network endogeneity. Random assignment eliminates the correlation between individual differences and treatment network assignment but not between individual differences and treatment response. Participants retain discretion in how they engage assigned ties, producing behavioral networks that can deviate from assigned networks. Individual discretion introduces network endogeneity. As Greenberg (Reference Greenberg2021) notes, “if one randomizes opportunity for interaction, but allows agentic choice, then the structure is not strictly exogenous with respect to actors’ characteristics, preferences, and choices.”
We use data from three networks to demonstrate an underappreciated approach for estimating causal network effects in the presence of endogeneity. The pre-experiment network captures individual differences, the treatment network defines the assigned network, and the behavioral network reflects interactions that occur during the experiment. Network experiments provide a distinctive opportunity to identify causal effects even when endogeneity is present. The treatment network is correlated with the behavioral network but, because assignment is random, it remains uncorrelated with individual differences. This property allows the treatment network to serve as an instrument for the behavioral network, isolating the portion that is causally induced rather than endogenously formed and distinguishing induced network effects—those driven by assignment—from behavioral effects that emerge during the experiment.
We illustrate the value of this strategy using data from a replication of the classic Bavelas–Smith–Leavitt experiment, in which individuals are randomly assigned to teams with distinct network structures and positions. In the original studies, participants identified simple symbols; in our version, they identify abstract shapes (tangrams) that can be described in multiple ways, requiring teams to develop a shared vocabulary to coordinate effectively. Our outcome measure is perceived leadership, captured through team members’ nominations.
Leadership is relational and emerges through interaction as members shape team dynamics (Anderson and Kilduff, Reference Anderson and Kilduff2009), which in our setting includes the development of the shared language used to describe abstract symbols. Consistent with work on leadership and networks (Carter et al., Reference Carter, DeChurch, Braun and Contractor2015), we treat brokerage as facilitating behaviors that increase the likelihood that a team achieves collective goals and, in turn, that a focal individual is recognized as a leader. This view aligns with definitions that locate leadership in patterns of behavior (Motowidlo and Kell, Reference Motowidlo and Kell2003) that unfold through relationships (Winston and Patterson, Reference Winston and Patterson2006), particularly behaviors that enable coordination and the achievement of collective objectives (Cullen-Lester et al., Reference Cullen-Lester, Maupin and Carter2017). In this sense, leadership is an individual-level performance outcome within a team context, reflecting relative standing and contribution.
Using the treatment network as an instrument, we estimate the causal component of the behavioral network's effect on perceived leadership. We also examine how pre-experiment networks shape behavioral networks. Pre-experiment networks influence behavioral networks, but the direction of the effect is surprising: participants who enter with brokerage networks often occupy non-brokerage positions. This reversal underscores that behavioral networks cannot be reduced to individual discretion. They arise from the interdependent decisions and interactions of multiple individuals. Even the endogenous components of behavioral networks generate structural effects that extend beyond the control or intentions of any single individual.
2. Hypothesis, experiment, and data
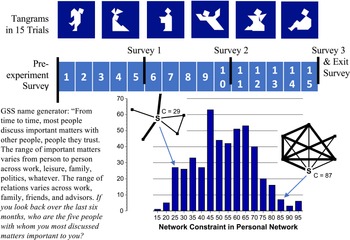
We illustrate the value of our approach by reexamining the hypothesis advanced by Burt and his colleagues (Burt et al., Reference Burt, Reagans and Volvovsky2021). They predict that the more a person bridges structural holes within a team, the more likely that person is to be perceived as the team leader. We test this hypothesis by building on their renovation of the classic Bavelas–Smith–Leavitt team experiment (Leavitt, Reference Leavitt1951), which uses random assignment to networks to identify causal effects. Teams of five people are each given a “hand” of five symbols drawn from a population of six symbols. The task is for teammates to communicate with one another to discover which symbol they have in common. The task would be simple with symbols that are widely familiar. The original experiment used familiar symbols (circle, a square, a triangle, etc.). Burt et al. (Reference Burt, Reagans and Volvovsky2021) make the task complex by using abstract symbols, so-called “tangrams” (which we also use in our experiment; see Figure 1). Teammates must coordinate on words and phrases to identify the tangrams. A trial begins when each teammate receives his or her “hand” and continues until all five teammates have submitted their guess of the shared symbol. The experiment consists of 15 trials.
Experiment overview. People who bridge more team structural holes are more likely to be perceived as team leader.

Figure 1 Long description
The image presents a detailed diagram explaining the concept of network brokerage as described in Burt's theory of structural holes. At the top, there are six tangram shapes, each representing different trials. Below the tangrams, a sequence of surveys is depicted, labeled as Pre-experiment Survey, Survey 1, Survey 2, and Survey 3 & Exit Survey. The surveys are numbered from 1 to 9 and 1 to 5 respectively. The bottom part of the image features a bar graph titled 'Network Constraint in Personal Network,' which shows the distribution of network constraint scores among individuals. The x-axis ranges from 15 to 95, and the y-axis ranges from 0 to 70. Two annotations, labeled 'S' with values C = 29 and C = 87, point to specific bars on the graph, indicating different levels of network constraint. Additionally, there is a text box with a question from the GSS name generator about discussing important matters with trusted people. The overall concept emphasizes the advantages of brokerage positions in social networks, highlighting access to diverse information and control over its flow.
We re-created the experiment on the Empirica platform (https://empirica.ly), drawing new data on participants from the Prolific respondent population (Palan and Schitter, Reference Palan and Schitter2018).Footnote 1 Participants are screened volunteers in the US. The screening runs as follows: Interested Prolific participants sign up for the study lasting up to an hour with compensation of eight dollars plus performance bonuses (one dollar per teammate for each correct team solution). In an introductory session, they answer 10 questions to assess their English language skills. Those who pass the language screen are given a tutorial on doing the experiment task, then asked comprehension questions. Those who pass the comprehension screen are presented with an example tangram and asked to write how they would describe the tangram to another person, then they are asked the pre-experiment name generator and name interpreters to describe their core personal network. At this point, the person is invited to participate in the experiment. There are no quotas for the usual sampling strata of gender, race, education, or age. The final assembly of 465 participants are 51% male, primarily high school (40%) or college (40%) graduates, varying in age from 18 to 73 around a mean of 38 years. We collected data in batches of 8-12 teams during February and March, 2023.
2.1 Personal network pre-experiment
Figure 1 displays the text of the name generator we used to measure personal networks pre-experiment. Patterned on the widely used General Social Survey name generator (Marsden, Reference Marsden1987), the question asks for people with whom a participant has most often discussed important matters in the last six months. The participant is encouraged to use initials or nicknames and told that the names will not be recorded. The names are used immediately in two name interpreter questions, then replaced with sequential numbers in the recorded data. The name interpreters ask how often participants spoke with each named discussion partner (“daily,” “weekly,” “less often”), and how often each pair of discussion partners spoke with each other. These data are sufficient to compute network constraint scores for each participant.Footnote 2 Example networks of high and low constraint are displayed in Figure 1. Thicker lines indicate more frequent discussion. The sociogram to the left shows a person whose discussion partners rarely talk to one another. The sociogram to the right shows a person whose discussion partners mostly talk with one another every day. With constraint scores grouped into five-point intervals, the histogram in Figure 1 shows a roughly normal distribution of constraint varying from 19 to 99 points around an average of 55.64, with a 16.61 standard deviation. These are not extensive data on pre-experiment networks, but the data are sufficient to distinguish participants by the extent to which they enter the experiment accustomed to interpersonal behavior in closed networks, with its normative prescription for proper behavior and preservation of the network status quo (Burt, Reference Burt2002, Reference Burt2005; Martin and Yeung, Reference Martin and Yeung2006; Martin et al., Reference Martin, Overgoor and State2023).
2.2 Independent variable: Treatment networks
Adapted from Burt et al. (Reference Burt, Reagans and Volvovsky2021), Figure 2 displays the treatment networks to which participants are assigned. Lines connect pairs of teammates allowed to communicate with one another. The primary contrast is between the Wheel network, in which one person has monopoly brokerage (position 1, brokering communication across 6 structural holes between teammates), versus the Clique network, in which every teammate has access to one another, so no one is a broker. The two mixed networks are a pair of disconnected brokers connected to the same contacts (position 2) and a pair of connected brokers who have the same contacts (position 4, alternatively the network is a pair of overlapping cliques). The four treatment networks lie along a continuum of direct communication among teammates—from Clique networks the best connected, to Wheel networks the least directly connected, and mixed networks in the middle. Reagans et al. (Reference Reagans, Volvovsky and Burt2023) explain: “The direct connection between the two brokers creates the potential for more effective communication between the two brokers which should create an even greater capacity for developing a shared language on a CB [Connected-Brokers] team.”
Four treatment networks.

Figure 2 Long description
The diagram illustrates four distinct treatment networks: Wheel, Mixed Disconnected-Brokers, Mixed Connected-Brokers, and Clique. The Wheel Network features a central node connected to four outer nodes, all labeled with the number 7. The Mixed Network: Disconnected-Brokers shows a central node labeled 2 connected to three outer nodes labeled 3. The Mixed Network: Connected-Brokers depicts a central node labeled 4 connected to three outer nodes labeled 6. The Clique Network consists of five interconnected nodes, all labeled 5. Below the networks, tables categorize nodes into Low-Constraint Positions and High-Constraint Positions, detailing their IDs, constraints, and positions.
For easy reference, teammates identify one another by color. Participants are assigned at random to one of seven identification colors and assigned at random to one of the seven network positions in Figure 2. The seven colors are Black, Blue, Green, Purple, Red, White, and Yellow. Color is independent of assigned position in a treatment network ( $\chi ^2(18) = 0.28$
,
$\chi ^2(18) = 0.28$
, $P \approx .92$
), consistent with random assignment, and has no association with leadership citations (Poisson
$P \approx .92$
), consistent with random assignment, and has no association with leadership citations (Poisson $\chi ^2(6) = 4.52$
,
$\chi ^2(6) = 4.52$
, $P \approx .61$
). A participant's assigned color and position are constant through the experiment.
$P \approx .61$
). A participant's assigned color and position are constant through the experiment.
We use network constraint to measure the extent to which a participant's network provides brokerage opportunities (Burt, Reference Burt1992). Constraint decreases toward zero with the number of contacts in a person's network (degree or network size) and increases with the strength of connections between contacts (density) or concentration of relations in a subset of contacts (hierarchy or centralization). We multiply constraint by 100 to speak in terms of points of constraint and round constraint in completely dense small networks to 100. The table in Figure 2 shows the number of structural holes to which each assigned position has access, which decreases as network constraint on the position increases. The hypothesis is that leader citations to a participant decreases as network constraint on the participant increases. We aimed for 20–25 teams in each network condition.
2.3 Dependent variable: Citations for team leadership
Perception of leadership has been a core dependent variable in brokerage research: who gets recognized for promotion to leadership positions (Brass, Reference Brass1985; Burt, Reference Burt1992), who gets more positive annual reviews as leaders (Iorio, Reference Iorio2022), and who among managers gets better compensated for their leadership (Burt, Reference Burt2007). Individual competence, history, and good fortune play their part in the performance variables predicted by network brokerage, but leadership has been a frequent theme. Burt et al. (Reference Burt, Reagans and Volvovsky2021) use as their dependent variable—and we follow their approach—the extent to which teammates cite a participant as team leader. No team has a designated leader. The hypothesis is that the teammate who most brokers communication within the team is more likely to be cited as team leader. Perceptions of leadership emerge over the course of the experiment as members exchange messages and converge on shared labels and phrases to describe the symbols. Communication unfolds along multiple task-relevant dimensions, including gathering guesses from teammates, soliciting input from those not directly connected, conveying information across contacts, offering one's own interpretations, and identifying themes across the words and phrases proposed. Leadership, in this context, derives from the use of the available network connections to enable collaboration and consensus (Carter et al., Reference Carter, DeChurch, Braun and Contractor2015). Figure 1 shows that participants are surveyed after the 5th, 10th, and final trial. The final survey included a screen of background information on the participant (gender, age, education, and a textbox for any feedback the participant wanted to share about the experiment). If a team quit the experiment before the 15th trial, teammates were asked to complete the final (“exit”) survey before they left.
In each survey, a participant is asked, “Did your group have a leader? If so, who?” A participant can cite any teammate with whom the participant has contact, including the participant him or herself. Given five teammates, asked three times, a participant can receive up to 15 citations as team leader. The final result is a skewed distribution, much as leadership is observed in organizations. A few people receive many leader citations. Many people receive few citations. Counts go from zero to 15 around a mean of .72, with a 2.28 standard deviation.
Participants who have no contact with a person have no grounds for citing the person as team leader, so it makes sense to limit citations to teammates with whom a participant has contact. But the limitation means that an essential control in predicting citation volume is the number of citations for which an individual is eligible (five for participants assigned to positions 1, 4, and 5 in Figure 2; four for assignees to position 2, three for assignees to positions 3 or 6, and two for assignees to position 7).
Also, participants are not forced to cite someone. Alternative responses are “We worked as a team” or “Our team did not have a leader.” Of 465 participants, 29 never expressed a view on leadership. The other 436 participants responded to one, two, or all three surveys for a total of 1,041 survey responses. Counts of team citations available vary from zero to 15 around a mean of 3.60, with a 4.11 standard deviation. A person who receives three citations when 15 are available is less obvious a leader than a person who receives three citations when only five are available. For simplicity, we control for available cites by predicting the percentage of available cites a participant receives. Percentage of cites is computed by dividing number of cites received by number of cites available and multiplying by 100 (setting to zero any participant in a team within which no one was cited as leader).
The general phrasing of our leadership question permits respondents to define leadership in a relationship-specific manner (Contractor et al., Reference Contractor, DeChurch, Carson, Carter and Keegan2012). By limiting leadership nominations to direct contacts, we capture perceptions of leadership as they arise within the immediate relationships that define an individual's position in the team's network. This is not to suggest that an individual could not hear about or observe the leadership efforts of someone to whom they are not directly connected, particularly outside the short-lived, online teams examined here.
3. Behavior during the experiment
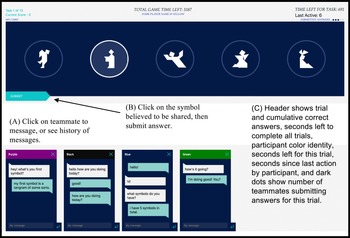
Figure 3 shows the participant-machine interface. Displayed across the bottom of the screen are teammates in contact with the participant. Click on a teammate to send a message to the teammate (point A in Figure 3). The interface in Figure 3 displays four teammates, so it is for a participant assigned to the hub position in a Wheel network, or any position in a Clique network (respectively positions 1 and 5 in Figure 2). At the other extreme, a participant assigned to position 7 would have only one teammate displayed.
Participant-machine interface.

Figure 3 Long description
The screenshot displays a participant-machine interface designed for a team-based task. At the top, there is a header showing the task number, current score, total game time left, time left for the task, and the participant's last active time. Below the header, there are five circular icons, each containing a different abstract shape or symbol. An arrow points to a submit button, indicating the action to be taken after selecting a symbol. On the left side, there are chat windows for different teammates, each with a distinct color and messages exchanged between them. The chat windows show messages related to the symbols and coordination within the team. The interface is designed to facilitate communication and collaboration among team members to complete the task effectively.
The five tangrams in the participant's current hand are displayed across the top of the screen. To submit a guess about the symbol all teammates share, click on the symbol, then click on the submit button (point B in Figure 3). The selected symbol is circled after it has been selected. Across the top of the screen are bits of information to encourage participants to move along (point C in Figure 3). When the time for this trial runs out (1/15 of the one-hour total experiment time), a bell sounds once to indicate that further time on this trial is coming from the budget for subsequent trials.
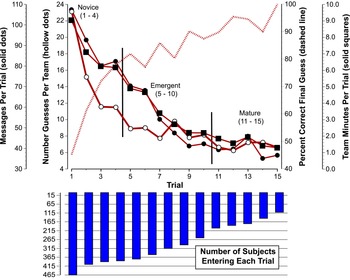
Three stages in team life.

Figure 4 Long description
The image contains a combination of line graphs and a bar graph. The line graphs depict the number of guesses per trial, messages per trial, and the percentage of correct final guesses over 15 trials. The bar graph shows the number of subjects entering each trial. The line graphs have three distinct phases labeled as Novice, Emergent, and Mature, each representing different trial ranges. The number of guesses per trial decreases significantly from the Novice to the Mature phase. The messages per trial also show a downward trend, though with some fluctuations. The percentage of correct final guesses increases over time, indicating improved team performance. The bar graph indicates a consistent number of subjects entering each trial, with slight variations. All values are approximated.
3.1 Team development during the experiment
As teammates complete trial after trial, they develop jargon distinguishing the tangrams, which allows them to communicate more quickly with fewer words and more certainty (Weber and Camerer, Reference Weber and Camerer2003; Burt and Reagans, Reference Burt and Reagans2022). The most common jargon words used to identify the tangrams at the top of Figure 1 are respectively “kicker,” “bunny,” “priest,” “falling,” “kneeling,” and “sitting”—but more often than not, different teams converge on different jargon labels (Reagans et al., Reference Reagans, Burt and Liu2026). Team network structure affects the ease with which teammates coordinate on language (Reagans et al., Reference Reagans, Volvovsky and Burt2023), and individual leadership emerges in the process (Burt and Reagans, Reference Burt and Reagans2022).
Learning curves are evidence of these processes at work, and Figure 4 shows learning curves for our teams. Trial is displayed across the horizontal axis. Across trials, teams more quickly complete trials (solid squares), with fewer messages (line with solid dots), fewer guesses about the shared symbol (hollow dots), and more often correctly guess the shared symbol (dashed line). The initial trial averages 100 or more messages within a team over a period of several minutes. Final trials average half as many messages over a period of a minute or two.
At the same time that teammates are learning to work together, they are running out of energy and patience. The experiment requires cognitive effort, and its deliberate communication difficulties can be frustrating. Many participants quit before completing 15 trials. When a participant becomes inactive—by not submitting a guess about the team's shared symbol—the participant's team is terminated. Participants are told at the beginning that they will not be paid if they become inactive during the experiment. Given one or more participants inactive, the other participants on the team are shown the leadership and exit surveys then paid for their time (e.g., participation for 30 minutes would earn half the hourly rate). In the graph at the bottom of Figure 4, participants are dated by the trial in which they sent or received their final message. The experiment begins with 465 participants in 93 teams. It ends in the 15th trial with 110 participants in 22 teams. We include this “maximum trial” variable as a control in our predictions since participants who complete more trials are more likely to have a sense of one another's ability and can be cited more often as team leader.Footnote 3
With an eye to testing the robustness of our conclusions, we distinguish three stages of team development in Figure 4: novice, emergent, and mature. Teams that expire in the first four trials expire as novice teams. Participants here did not come together as a team. The 18 teams that expired in the first four trials include the eight participants who never sent messages, the four who never sent or received messages, and the 29 who did not respond to the survey. The two trials with the highest death rates are the first trial, from which 60 participants do not continue (13% of the initial 465 participants), and the 10th trial, from which 55 participants do not continue (19% of the 295 participants still active going into the 10th trial). The 10th trial is a watershed. Teams that survive past the novice stage continue to rapidly improve (steep learning curves at the top of Figure 4) up to the survey at the end of the 10th trial, after which there is no statistically significant improvement.Footnote 4 We refer to the 48 teams in the final trials as “mature” and the 27 that expired in the preceding post-novice trials as “emergent” and use the distinction as a control.Footnote 5
3.2 Behavioral network during the experiment
In the process of communicating with one another, teammates can change from treatment network to which they were assigned into a behavioral network that emerges during the experiment. We measure behavior with message frequency. The strength of the behavioral connection from teammate i to teammate j is the number of messages i exchanged with j during the experiment.Footnote 6 Since participants are often prohibited in treatment networks from communicating with certain teammates, constraint in a participant's treatment network is strongly correlated with constraint in the participant's behavioral network (r = .964).
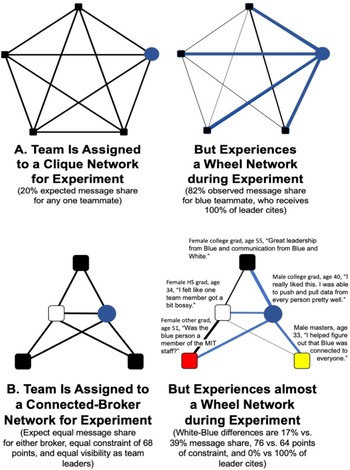
Nevertheless, behavioral deviations can be substantial. Figure 5A contains an example that Burt and his colleageus (Burt et al., Reference Burt, Reagans and Volvovsky2021) discuss to explain their exploration beyond treatment networks to behavioral networks. Thicker lines indicate more frequent messages. Within a Clique network, no one stands out as leader. All connections are open, so each teammate would be expected by random chance to be involved in 40% of team messages (20% of messages as sender and 20% of messages as recipient). In contrast, the behavioral network in Figure 5A shows that the blue circle teammate dominated communication (82% of team messages). As a result of frequent teammate messaging with the blue circle, there was less time for messages between teammates, so behavioral connections between teammates are relatively weak. The result is that the blue circle is less constrained behaviorally than he or she would have been in the assigned Clique network. The teammates are more constrained because of their concentrated interaction with the blue circle teammate. Thus, the team—assigned to a Clique network—in fact operated within a behavioral Wheel network. The result is that teammates gave 100% of their leadership citations to the blue circle. If we evaluate our prediction with the treatment network, which is fully connected, the team should not provide support for our hypothesis—because no one team member is a broker in a fully connected network so no one should receive a disproportionate share of leader cites. When evaluated with the behavioral network, this team should provide strong support for the hypothesis—because the one network broker in the team (blue dot) receives all leadership citations.
Figure 5B contains an example from our analysis. The team in Figure 5B was assigned to a connected-broker network. Two brokers in the center of the sociogram are positioned equally to communicate with one another while brokering connections between three teammates. Through more active messaging indicated by thicker lines in the behavioral network, the Blue-circle broker (a college-educated male 40 years old) dominated the White broker (a woman of 34 years with a high school education). Comments from the exit interview offer snippet description of behavior during the experiment. Blue clearly felt in charge: “I was able to push and pull data from every person pretty well.” Yellow and Black teammates saw that leadership. Their message connections with Blue are stronger than their connections with White, and Black concludes, “Great leadership from Blue.” The Red teammate had frequent messaging with both brokers, White and Blue. Red was the only person on the team who did not cite Blue as team leader (claiming in the initial survey that “We worked as a team”). Finally, one's heart goes out to the woman assigned to the White broker position, who lamented at exit, “I felt like one team member got a bit bossy,” presumably a reference to Blue. Of 14 leader citations made in the team, all 14 go to Blue.Footnote 7
Assigned versus behavioral networks (non-compliance in a network experiment).

Figure 5 Long description
The diagram illustrates the difference between assigned and behavioral networks in a team experiment. It shows two scenarios: one where a team is assigned to a clique network and experiences a wheel network, and another where a team is assigned to a connected-broker network and experiences almost a wheel network. The diagram includes labels for different network structures and notes on message share, leader cites, and participant feedback.
4. Network effect confounded
Behavioral deviation from assigned treatment networks is a form of non-compliance, which is a familiar problem in social science experiments. Participants assigned to a Clique network were expected from the equal availability of teammates to interact equally with all teammates. But sometimes one teammate became the focus of attention (Figure 5A). Similarly, students often get different benefit from a program depending on how they engage program content (Orosz et al., Reference Orosz, Proteasa and Craciun2021), policemen instructed in an experiment to respond in specific ways to specific circumstances, sometimes adapt their response to what they believe is appropriate to the situation (Angrist, Reference Angrist2006), medical treatment can vary with facilities available in the closest available hospital during an emergency (McClellan et al., Reference McClellan, McNeil and Newhouse1994), and management interventions can involve participants absent or uninvited (Carnabuci and Quintane, Reference Carnabuci and Quintane2023).
Strictly speaking, behavioral deviation in a network experiment is not usually a failure to comply. It is a result of failure to define treatment networks at a behavioral level. Treatment networks are usually defined in terms of potential behavior, not actual behavior. Certain pairs of people are allowed to communicate, which we indicate with a line between communicators (Figure 2). How a participant distributes communication across available alternatives is undefined—which is appropriate, even necessary, if social interaction during the experiment is to resemble at all social interaction outside the experiment. Rather than discussing behavioral deviation from treatment networks as non-compliance, we discuss it for its potential to obscure treatment-network effects, confounding exogenous treatment with endogenous behavior.
Predicting leader citations received

Table 1 Long description
The table presents data on predicting leader citations received across four models labeled A, B, C, and D. It includes rows for cites available, eligible to cite, last active trial, constraint personal network, constraint treatment network, constraint behavioral network, behavioral deviation, and intercept. Each model has corresponding values and test statistics in parentheses. Model A shows a cites available value of 0.17 with a test statistic of 10.28, eligible to cite value of 6.56 with a test statistic of 5.64, last active trial value of 0.33 with a test statistic of 1.15, constraint personal network value of 3.85 with a test statistic of 0.86, constraint treatment network value of 23.47 with a test statistic of 5.18, constraint behavioral network value of 71.93 with a test statistic of 3.15, behavioral deviation value of 1.19 with a test statistic of 3.32, and intercept value of 70.24. Model B shows a cites available value of 0.17 with a test statistic of 10.28, eligible to cite value of 6.84 with a test statistic of 6.03, last active trial value of 0.28 with a test statistic of 0.95, constraint personal network value of 3.07 with a test statistic of 0.67, constraint treatment network value of 43.96 with a test statistic of 1.93, behavioral deviation value of 0.078 with a test statistic of 4.83, and intercept value of 92.63. Model C shows a cites available value of 0.17 with a test statistic of 10.28, eligible to cite value of 7.36 with a test statistic of 6.29, last active trial value of 0.30 with a test statistic of 1.03, constraint personal network value of 2.58 with a test statistic of 0.57, constraint treatment network value of 25.65 with a test statistic of 5.80, behavioral deviation value of 0.078 with a test statistic of 4.83, and intercept value of 82.51. Model D shows a cites available value of 1.02 with a test statistic of 8.78, last active trial value of 0.04 with a test statistic of 1.87, constraint personal network value of 0.46 with a test statistic of 1.84, constraint treatment network value of 1.62 with a test statistic of 11.01, and intercept value of 1.51. The R-squared or Pseudo R-squared values for models A, B, C, and D are 0.20, 0.24, 0.26, and 0.63, respectively.
Note: Estimated across 464 participants (one did not complete pre-experiment network), models A through C are OLS regressions predicting percent of leader citations, and model D is a Poisson regression predicting number of leader citations. Test statistics in parentheses are estimated using Stata “vce(cluster team)” option.
4.1 Confounding during the experiment
Results in Table 1 show that the confounding is statistically significant. The table contains regression models predicting the leader citations participants received. We are exploring alternative model specifications for a dependent variable heterogeneous across treatment categories, so we report robust standard errors. Table 2 contains means, standard deviations, and correlations. There are interesting variations to be noted in Table 1, but the core result is that we replicate the Burt et al. (Reference Burt, Reagans and Volvovsky2021) finding that behavioral networks provide stronger prediction than treatment networks.
Treatment networks have their own strong effect on perceived leadership. Model A in Table 1 shows a strong continuous effect from network constraint ( $\beta = -23.47$
,
$\beta = -23.47$
, $t = -5.18$
,
$t = -5.18$
, $P \lt .001$
): A one-unit increase in log network constraint is associated with a 23% drop in percent leadership cites. That is the difference between 25 and 68 points of network constraint, which is a transformation from being the hub in a Wheel network to being one of the two brokers in a Connected-Brokers network (25 points of constraint on the hub position in Figure 2, 68 points of constraint on position 4). Percent leader citations is independent of a participant's pre-experiment network (
$P \lt .001$
): A one-unit increase in log network constraint is associated with a 23% drop in percent leadership cites. That is the difference between 25 and 68 points of network constraint, which is a transformation from being the hub in a Wheel network to being one of the two brokers in a Connected-Brokers network (25 points of constraint on the hub position in Figure 2, 68 points of constraint on position 4). Percent leader citations is independent of a participant's pre-experiment network ( $\beta = 3.84$
,
$\beta = 3.84$
, $t = 0.86$
,
$t = 0.86$
, $P = .394$
), and how many trials the participant completed (
$P = .394$
), and how many trials the participant completed ( $\beta = .32$
,
$\beta = .32$
, $t = 1.15$
,
$t = 1.15$
, $P = .252$
). As expected, the control for eligible teammates is important: Participants who have more people eligible to cite them receive a higher share of team leader citations (
$P = .252$
). As expected, the control for eligible teammates is important: Participants who have more people eligible to cite them receive a higher share of team leader citations ( $\beta = 6.55$
,
$\beta = 6.55$
, $t = 5.64$
,
$t = 5.64$
, $P \lt .001$
).
$P \lt .001$
).
Means, standard deviations, and correlations

Table 2 Long description
The table presents data on means, standard deviations, and correlations for several variables related to network metrics. It includes eight variables: Leader cites, Cites available, Percent of available leader cites, Eligible to cite, Last active trial, Constraint personal network, Constraint treatment network, Constraint behavioral network, and Behavioral deviation. Each variable is listed with its mean, standard deviation, and correlations with other variables. Notable correlations include a strong positive correlation between Percent of available leader cites and Cites available, and a strong negative correlation between Constraint behavioral network and Constraint treatment network.
Note: Results are computed from data on 464 subjects (one subject did not provide his pre-experiment network). “Leader cites” is number of cites received. “Cites available” is total leadership cites in team. “Percent cites” is 100 times the ratio of leader cites received over leader cites available in a team. The ratio is zero for subjects who received zero cites regardless of how many cites were available in the team. “Eligible to cite” is number of people who could cite participant. “Last active trial” is the last trial in which participant sent message.
Replicating Burt et al. (Reference Burt, Reagans and Volvovsky2021), we add the behavioral network in Model B, which dominates the treatment network. The effect coefficient increases from −23.47 for treatment network in Model A to −71.93 ( $t = -3.15$
,
$t = -3.15$
, $P \lt .001$
) in Model B for the behavioral network.
$P \lt .001$
) in Model B for the behavioral network.
But Model B results are complicated by multicollinearity. Behavioral networks are closely patterned by treatment networks, so constraint in the one is correlated with constraint in the other (.96 correlation between raw scores and .97 correlation between log scores in Table 2). Percent of leader cites is correlated −.39 in Table 2 with constraint from a participant's assigned network position and has a slightly stronger −.42 with constraint from a participant's behavioral network. The difference is small, but combined with the high correlation between the two predictors, there is significant multicollinearity between the two network predictors (VIF scores of respectively 17.50 and 17.19), which is manifest as the strong negative association in Model A between leader cites and treatment-network constraint reversing into a positive association in Model B ( $\beta = 43.96$
,
$\beta = 43.96$
, $t = 1.93$
,
$t = 1.93$
, $P \lt .10$
).
$P \lt .10$
).
To clarify what behavioral networks add to the prediction, Model C is the Model B prediction with the behavioral measure replaced by a measure of the extent to which constraint in the behavioral network differs from constraint in the treatment network. The variable “behavioral deviation” is a participant's behavioral constraint score minus the participant's treatment constraint score. For example, the Blue participant in Figure 5A was assigned to a position in a Clique, so constraint from Blue's assigned treatment network is 77 points (Figure 2 box). During the experiment, Blue messaged extensively, which consumed teammate time, so teammates had less time to message one another, which weakened the behavioral connections between Blue's contacts such that constraint on Blue decreased to 42 points. Behavioral deviation for Blue is therefore 42 minus 77, or −35 points. Blue is less constrained during the experiment than is implied by his assigned treatment network. Simultaneously, the teammates are more constrained because Blue is so central in their individual networks. For example, behavioral deviation is 93 minus 77 for the left-most teammate in Figure 5A, creating 16 points of increased constraint.Footnote 8
Model C is a conservative test for prediction from the behavioral network in that the joint effect of treatment and behavior is credited to treatment networks. Model C shows the expected negative effect of treatment-network constraint on leadership cites ( $\beta = -25.65$
,
$\beta = -25.65$
, $t = -5.80$
,
$t = -5.80$
, $P \lt .001$
). Behavioral deviation treatment also affects the perception of leadership (
$P \lt .001$
). Behavioral deviation treatment also affects the perception of leadership ( $\beta = -1.19$
,
$\beta = -1.19$
, $t = 3.32$
,
$t = 3.32$
, $P \lt .001$
). The more that a participant's behavioral network decreases treatment constraint—as in the case of Blue just discussed—the more teammates cite the participant as team leader. We get the same pattern of results if we limit estimation to the 240 participants whose teams matured to the final trials of the experiment (Figure 4). In fact, the test statistic for the behavioral network effect is about the same (
$P \lt .001$
). The more that a participant's behavioral network decreases treatment constraint—as in the case of Blue just discussed—the more teammates cite the participant as team leader. We get the same pattern of results if we limit estimation to the 240 participants whose teams matured to the final trials of the experiment (Figure 4). In fact, the test statistic for the behavioral network effect is about the same ( $\beta = -2.21$
,
$\beta = -2.21$
, $t = -4.54$
,
$t = -4.54$
, $P \lt .001$
) despite the decreased number of participants. We get the same pattern of results when we use a Poisson regression model to predict the number of leader cites a participant receives, holding constant the number available. Failure to behaviorally wiggle free of treatment constraint decreases the frequency with which a participant is cited as team leader (
$P \lt .001$
) despite the decreased number of participants. We get the same pattern of results when we use a Poisson regression model to predict the number of leader cites a participant receives, holding constant the number available. Failure to behaviorally wiggle free of treatment constraint decreases the frequency with which a participant is cited as team leader ( $\beta = -.08$
,
$\beta = -.08$
, $t = -4.83$
,
$t = -4.83$
, $P \lt .001$
). In short, and as expected, behavioral networks offer prediction stronger than is provided by treatment networks or participant networks pre-experiment.
$P \lt .001$
). In short, and as expected, behavioral networks offer prediction stronger than is provided by treatment networks or participant networks pre-experiment.
4.2 Confounding brought into the experiment
More, behavioral deviation is associated with the network a participant brings into the experiment. Random assignment eliminates direct effects on leader perception (negligible effects in Table 1 for pre-experiment network). However, a closed network pre-experiment is associated with behavioral deviation from treatment networks, which in turn does affect leader perception. Regressing behavioral deviation over personal network constraint yields a modest, statistically significant association ( $t = -2.05$
,
$t = -2.05$
, $P \lt .04$
,
$P \lt .04$
, $N = 464$
). The association is weak, but it is strong enough to reject independence, which is enough to say that random assignment to treatment networks did not eliminate network behavior confounded with pre-experiment networks.
$N = 464$
). The association is weak, but it is strong enough to reject independence, which is enough to say that random assignment to treatment networks did not eliminate network behavior confounded with pre-experiment networks.
The negative correlation says that participants who enter the experiment with more closed networks—that is, participants who discuss important matters within a clique of people who frequently speak with one another—are more likely to inundate teammates with messages, which weakens connections between teammates (Cook et al., Reference Cook, Emerson, Gillmore and Yamagishi1983), which lowers the network constraint on the participant, allowing him or her to operate more as a network broker, thereby increasing the odds that he or she is perceived by teammates as the informal team leader. Figure 5A and B are illustrative examples.Footnote 9
One might expect a participant to re-create in the experiment the network he or she brings into the experiment. Participants in closed networks pre-experiment, for example, might be expected to generate closed behavioral networks, which would generate a positive correlation between behavioral deviation and pre-experiment network constraint. The opposite happens because pre-experiment habits are filtered through treatment networks fixed in size and structure. Assigned to a Clique treatment network, for example, a participant entering with a closed network and attempting to create a shared network during the experiment absorbs teammate time, which leaves less time for messaging between the teammates, thereby shifting the assigned Clique network toward a Wheel network (e.g., Figure 5A).Footnote 10 However, in order for a Wheel network to emerge team members must concede the central position. As stated in the introduction, we are not studying teams in which boundaries around can be manipulated by recruiting new members or ostracizing unwanted members. Relevance to life outside the experiment is still there. There are certainly occasions in organizational life during which a fixed set of people are obligated to work as a team. Most of us with a decade or two of experience have worked on teams where one or a few individuals dominate the conversation—often to the discomfort of their teammates. That is the situation illustrated in Figure 5.
5. Estimated network effect
The above results establish endogeneity despite random assignment to treatment networks. The treatment networks to which participants were assigned at random are (1) measured with error during the experiment (difference between treatment and behavioral network) and (2) that error is correlated with the dependent variable (better prediction from the behavioral network) and the network a participant brings into the experiment.
Fortunately, the problem with confounded effects in network experiments is easily solved, though solving it has not been common practice (Carnabuci and Quintane (Reference Carnabuci and Quintane2023) for a recent exception). Table 3 contains three estimates of the network effect, $\eta$
, for the hypothesis that network brokers tend to be perceived as leaders. The dependent variable is the percent of team leader citations a participant receives. The network predictor is log network constraint. All three estimates include the controls in Table 1 (number of people eligible to cite participant, last active trial, and ln constraint in the participant's network pre-experiment).
$\eta$
, for the hypothesis that network brokers tend to be perceived as leaders. The dependent variable is the percent of team leader citations a participant receives. The network predictor is log network constraint. All three estimates include the controls in Table 1 (number of people eligible to cite participant, last active trial, and ln constraint in the participant's network pre-experiment).
The first estimate in Table 3 is from the positions in treatment networks to which participants were randomly assigned. This corresponds to the network effect in Model A for treatment networks in Figure 2. The virtue of this estimate is that it is based on network structure most clearly exogenous to the dependent variable. There is no self-selection into networks.
Estimates of network effect, $\eta$

Table 3 Long description
The table presents estimates of network effect for the hypothesis that network brokers tend to be perceived as leaders. It includes three rows and two columns. The columns are labeled 'Coefficient' and 'Robust S.E.'. The rows are labeled 'Assigned treatment network', 'Behavioral network', and 'Instrumented behavioral network'. The coefficients are -23.47, -28.18, and -25.04 respectively, with robust standard errors of 5.18, 6.15, and 5.24. The table provides a comparison of these network effects, highlighting the differences in their impact on the dependent variable, which is the percent of team leader citations a participant receives.
Note: Estimates are for the network effect of the row predicting the percent of team leadership cites a subject receives. Network predictor is log network constraint. Percent cites is 100 times the ratio of leader cites received over leader cites available in a team. The ratio is set to zero for subjects who received zero cites regardless of how many cites were available in the team. Estimate in first row corresponds to Model A in Table 1. All three estimates include the controls in Model A (number of people eligible to cite participant, last active trial, and ln constraint in the participant's network pre-experiment). Test statistics in parentheses are estimated using Stata “vce(cluster team)” option.
Network brokerage triggers citations for team leadership.

Figure 6 Long description
A line graph illustrates the relationship between the percentage of leader citations and the level of constraint assigned at random to a person. The x-axis represents the level of constraint, ranging from 0 to 100. The y-axis represents the percentage of leader citations, ranging from 0% to 100%. A red line shows a downward trend, indicating that as the level of constraint increases, the percentage of leader citations decreases. The equation Y-hat = 119.75 - 25.04 ln(X) is displayed, suggesting a logarithmic relationship. The graph includes annotations for instrumented behavioral network constraint, with diagrams showing many structural holes and few structural holes. Arrows labeled TC, BC, and eta indicate the flow of the model used to estimate network effects. The text below the graph explains that the horizontal axis is the level of constraint assigned at random, and the vertical axis is the predicted percentage of leader citations triggered by that level of constraint. The solid line represents the prediction across all assigned networks, with a unit increase in log constraint losing 25.04% votes. The path diagram shows the model used to estimate network effects from log assigned treatment constraint as an instrument predicting log behavioral constraint, with control variables included in e sub y. All values are approximated.
The problem with the row-one estimate is that effects estimated from the assigned networks are biased toward zero by behavioral deviation from assignment. Since the network of interpersonal behavior during an experiment is the actual network a participant experiences, it is not surprising that behavioral networks provide stronger prediction than assigned networks (Models B, C, D in Table 1), visible in the larger effect estimate in the second row of Table 3.
Self-selection is the problem with the row two prediction. Factors responsible for behavioral deviation can simultaneously affect the dependent variable, making statistical inference from behavioral networks ambiguous. The −28.18 coefficient in the second row of Table 3 is descriptively correct. For example, the Blue teammate in Figure 5A who created a Wheel network from his assigned Clique network is expected by the network hypothesis to be cited as team leader. But how much of the measured effect is due to the network versus omitted variables correlated with behavioral deviation?
Instrumental variables offer a familiar solution. The path diagram in Figure 6 is a simple example. The dependent variable is percent leader cites. The two network variables are log constraint in a participant's assigned treatment network (TC) and log constraint in the participant's behavioral network (BC). The instrumental-variable solution is in two steps: (1) Run an OLS regression predicting BC from TC to separate behavioral-network constraint into two independent parts: the part predictable from random assignment (BC hat) and a residual term (ex) due to measurement error and self-selection variables. (2) Step two is to regress the dependent variable over BC hat to obtain an unbiased estimate of the network effect, $\eta$
. Assigned treatment networks are being used as an instrumental variable predicting leader cites indirectly through behavioral networks. Two qualities asked of an instrument are high correlation with the variable being corrected for bias (.97 correlation between assigned and behavioral network constraint) and no correlation with error in the dependent variable (participants are randomly assigned to the networks being used as an instrument). The network effect,
$\eta$
. Assigned treatment networks are being used as an instrumental variable predicting leader cites indirectly through behavioral networks. Two qualities asked of an instrument are high correlation with the variable being corrected for bias (.97 correlation between assigned and behavioral network constraint) and no correlation with error in the dependent variable (participants are randomly assigned to the networks being used as an instrument). The network effect, $\eta$
, is the effect on the dependent variable of behavioral-network variation that can be predicted from the treatment networks assigned at random.
$\eta$
, is the effect on the dependent variable of behavioral-network variation that can be predicted from the treatment networks assigned at random.
In Table 3, the network effect estimated with instrumented behavioral networks is substantial and statistically significant ( $\beta = -25.04$
,
$\beta = -25.04$
, $t = -5.24$
,
$t = -5.24$
, $P \lt .001$
). The first-stage estimate of the effect of assigned network position (ln constraint treatment network) on the observed behavioral network (ln constraint behavioral network) is large, as expected (
$P \lt .001$
). The first-stage estimate of the effect of assigned network position (ln constraint treatment network) on the observed behavioral network (ln constraint behavioral network) is large, as expected ( $\beta = .94$
,
$\beta = .94$
, $t = 70.62$
,
$t = 70.62$
, $P \lt .001$
). The network effect is plotted in Figure 6. A teammate loses about a quarter of team leader citations (25.04%) with a unit increase in log network constraint, say from 15 to 40 points of constraint. The regression line in Figure 6 increases sharply at low levels of network constraint, which are only reached in our experiment by the central hub position in the Wheel network. Of 23 participants assigned to the hub position in a Wheel network, 20 led teams in which one or more leader citations were available. One of the 20 hub participants received 92% of the leader cites. The other 19 received 100%.
$P \lt .001$
). The network effect is plotted in Figure 6. A teammate loses about a quarter of team leader citations (25.04%) with a unit increase in log network constraint, say from 15 to 40 points of constraint. The regression line in Figure 6 increases sharply at low levels of network constraint, which are only reached in our experiment by the central hub position in the Wheel network. Of 23 participants assigned to the hub position in a Wheel network, 20 led teams in which one or more leader citations were available. One of the 20 hub participants received 92% of the leader cites. The other 19 received 100%.
6. Conclusions
We conclude that there is a statistically significant link between network brokerage and leadership that can be causal. This does not say that it is always causal, but for the circumstances covered in this experiment, exogenous variation in network brokerage triggered recognition of leadership. Teammates perceive leadership in a person who brokers communication. Substantively, the causal effect is not surprising. However, our task in this paper was not to argue that the association exists (there are abundant field studies for that) but whether it could be causal. We replicate the descriptive results reported by Burt et al. (Reference Burt, Reagans and Volvovsky2021) and extend their analysis by using instrumented behavioral networks to estimate causal network effects, allowing for less ambiguous inference about network structure as a causal factor.
Table 3 presents three effect estimates. Predicting from assigned treatment networks yields estimates biased toward zero by behavioral deviation. Predicting from behavioral networks yields the strongest estimates of effect, but the effect is ambiguous—some unknown part structurally induced by network assignment and some unknown part due to endogenous processes during the experiment. Our unbiased estimates lie between the alternatives, stronger than prediction from assigned treatment networks, weaker than prediction from behavioral networks. All of the network-effect estimates in Table 3 are statistically significant beyond a .001 level of confidence, but the estimate that provides the clearest evidence of causal effect is the one obtained with instrumented behavioral networks, showing that a quarter of teammate leader cites are lost with a unit increase in log instrumented behavioral-network constraint, say from 15 to 40 points of constraint ( $\beta = -25.04$
).
$\beta = -25.04$
).
Our results have important implications for future research using social network experiments. Random assignment is the gold standard in experimental design. Random assignment limits the influence of individual differences on treatment assignment but not on treatment response. In our context, random assignment eliminates the influence of individual differences on treatment network assignment, yet those same differences can shape the behavioral network that emerges from an assignment. We used the assigned treatment network as an instrument for the behavioral network to estimate causal network effects. Our results show that causal network effects can be identified even when endogeneity is present.
We also considered the influence of the pre-experiment networks on the behavioral networks observed during the experiment. Individual differences reflected in pre-experiment networks correlate with behavioral deviations from assigned networks, but they do so in unanticipated ways. Participants who enter the experiment with closed networks sometimes assert control over communication channels, creating brokerage roles for themselves while relegating others to peripheral positions. Yet not all participants who begin with closed networks experience this outcome. The surprising association between pre-experiment networks and behavioral network constraint reflects the fact that relationships—and therefore the behavioral networks that emerge during the experiment—are influenced by individual choices and decisions but are also jointly constituted, reflecting more than the actions of any single individual (Anjos and Reagans (Reference Anjos and Reagans2013); Prell and Lo (Reference Prell and Lo2016)). Network positions—and the effects that follow from them—arise from interdependent behavior rather than isolated strategic choice, showing how network effects that lie beyond the control of any one individual can emerge through, rather than despite, the exercise of individual agency.
We have outlined a basic approach for estimating causal network effects in laboratory settings. The same logic extends to the field through encouragement designs that randomly assign individuals to different network opportunities. Burt's theory of structural holes highlights the value of relationships that bridge disconnected groups, where gaps in network structure create variation in information access and control. In field settings, such variation can be operationalized through treatments that provide opportunities to form either bridging or redundant relationships. Framed in terms of information redundancy, individuals who move within the same group or social circle are likely to share similar knowledge and information, even when they are not directly connected. Within an organizational context, treatment can therefore be defined with respect to redundancy: one condition provides access to nonredundant sources of knowledge and information, while another provides access to redundant sources (Wu, Reference Wu2013). Such designs make it possible to identify causal network effects and to examine how individual differences shape responses to network formation opportunities when the structure and informational value of potential relationships are experimentally varied (Carnabuci and Quintane, Reference Carnabuci and Quintane2023).
Looking beyond the immediate findings, our results suggest that causality in networks extends beyond the exogenous assignment of structure. Behavioral deviations can themselves represent a kind of causal network effect because the networks that emerge through interaction are collective outcomes rather than the product of any single individual's intent. The assigned network constrains the range of possible relationships, but the behavioral network that materializes reflects how participants jointly adapt and respond within those constraints. In this sense, endogenous variation in enacted ties can have structural effects of their own, revealing how network effects can arise not only from structural assignment but also from the behavioral network that emerges from the interdependent choices and decisions of multiple individuals.
Acknowledgements
This work was made possible by financial support from the University of Chicago Booth School of Business for data-processing software and financial support from MIT Sloan for transitioning our earlier experiment to the more flexible Empirica platform and funding the experiment trials on which we report here. Supervised by the two lead authors, the third author conducted the transition to Empirica and managed the experiment. We are grateful to Ross Stolzenberg for his helpful comments during the analysis and to Matthew Bothner and Eric Quintane for their comments on the manuscript.
Data availability statement
The data that support the findings of this study are available from the corresponding author, Ray E. Reagans, upon reasonable request.
Funding statement
This work was supported by the University of Chicago Booth School of Business for data-processing software and by MIT Sloan for transitioning the earlier experiment to the Empirica platform and funding the experiment trials reported here.
Competing interests
The authors declare none.










 η
η

 Open access

