


1. Introduction
In a world of increasing longevity and strained public finances, there is debate among academics (Andersen et al., Reference Andersen, Hansen and Kuchler2023; Beshears et al., Reference Beshears, Choi, Laibson, Madrian and Skimmyhorn2022; Thaler and Benartzi, Reference Thaler and Benartzi2004) and in media (BankRate, 2015; CBS, 2012; MoneyWeek, 2014) whether and how people should be incentivised, and potentially even forced, to save for retirement. But what empirical association does mandatory pension contributions have with individuals’ savings, and what is the cost of such forced savings? Despite extensive research, the answers remain unsettled in empirical research.Footnote 1
In this paper, we re-examine these questions using comprehensive register data from Denmark that allow us to overcome several challenges pointed out in the literature. There is, for instance, considerable heterogeneity across individuals that must be accounted for (Skinner, Reference Skinner2007; Poterba, Reference Poterba2015), as the level of adequate pension savings depends upon people’s desired level of consumption during retirement, their expected income during retirement, marriage status, housing equity, etc. Detailed microdata are used in this paper to address such concerns. Furthermore, some studies look at the heterogeneous wealth distribution of pensioners at retirement (Poterba et al., Reference Poterba, Venti and Wise2012a; The National Retirement Risk Index, 2019) or death (Poterba et al., Reference Poterba, Venti and Wise2012b) and conclude that a large fraction of the population does not save enough. These studies do not have information on people’s consumption (whereas we are able to impute it from microdata), implying that they do not answer whether people are able to maintain an adequate level of consumption during retirement. Alternatively, using simulations, Scholz et al. (Reference Scholz, Seshadi and Khitatrakun2006), Hurd and Rohwedder (Reference Hurd and Rohwedder2011), and Gomes et al. (Reference Gomes, Hoyem, Ravina and Hu2022) evaluate consumption during retirement. These papers typically indicate that a large majority of the population most likely saves enough to maintain their desired level of consumption during retirement, but this has not yet been confirmed in microdata on individuals’ actual pension savings at retirement.
To both complement and extend these studies, we revisit the question of pension savings adequacy and the role of mandatory pension savings using third-party-reported high-quality register information on the total sample of individuals who retire in 2016 in Denmark. A major advantage of using Danish register data to study savings adequacy is that it contains the actual pension savings of individuals at retirement, in addition to data on all other types of savings (outside pension savings in financial assets, cash, real estate, etc.) and income (labour income, public transfers including pension benefits, etc.).
To examine savings adequacy, we need to determine the level of wealth at retirement necessary to maintain a given lifestyle for the remaining expected lifespan. As discussed at length by Skinner (Reference Skinner2007), defining a saving gap is hard, as it requires a normative benchmark. We rely on Battistin et al. (Reference Battistin, Brugiavini, Rettore and Weber2009) and use a threshold of 90 percent of pre-retirement consumption, but we also include several tests using alternative thresholds. Consumption is imputed from the wealth and income data. Given expected longevity and a discount factor, we calculate the present value (at retirement) of consumption during retirement. We compare the present value of consumption to the sum of total wealth at retirement and discounted income during retirement.
We find that individuals who are forced to save for retirement through mandatory pension schemes have a higher probability of accumulating sufficient savings to maintain their pre-retirement consumption profile throughout retirement. In fact, we find that 85 percent of individuals retiring in 2016 can maintain 90 percent of their pre-retirement consumption, and mandatory pension contributions correlates strongly with this high fraction. In particular, we show that individuals who contribute to mandatory pension schemes are less likely to end up saving too little to maintain their pre-retirement consumption profiles. Similarly, we find that the 15 percent of the population who do not have enough savings at retirement to maintain their desired consumption profile during retirement are less likely to have mandatory pension savings and have not compensated for a lack thereof by sufficiently increasing voluntary private savings.
While mandatory pension savings seem to play an important role in securing pension-savings adequacy, there might be a price to pay when forcing people to save. We thus investigate how people react during their working years when forced to save more for retirement. Do they cut consumption during working years, cut savings outside retirement accounts, increase borrowing (even if not in full proportion to the increase in mandatory savings, cf. above), and so on? To address these questions, we rank people according to how much more they have been forced to save for retirement during a period when mandatory retirement contribution rates significantly increased for some groups of the Danish population (1996–2010). We contrast the responses of the 30 percent of the population who were forced to increase mandatory pension contributions the most (our treatment group) to the 30 percent of the population who faced the lowest increase in pension contributions (our control group). Individuals in the treatment group have seen their mandatory pension savings increase by close to 10 percentage points on average, that is, arguably a significant treatment, while individuals in the control group have seen only minor increases in mandatory pension savings over the same period. We compare the two groups in terms of consumption and accumulation of gross and net wealth during their working years.
In these estimations, we find that individuals forced to save more for pension have lower consumption growth during working years and accumulate less wealth, relative to the control group. Hence, our results indicate that increasing mandatory pension contributions to secure that people save enough for retirement comes at the cost of lower consumption and lower savings outside peoples’ pension account during the working age. The reduction in consumption is relatively modest, though – around 1 percent of total consumption. Even when we have no welfare criteria according to which we can evaluate the impact of this consumption reduction, it appears to be a relatively low cost of mandatory pension savings relative to the improvement in the likelihood of having saved enough to maintain a sufficient level of consumption during retirement.
Our paper contributes to a large literature that examines pension saving adequacy of individuals. We make three contributions to this literature. First, we relate to papers that use simulations to evaluate whether people can maintain a certain preferred consumption profile during retirement, such as Scholz et al. (Reference Scholz, Seshadi and Khitatrakun2006), Hurd and Rohwedder (Reference Hurd and Rohwedder2011), and Gomes et al. (Reference Gomes, Hoyem, Ravina and Hu2022). By having actual data on pension savings at retirement for the total sample of people retiring in a given year, we eliminate a significant dimension of uncertainty. This allows us to more sharply answer the empirical question of whether people have accumulated enough savings at retirement to maintain a certain desired level of consumption during retirement. Second, we relate to papers who study the size of peoples’ financial wealth at retirement, such as Poterba et al. (Reference Poterba, Venti and Wise2012a, 2012b) and The National Retirement Risk Index (2019), but who do not have access to data on the total composition of people’s wealth portfolios. Due to the richness of our data, we can incorporate data on other wealth components, such as housing equity, as well as income during retirement. This means that we do not base our conclusions on pension savings adequacy on the size of financial wealth only, but consider all types of wealth and income, which obviously matter for peoples’ possibilities of maintaining consumption in retirement. Finally, we contribute to the recent literature that studies whether people compensate for mandatory pension savings by accumulating debt. While there is agreement that forced retirement savings increase gross savings of individuals (Gelber, Reference Gelber2011; Poterba et al., Reference Poterba, Venti and Wise1995, Reference Poterba, Venti and Wise1996), there is disagreement about the degree of crowding out, that is, whether individuals decrease other savings or increase borrowing when forced pension savings increase. Beshears et al. (Reference Beshears, Choi, Laibson, Madrian and Skimmyhorn2022) argue that automatic enrolment into pension schemes lead to only little borrowing, while Andersen et al. (Reference Andersen, Hansen and Kuchler2023) find that it causes substantial mortgage borrowing. Chetty et al. (Reference Chetty, Friedman, Leth-Petersen, Nielsen and Olsen2014) report that there is heterogeneity within the population, such that some, but only a few, react to increased mandatory savings.Footnote 2 These papers do not evaluate whether mandatory pension savings in the end leave people with enough pension savings to maintain pre-retirement consumption or merely reduce a potential savings gap, though. While the distinction between mandatory pension plans, like the ones we study, that is, plans where savers cannot opt out, and automatic enrolment plans (such as those Beshears et al., Reference Beshears, Choi, Laibson, Madrian and Skimmyhorn2022 study), where participants have the possibility to opt out, is important for pension plan design, our paper shows that mandatory pension savings associate with an increased probability that people can maintain their pre-retirement consumption profile. This suggests that people forced to save for retirement do not take action to remediate this by increasing borrowing or lowering other types of savings in full proportion to the increase in mandatory savings.
The rest of our paper is structured as follows. Section 2 provides a short description of the Danish pension system, our data, and the key variables in our analysis. Section 3 examines savings adequacy and its relation to individuals’ contribution rates to mandatory and private pension schemes. Section 4 examines the cost of mandatory pension contributions. Finally, Section 5 concludes.
2. Data
Through Statistics Denmark, we have access to detailed register-based data containing individual-level information spanning the years 1995–2016.Footnote 3 Our analysis focuses on the pension savings of individuals retiring in 2016, the latest cohort available in our dataset. The data includes end-of-year information on individuals’ income, wealth, stock market participation, age, gender, level of education, and more. Most importantly, starting from 2014, the dataset provides information on each individual’s total wealth balance in pension accounts, enabling a comprehensive analysis of pension wealth adequacy.Footnote 4
Our analysis will be based on individuals retiring in 2016 and hence their total savings in year 2016. However, we will leverage the entire timespan of the dataset to estimate future income and consumption levels of each retiree. Before describing our data and methodology in detail, we provide a brief overview of the Danish pension system. For a more detailed description and analysis of the Danish pension system, see Andersen et al. (Reference Andersen, Jensen and Rangvid2022).
2.1. The Danish pension system
The Danish pension system is based on three ‘pillars’. The first pillar primarily consists of public old-age pensions, financed through general taxes, as well as a compulsory, defined-contribution pension scheme (known as ATP). By law, all wage earners and working-age individuals receiving social security benefits are required to contribute to ATP. Depending on working hours all contribute with the same monthly amount. While the contribution rates to ATP are relatively small (around 500 euros per year in 2024) and cannot independently ensure sufficiently high replacement rates for wage earners upon retirement, the scheme, when combined with the public pension, guarantees that all pensioners, regardless of their labour market history, receive a minimum basic income.
The second pillar is the main pillar of the Danish pension system and consists of occupational pension schemes. These schemes are voluntarily organized through collective agreements between labour market partners. They are fully funded, defined-contribution plans, with mandatory contribution rates for workers employed in the occupation covered by the agreements (Andersen et al., Reference Andersen, Jensen and Rangvid2022). The second pillar ensures that pensioners receive adequate pension coverage relative to their income during their working years.
The third pillar is fully private and consists of individual pension plans that are both flexible and voluntary. These plans include a broad range of voluntary personal life insurance and pension saving plans, typically managed though banks or insurance companies. Private pension schemes allow individuals to achieve their desired level of income during retirement and compensate for any insufficiencies in savings from the first and second pillars.
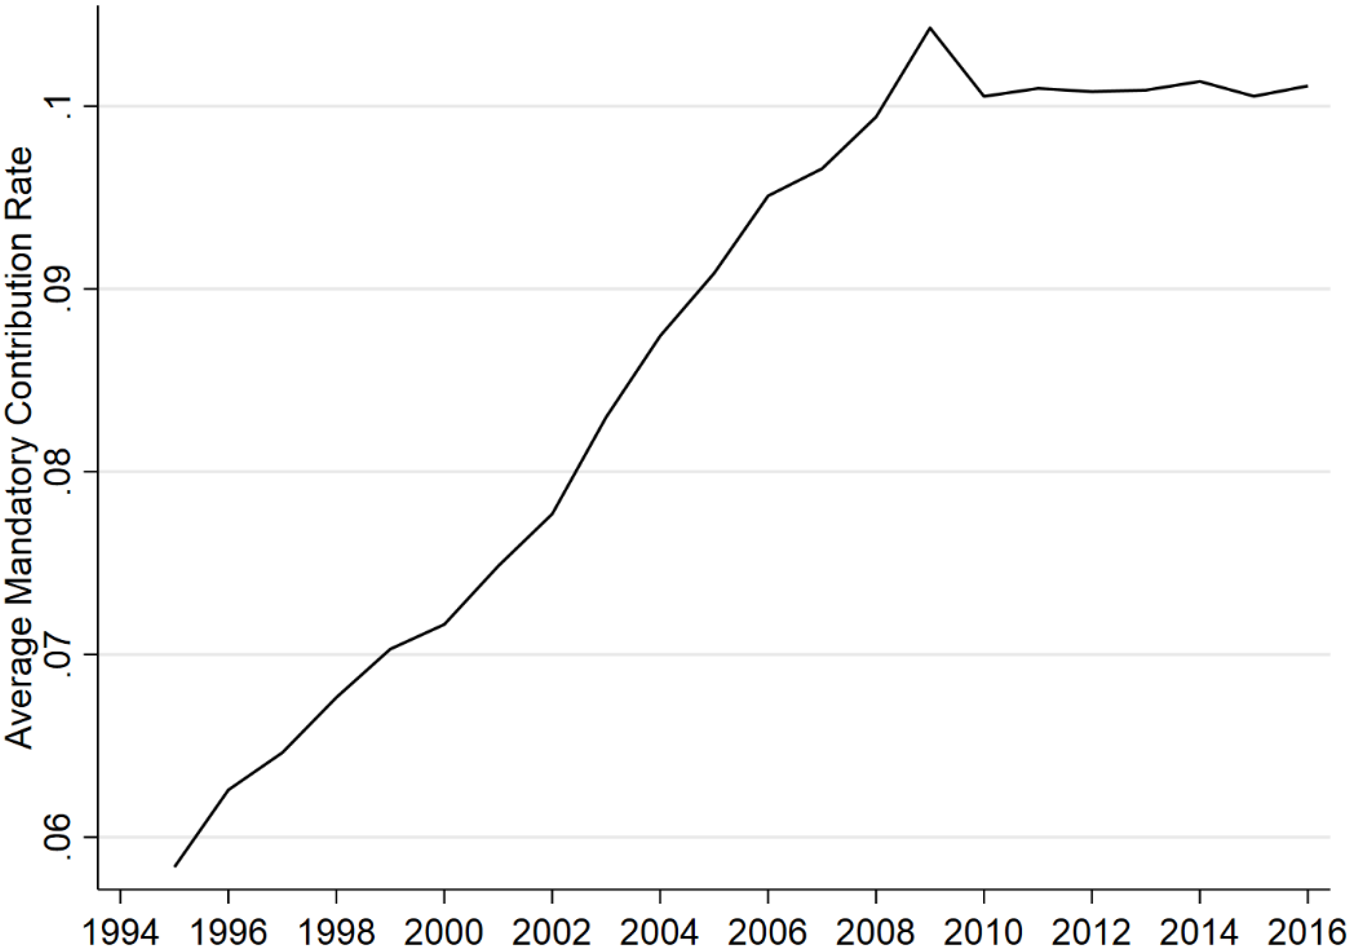
The current system was established in the 1980s, a period during which the Danish economy faced a general savings problem. After several years of negotiations, the labour market parties reached an agreement in 1991 to expand occupational pensions – previously primarily available to public employees – to include the private sector. Figure 1 shows how the average contribution rate to labour market pension schemes has developed from 1996 to 2016. It follows that the inclusion of the private sector to occupational pension schemes led to a significant increase in the average contribution rate.Footnote 5 On average, mandatory contributions have increased from approximately 6–11 percent. As highlighted in Chapter 2 of Andersen et al. (Reference Andersen, Jensen and Rangvid2022), the increase in the contribution rate varies across occupations. For some professions, such as economists, lawyers, nursery, and teachers, contribution rates have remained relatively stable and only increased from around 13–15 percent in the period from 1993 to 2009. In contrast, contribution rates for other segments of the labour market, such as blue- and white-collar industry workers, have seen substantial increases from close to 0 percent in 1993 to 12 percent in 2009. In our analysis in Section 4, we will exploit these differences.
Annual average contribution rate to labour market pension schemes.

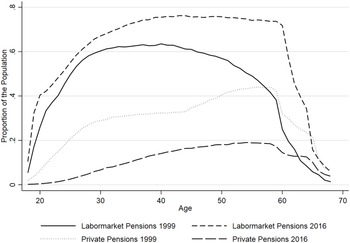
The increase in mandatory contribution rates to labour market pensions has also impacted the proportion of individuals contributing to private pension schemes, as illustrated in Figure 2, which compares the proportion of the population paying into private and labour market pension schemes, respectively. In 2016, nearly 80 percent of individuals above the age of 40 contributed to labor market pensions, compared to 60 percent in 1999. In contrast, approximately 18 percent of individuals contributed to private pension schemes in 2016, down from 30 percent in 1999. Hence, relative to 1999, a larger share of the population contributed to mandatory pension schemes in 2016, while fewer contributed to private pension schemes.
Proportion of population paying into private and labour market pension schemes, respectively, broken down by age.

While there were some notable pension reforms during this period, none introduced significant changes to the Danish pension system that should directly affect our analysis. A policy reform in 2006 introduced an automatic adjustment mechanism linking future retirement ages to increases in life expectancy. Another reform in 2011 tightened eligibility for early retirement schemes. Both reforms address the challenges raised by an aging population. We do take life expectancy into account in our analysis. In 2010, a cap was placed on tax-deductible contributions to a specific type of pension schemes (annuity pensions), and in 2013 the popular capital pension scheme was replaced by a new old-age pension scheme. These reforms targeted specific pension products, and it is not obvious why they would have any direct impact on the mandatory pension schemes analysed in our study.
2.2. Target wealth and wealth at retirement
To investigate the impact of mandatory pension contributions on individual savings adequacy, we need to determine (1) the level of wealth at retirement necessary to maintain a given lifestyle for the remaining expected lifespan (referred to as ‘target wealth’), and (2) the total wealth of the individual at retirement.
The target wealth at retirement is based on the individual’s pre-retirement consumption level and average remaining life expectancy. Consumption is imputed from income and wealth data supplied by Statistics Denmark, following the approach used by Leth-Petersen (Reference Leth-Petersen2010) and others. Let  ${c_t}$ denote consumption, ${y_t}$ disposable income, which equals total income (including labour income, social welfare benefits, unemployment benefits, child benefits, capital income, and inheritance) less interest payments and tax payments, ${A_t}$ the value of liquid assets (bank deposits including the balance of private pension schemes), and ${D_t}$ total debt (mortgage debt, bank debt, and other debt) at the end of year $t$. Total consumption is imputed as:
 \begin{equation*}{c_t} = {y_t} - {\Delta }{A_t} + {\Delta }{D_t},\end{equation*}
 where  ${\Delta }{A_t} = {A_t} - {A_{t - 1}}$ represents the increase in liquid assets, including private pension contributions, and ${\Delta }{D_t} = {D_t} - {D_{t - 1}}$ represents the increase in debt during year $t$. Hence, consumption is defined as disposable income minus net savings.Footnote 6
The quality of the imputation has been validated in several papers. For example, Browning and Leth-Petersen (Reference Browning and Leth-Petersen2003) compare imputed consumption based on register date to survey-based consumption for the same households (1994–96) and find a close match. Abildgren et al. (Reference Abildgren, Kuchler, Rasmussen and Sørensen2018) conduct a similar analysis for the period 2002–15, and confirm the findings of Browning and Leth-Petersen (Reference Browning and Leth-Petersen2003). Koijen et al. (Reference Koijen, van Nieuwerburgh, Vestman, Carroll, Crossley and Sabelhaus2015) highlight substantial reporting errors in Swedish consumption survey data and advocate using imputed register-based consumption instead.
Using the consumption level one year before retirement, we determine an individual’s target wealth as the level of wealth that would be sufficient to cover the present value of a future constant consumption level over their remaining life expectancy that corresponds to 90 percent of the individual’s pre-retirement consumption level. We assume a discount rate of 2 percent when calculating the present value of future consumption.Footnote 7 The 90 percent threshold is based on Battistin et al. (Reference Battistin, Brugiavini, Rettore and Weber2009), who estimate a 9.8 percent consumption drop at retirement due to expenses related to work or substitutes for leisure. Other studies assume thresholds between 70 percent and 80 percent of pre-retirement consumption (see, e.g. Burnett et al. Reference Burnett, Davis, Murawski, Wilkins and Wilkinson2018 and Gomes et al. Reference Gomes, Hoyem, Ravina and Hu2022). Additionally, Kolsrud et al. (Reference Kolsrud, Landais, Reck and Spinnewijn2024) demonstrate that workers who retire earlier consume less while retired and experience larger consumption drops around retirement, emphasizing the importance of controlling for age in our regressions. As our results naturally depend on the assumed threshold, we present sensitivity analyses to account for variations in this parameter.
To evaluate whether an individual has accumulated sufficient wealth to maintain a given consumption level, we calculate their total wealth at retirement, including the present value of future income streams. Income during retirement consists of two main components: (1) payments from private and mandatory pension schemes, and (2) public transfers, such as public pension payments and other social security benefits. From our pension wealth data provided by Statistics Denmark, we know the total amount an individual has accumulated in private and mandatory pensions schemes at retirement. However, we do not have data on how much each individual will receive in public transfers as well as other types of income after retirement.Footnote 8 To estimate this, we utilize the total timespan of our data. Specifically, we analyse the income streams of retirees who retired between 1996 and 2001 to estimate the development of retirement income for those retiring in 2016.Footnote 9 Using these predicted income streams, we calculate the present value of future income for each individual, assuming a discount rate of 2 percent. In our calculations, we account for differences in life expectancy between men and women. For example, in 2016, the life expectancy for a 64-year-old man was 18.8 years, while for a 64-year-old woman, it was 21.6 years. Additionally, following Kallestrup-Lamb et al. (Reference Kallestrup-Lamb, Kjærgaard, Jarner, Andersen, Jensen and Rangvid2022), we adjust life expectancy based on income quantiles. Specifically, we add (subtract) 2.5 years for women in the highest (lowest) income quantile and add (subtract) 3.5 years for men.
2.3. Data sample and summary statistics
Our focus is on individuals who retired in 2016. We identify these individuals as those who began receiving public pensions in that year while being 60 years or older.Footnote 10 This corresponds to a total of 43,993 individuals. As explained in Section 2.2, we need to determine each individual’s consumption level to calculate the target wealth required to maintain a 90 percent consumption level of their pre-retirement level of consumption throughout retirement. For methodological reasons, certain groups of individuals are excluded from our sample. This includes self-employed individuals, as their consumption cannot be reliably imputed since their salary income is not directly observable, and individuals involved in housing transactions in 2016, as extreme changes in recorded wealth due to housing transactions could bias the imputed consumption.Footnote 11 We also exclude those who have negative imputed consumption in the year before retirement. To limit the influence of outliers, we exclude individuals with annual income below 7,500 DKK (1,000 EUR) or above the 99th income percentile. Full public pension benefits in Denmark are only granted after 40 years of residency. Including immigrants might lead to an overestimation of their present value of future income, so they are excluded from the sample. Finally, we have 1,480 individuals with missing values of income, and they are excluded as well. In total, our final sample consists of 32,903 individuals who retired in 2016. Table 1 provides an overview of the restrictions and their impact on the sample size.
Sample restrictions

Note: This table gives an overview of the effect of our restrictions on our total sample. Explanations for the different restrictions can be seen in Section 2.3.
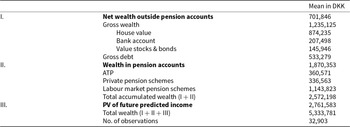
Table 2 presents the average wealth components for our sample of individuals one year before retirement. Total wealth is divided into three main categories:
1) Wealth outside pension accounts: This includes net house value, bank deposits, and financial assets.
2) Wealth in pension accounts: This consists of wealth accumulated in private and labour market pension schemes as well as ATP savings.
3) Present value of future predicted income: This represents income from public transfers and other sources.
Wealth at retirement

Note: The table presents the average wealth components by source one year before retirement for those who retired in 2016. The categories (I) and (II) are observed in the data and the sum of the two equals the accumulated wealth. Category (III) equals the present value of the future predicted income as explained in Section 2.2, and category (IV) equals the sum of the three categories.
The sum of the first two categories defines the accumulated wealth at retirement, whereas total wealth equals the sum of all three categories. Notably, the wealth in pension accounts is reported pre-tax. As we do not have data on the future tax rates for each individual, we assume for our later analysis a uniform tax rate of 40 percent consistent with an analysis of taxes on Danes’ pension wealth conducted by the Danish Economic Council (2023). From Table 2, it follows that, on average, individuals who retired in 2016 had approximately 2.6 million DKK ($350,000) in accumulated wealth, and 5.3 million DKK ($700,000) in total wealth. Predicted future income constitutes the largest component of total wealth at retirement.Footnote 12 Within pension accounts, occupational pension schemes represent about 61 percent of total wealth, while private pension schemes account for roughly 18 percent.
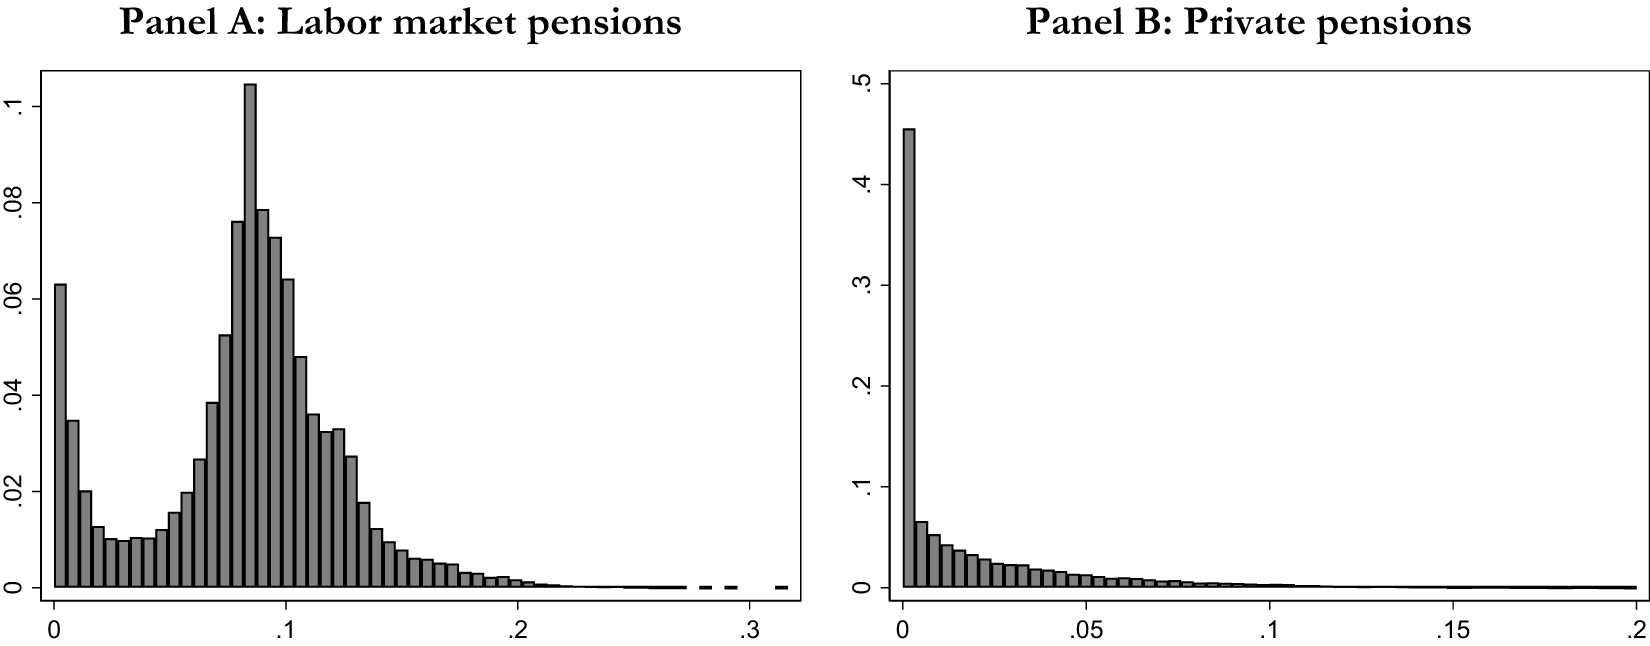
We know the annual amount paid into mandatory and private pension schemes, as well as labour income. Using this information, we calculate the annual contribution rates to mandatory and private pension schemes, respectively. Figure 3 presents the distribution of the average contribution rates for private and labour market pension schemes based on yearly contribution rates between 1999 and 2015 for individuals retiring in 2016. Panel A of Figure 3 illustrates the distribution of the average annual contribution rate to labour market pension schemes. It shows that most individuals retiring in 2016 contributed approximately 10 percent of their income annually to labour market pension schemes. However, a significant fraction of individuals contributed little or nothing to these pensions. The average annual contribution rate to labour market pension schemes equals 8.28 percent and has a standard deviation of 4.14 percent.Footnote 13 Panel B of Figure 3 displays the distribution of the average annual contribution rate to private pensions. Consistent with Figure 2, the data reveals that a large proportion of individuals in our sample did not contribute to private pension schemes. The average contribution rate to private pensions is only 2.26 percent, with a standard deviation of 4.18 percent.
Distribution of the annual average contribution rate from 1999 to 2015.

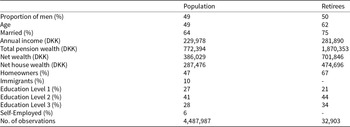
Table 3 presents the socio-economic characteristics of the entire Danish population aged 18 and above (column 1) and our retiree sample (column 2) together with the average annual income, net wealth, and net house wealth. In 2015, one year before our individuals retire in 2016, their average age is 62 years, with 75 percent of the individuals married and 67 percent owning their own home. In comparison, the average age of the entire population is 49 years, with 64 percent married and 47 percent owning their own home. Statistics Denmark categorizes individuals’ education levels from 1 to 4. Level 1 represents primary school or less, level 2 secondary school or vocational education, level 3 short-, medium-, or long-term higher education, and level 4 corresponds to PhD or researcher education. Due to the relatively small number of individuals with level 4 education, we combine levels 3 and 4 in our analysis. It follows that more than 75 percent of near-retirees have an education level of 2 or higher, slightly exceeding the average for the entire population.
Socio-economic characteristics of the Danish population and our sample in 2015
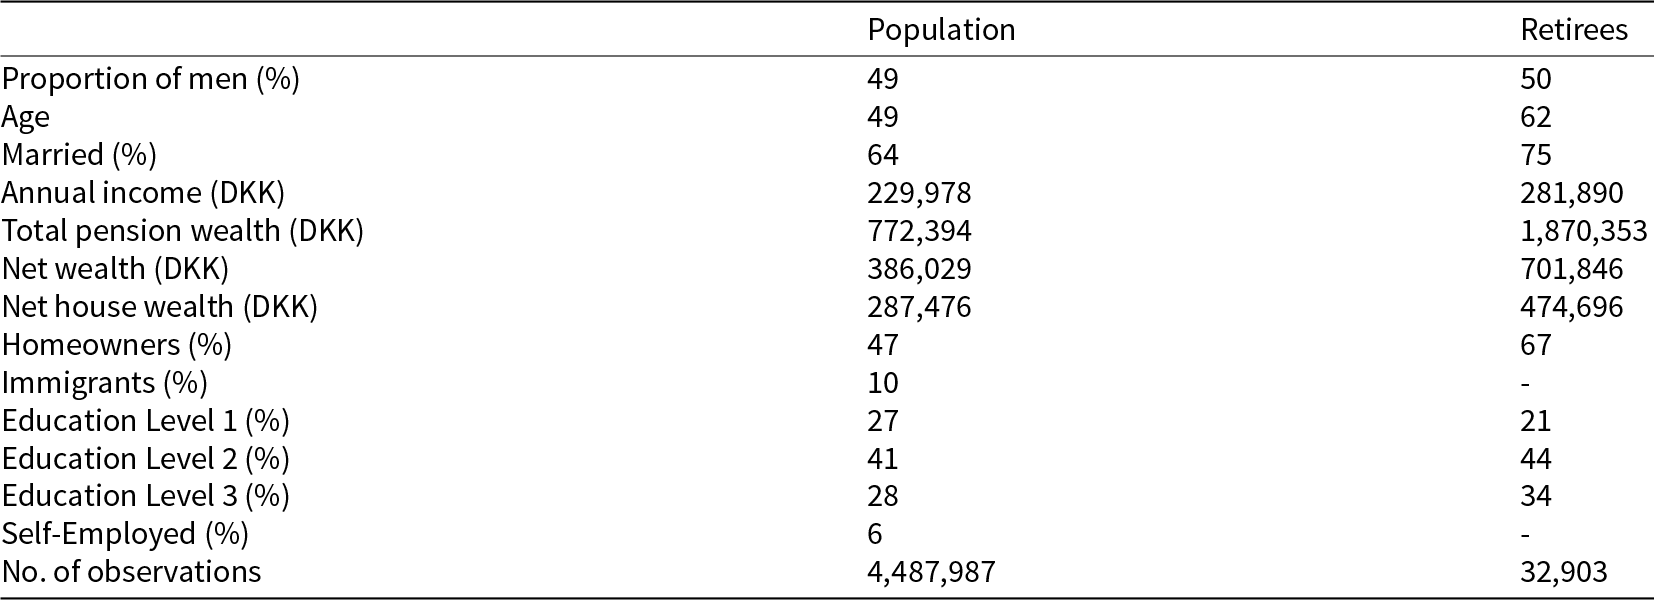
Note: The first column presents the socio-economic situation of the entire Danish population above the age of 18 together with the average annual income, net wealth, and net house wealth. The second column presents the socio-economic characteristics of all individuals retiring in year 2016.
The annual income for our retiree sample is higher than that of the general population, indicating rising income levels as people age. On average, individuals have accumulated 772 thousand DKK ($110,000) in pension accounts, while individuals retiring the following year have accumulated 1,870 thousand DKK ($260,000), consistent with Table 2. Net wealth, defined as the value of an individual’s liquid assets minus liabilities, is highest for near-retirement individuals. Similarly, net house wealth, calculated as the public valuation of the house minus mortgage debt, is also largest for individuals nearing retirement.
3. Saving adequacy and pension contributions
We aim to investigate the relationship between individuals’ pension contributions and their ability to maintain a given consumption profile throughout retirement. To do this, we first calculate the savings gap for each individual i. The savings gap is defined as the difference between the target wealth (as described in Section 2.2) and the total wealth, which includes the present value of future income, that is,
 \begin{equation}Savings{\text{ }}ga{p_i} = Target{\text{ }}wealt{h_i} - Total{\text{ }}wealt{h_i}\end{equation}
If the savings gap is zero, the individual has saved exactly enough to maintain a consumption-level during retirement equivalent to 90 percent of their pre-retirement level. A negative savings gap indicates that the individual could have saved less and still maintained a 90 percent consumption level throughout retirement. Conversely, a positive savings gap suggests that the individual has not accumulated enough savings to sustain the target level of consumption.
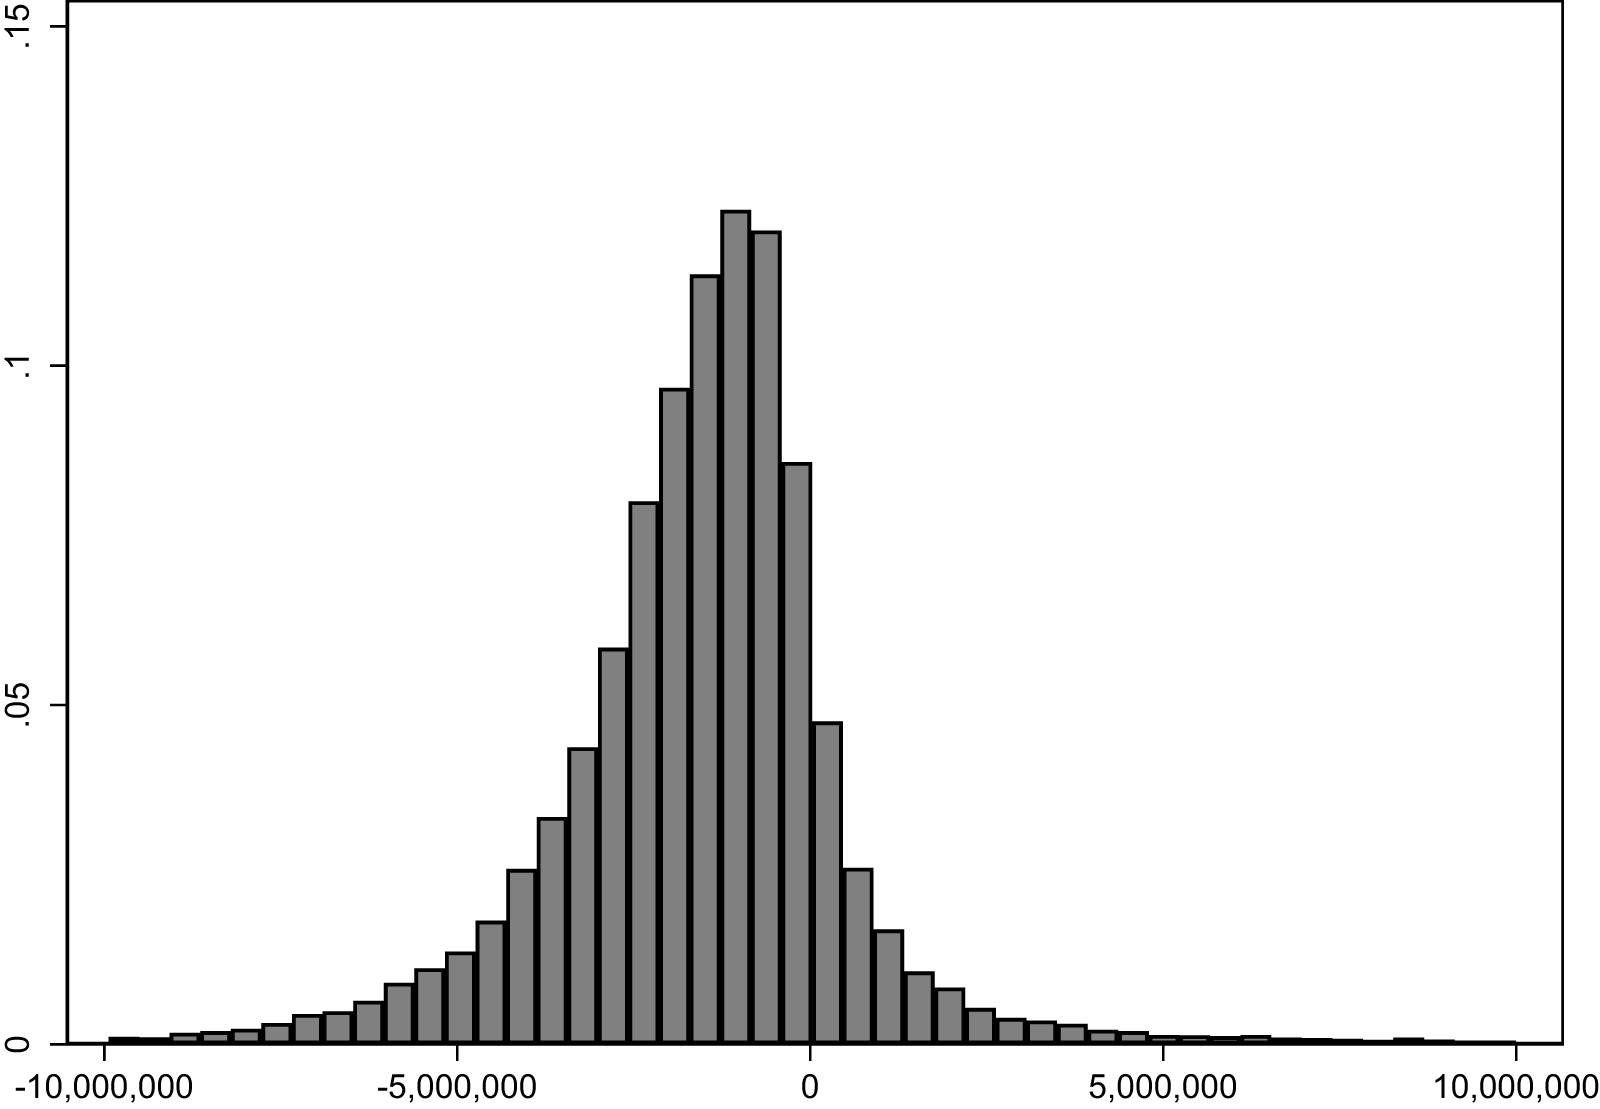
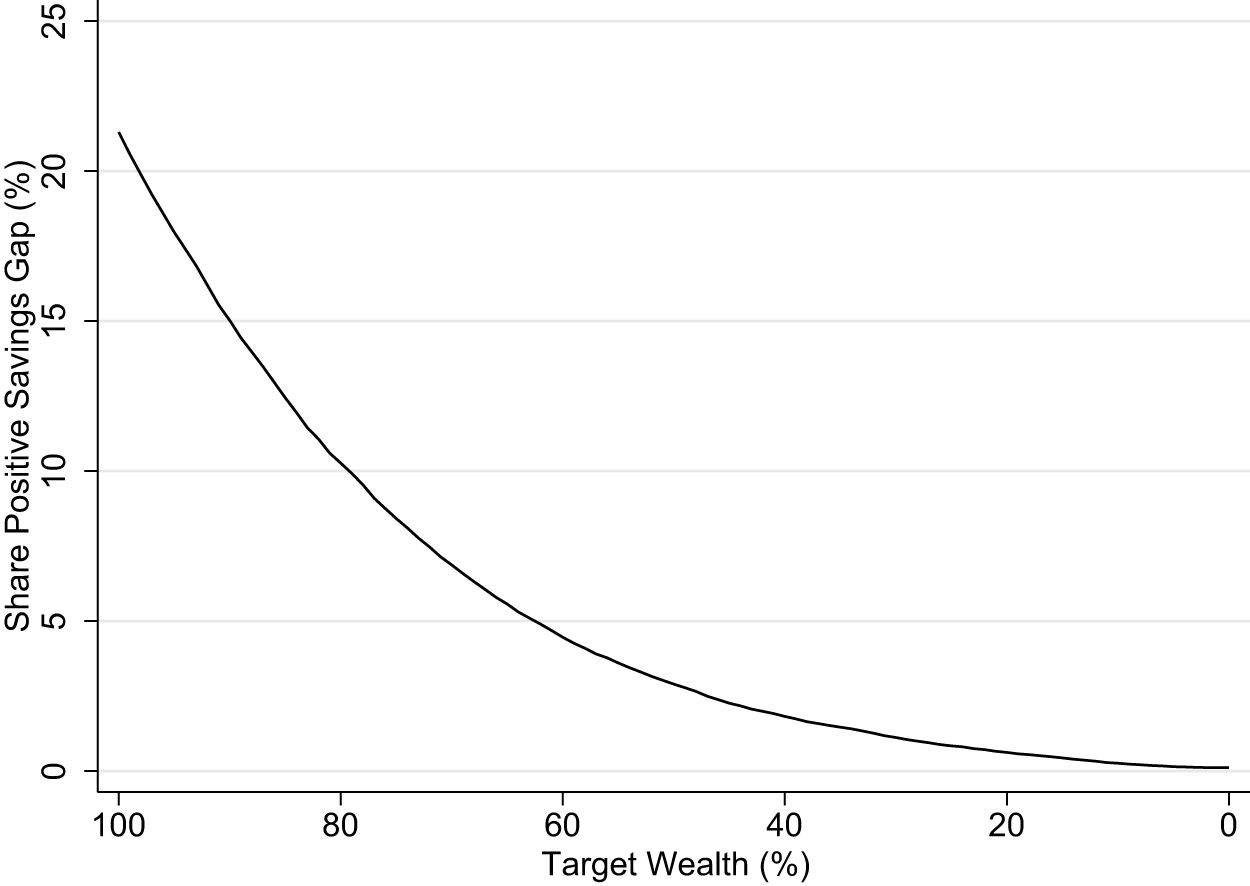
Figure 4 shows the distribution of the saving gap. We find that 15.0 percent of individuals retiring in 2016 have a positive savings gap. In other words, 15 percent of the individuals retiring in 2016 have not accumulated enough savings to maintain a consumption level equivalent to 90 percent of their pre-retirement consumption level. A relatively high proportion of these individuals have a savings gap just above zero. They are saving adequately if they are satisfied with a slightly lower consumption level throughout retirement. On the other hand, if individuals want to maintain a consumption level above 90 percent of their pre-retirement consumption level, a higher proportion of individuals is not saving enough.Footnote 14 Figure 5 displays the relation between the probability of a positive savings gap and the assumed threshold for the target wealth. Intuitively, lower thresholds correspond to a lower probability of a positive savings gap. For example, for a consumption level of 80 percent (100%) of pre-retirement consumption, we find a positive savings gap for 10.3 percent (21.3%) of those retiring in 2016.
Distribution of the savings gap for individuals who retired in 2016.

Fraction of individuals with a positive savings gap.

It is possible that an individual has already reduced their consumption one year prior to retirement. Hence, one could alternatively investigate the average consumption level over a given number of years prior to retirement. To address this, we consider alternative benchmarks for pre-retirement consumption by requiring a consumption level in retirement equal to 90 percent of the average consumption level over the 3, 5, and 10 years preceding retirement. Using these benchmarks, we find that 14.2 percent, 14.1 percent, and 14.0 percent, respectively, have not accumulated enough savings. This indicates that our results are robust to variations in the calculation of the pre-retirement consumption level.
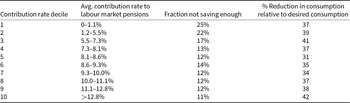
It is important to understand why some individuals do not save enough to maintain a desired consumption level during retirement, while others do. In Table 4, we split the subsample of individuals with a positive savings gap by their contribution rate to mandatory pension schemes. It follows that the fraction of individuals who have not saved enough decreases as the mandatory contribution rate increases. In other words, it is more likely that an individual falls short of saving enough to maintain a desired consumption level throughout retirement if their mandatory contribution rate is lower. The fraction of individuals for whom this applies is reduced by more than half (from 25% to 12%) by increasing the mandatory contribution rate from below 1.1 percent to between 8.1 and 8.6 percent. Increasing the contribution rate further appears to have limited additional effect on the fraction of individuals not saving enough. Furthermore, as shown in the last column of the table, the average percentage reduction in consumption relative to the target wealth is 37 percent. This is a significant drop in future consumption level compared to the pre-retirement level of consumption.Footnote 15
Proportion of individuals with a positive savings gap given their contribution rate to mandatory pension schemes

Note: The average contribution rate to labour market pensions is based on the yearly contribution rate for the period from 1995 to 2015. The % percentage reduction in consumption relative to the desired consumption level equals the average per decile for those not saving enough within that decile. The total number of observations (no. of individuals) across all deciles is 32,903.
Our results in Table 4 indicate that the probability of not saving enough to maintain 90 percent of pre-retirement consumption during retirement is related to the size of the mandatory contribution rate. To verify this, we conduct several regressions. First, to test whether participation in a mandatory or private pension scheme reduces the likelihood of having a positive savings gap, we estimate the following probit regression:
 \begin{equation}P\left( {{D_i} = 1{\text{|}}D_i^{man},D_i^{pri},{C_i}} \right) = \Phi \left( {{\beta _1}D_i^{man} + {\beta _2}D_i^{pri} + \delta '{C_i} + {u_i}} \right),\end{equation}
 where  ${D_i}$ is a dummy equal to 1 if individual i has a positive savings gap, and 0 otherwise. Participation in pension schemes is captured by two dummy variables, $D_i^{man}$ and $D_i^{pri}$, which equal 1 if individual i contributes to mandatory or private pension schemes in the year before retirement, respectively, and 0 otherwise. ${C_i}$ is a vector of control variables including gender, age, marital status, homeowner, education level, public employment status, income group (income decile), log gross wealth, and log pension wealth.
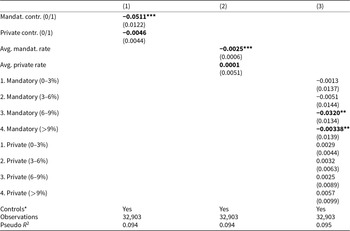
The results from the probit estimation are presented in column (1) of Table 5. It follows that individuals who contributed to a mandatory pension scheme in the year before retirement are approximately 5 percentage points less likely to end up with a positive savings gap, meaning they are less likely to end up without enough savings to maintain a consumption level during retirement of 90 percent of their pre-retirement consumption level. On the other hand, participation in a private pension scheme does not exhibit a statistically significant relationship with the likelihood of having a positive savings gap. The coefficients of the control variables from the regression are reported in Table A2, column (1), in the online Appendix. It follows that homeowners, men, wealthier individuals, and those employed in the public sector have a lower probability of not saving enough. Conversely, married individuals, those with higher levels of education, and individuals retiring at an older age are slightly more likely to have a positive savings gap. The finding regarding older retirees aligns with Kolsrud et al. (Reference Kolsrud, Landais, Reck and Spinnewijn2024), who finds that those retiring later enjoy higher consumption compared to early retirees, which is consistent with the probability of a positive savings gap increasing with age. Lastly, the results in Table A2 also show that individuals in lower-income deciles have a lower probability of not saving enough compared to those in the higher-income deciles.
Probability of not saving enough

Note: This table presents partial effects at the mean and heteroscedasticity robust standard errors (in parentheses) from three probit estimations. In all three regressions the dependent variable is a dummy equal to 1 if an individual has a positive savings gap and 0 otherwise. The variables ‘mandat. Contr. And ‘private contrib.’ are dummy variables indicating whether a person contributed to labour market and private pensions in the year before retirement. The average contribution rates (‘avg. Mandate. Rate’ and ‘avg. Private rate’) are calculated using the yearly contribution rates to private and labour market pensions between 1999 and 2015. The variables ‘x.Mandatory’ denote the buckets comprising average labour market contribution rates; ‘x.Private’ denotes the buckets comprising average private pension contribution rates. The reference category for ‘mandatory’/‘private’ is the group that contributed on average 0% of their wage to labour market and private pension schemes respectively. Significance is reported at the 1%(***), 5%(**), and 10%(*) level. *Coefficients for control variables are shown in the online appendix; see Table A2.
Next, we investigate more directly whether the magnitudes of the contribution rates to mandatory and private pension schemes relate to the probability of having a positive savings gap. This is done in two steps. First, we look at the average contribution rate using the yearly contribution rates to private and mandatory pensions between 1999 and 2015.Footnote 16 We run the same probit regression as above, but instead of using dummy-variables for participation in a pension scheme (mandatory or private), we use the average contribution rate of each person. The results are stated in column (2) in Table 5. Again, we find that the probability of not saving enough to maintain 90 percent of the pre-retirement consumption level throughout retirement negatively correlates with the contribution rate to the mandatory pension schemes. Specifically, individuals with an average contribution rate to mandatory pensions that is 1 percentage point higher are, on average, 0.25 percentage points less likely to have a positive savings gap. By contrast, no statistically significant relationship is observed between the private average contribution rates and the likelihood of not saving enough.
Lastly, to examine potential non-linearity in how the magnitude of the contribution rates impacts the probability of having a positive savings gap, we divide the average mandatory and private contribution rates into four buckets. Bucket 1 contains all individuals paying less than 3 percent of their labour income into a pension scheme, bucket 2 contains all individuals paying between 3 percent and 6 percent, bucket 3 all individuals paying 6–9 percent, and finally bucket 4 contains all individuals paying more than 9 percent. We then run the same probit regression as stated in Eq. (1), but instead of having two dummy variables we have two times four, one for each bucket. The reference category for each dummy is the group that contributed on average 0 percent of their wage to mandatory and private pension schemes, respectively. The results are in column (3) in Table 5. It follows that the likelihood of not saving enough is about 3.2 percentage points lower for a person who contributed on average between 6 and 9 percent of their wage income into mandatory pensions compared to those who contributed on average zero. For individuals paying more than 9 percent, the effect is 3.4 percentage points, whereas for individuals paying less than 6 percent, there is no significant relationship between the probability of not saving enough and the mandatory contribution rates. The same holds for contributions to private pension schemes, where we again find no statistically significant relationship.Footnote 17
We next examine not merely whether mandatory and private pension schemes associate with the probability of a positive savings gap, but whether these pension schemes relate to the magnitude of the gap, conditional on the savings gap being positive. To examine this, we run a Heckman two-step procedure. The dependent variable in the first-stage regression is a dummy variable taking the value of 1 if an individual has a positive savings gap and 0 otherwise. In the second-state regression, the dependent variable equals the log savings gap. Again, we look at three different settings. First, we study how participation in a pension scheme one year before retirement relates to the size of the gap; second, we look at how the average contribution rate relates to its size; and finally, we look for potential non-linear effects by separating individuals into four buckets, based on their contribution rates. The results are stated in Table 6, where columns (1), (3), and (5) are of primary interest (Heckman second step).
What determines the size of the savings gap?

Note: This table presents the estimated results of a Heckman two-step procedure for different control variables. The dependent variable in the first-stage regression is a dummy variable taking the value of 1 if an individual has a positive savings gap and 0 otherwise. The dependent variable in the second stage regression is the log savings gap. Significance is reported at the 1%(***), 5%(**), and 10%(*) level, and standard errors are stated in parentheses.
From column (1) in Table 6, it follows that among those who did not save enough, the savings gap was about 65 percent lower (1-exp(−1.045) = 0.6483) for the individuals who paid into mandatory pensions in the year before retirement, compared to those who did not. From column (3), it follows that among those who did not save enough, a 1 percentage point increase in the average contribution rate to mandatory pensions is associated with a 5 percent (1-exp(−0.0507) = 0.0494) lower savings gap. Finally, from column (5) it follows that among those who did not save enough, those who contributed on average between 6 and 9 percent of their wage to mandatory pension savings have a savings gap that is about 60 percent (1-exp(−0.907) = 0.5963) lower compared to the group who paid on average zero to mandatory pension schemes. For those who paid more than 9 percent, the savings gap is 61 percent lower than that of those who contributed on average zero. In short, the higher the mandatory contribution rate, the lower is the savings gap. For the private pensions, we find no significant relationship with the size of the savings gap.
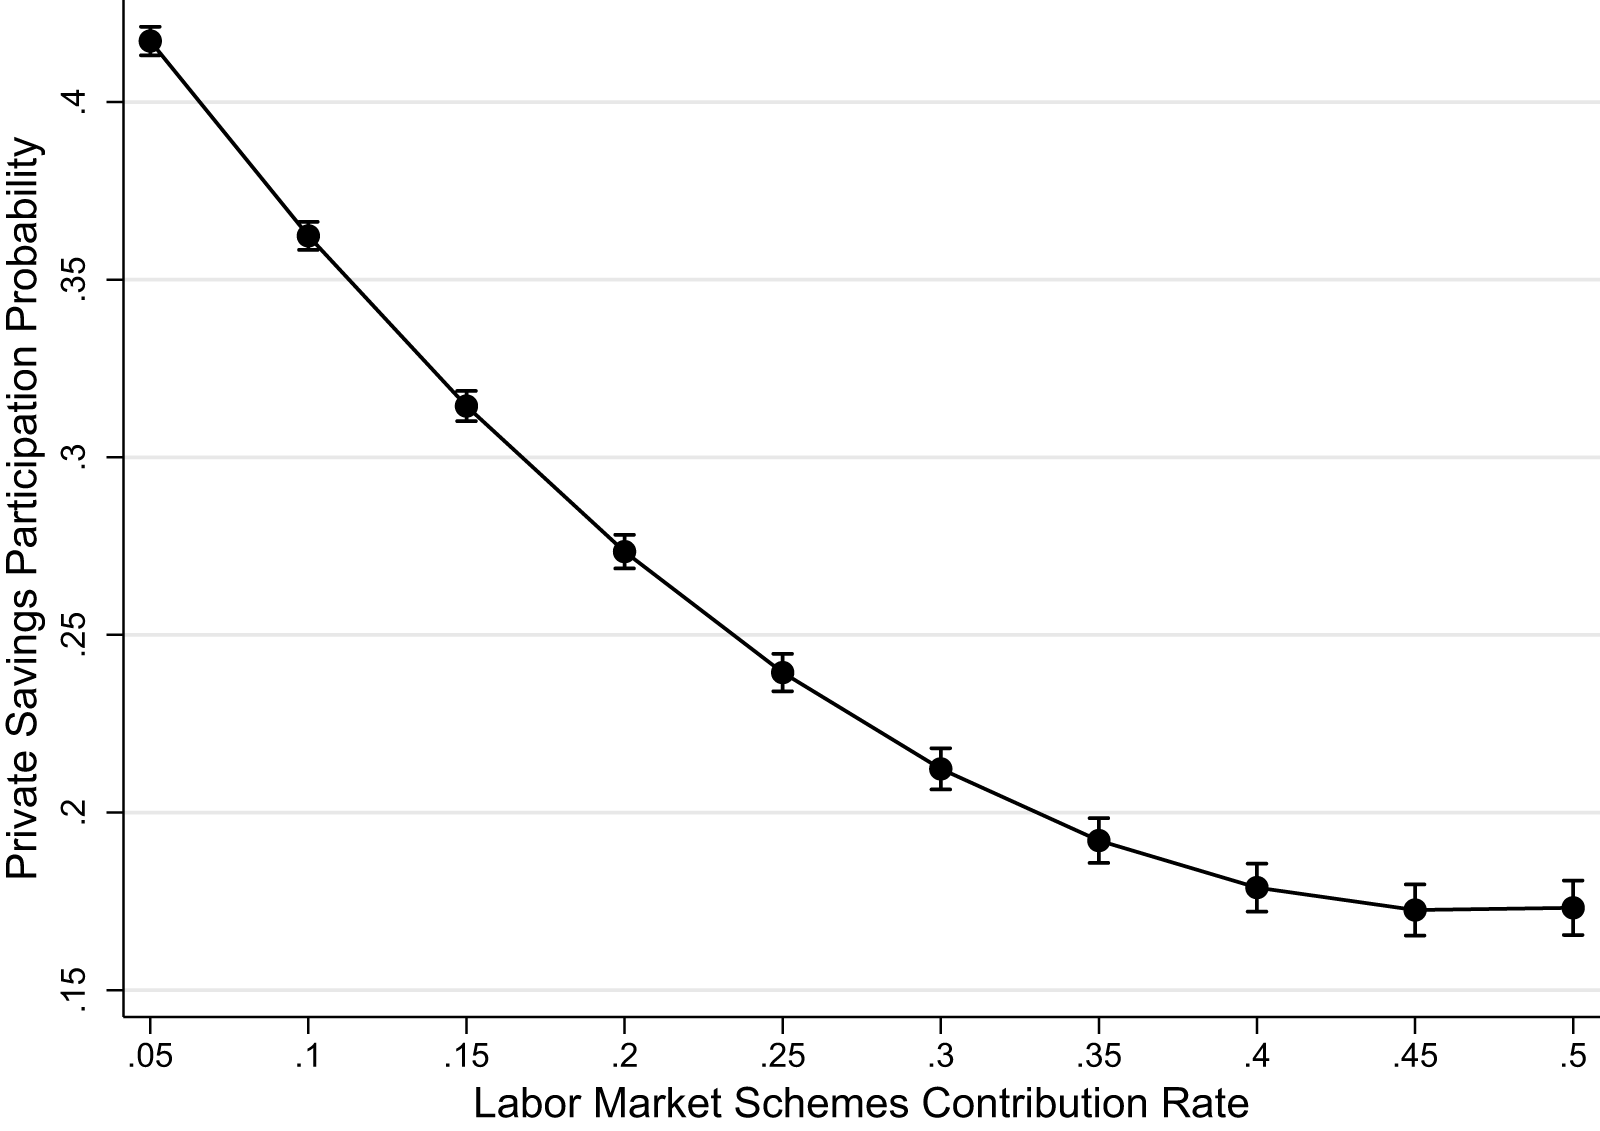
It is noteworthy that private pension savings have no significant association with the size of the savings gap. However, this result may be a consequence of the increasing contribution rate to mandatory pension schemes as illustrated in Figure 1. Figure 6 displays the estimated relation between contributions to mandatory and private pension schemes. The estimation is based on a linear-probability model (LPM) regression where the dependent variable is a dummy equal to 1 if an individual contributed to a private pension scheme in a given year and 0 otherwise. The explanatory variables are the mandatary contribution rates, a squared term thereof, and the usual individual control variables (income, wealth, gender, age, and marital status). The underlying coefficient estimates of the LPM regression are stated in Table A5 in the online Appendix.Footnote 18 From Figure 6 it follows that the mandatory contribution rate is negatively correlated with the probability of having a private pension scheme. In other words, individuals who have higher mandatory pension contribution rates are less likely to pay into a voluntary pension scheme as well.
Estimated probability of participating in a private pension scheme as a function of the mandatory contribution rate.

The negative relationship between mandatory and private contributions also suggests that individuals who lack mandatory savings may compensate for those by increasing their private savings. To investigate this, we consider the subsample of those individuals who contributed on average below 1 percent of their wage income to mandatory pensions between 1999 and 2015. This subsample only involves 3,017 individuals and, we note, is not very representative of the Danish population. Nevertheless, examining these individuals informs us about the use of private pensions as a substitute for mandatory pensions, for individuals who have only little of the latter. Table 7 shows the results of the same three regressions as reported in Table 4, but for this subsample of individuals (thereby also excluding mandatory contributions as an explanatory variable). We only find a significant result when we run the regression on the average contribution rate to private pensions, cf. column (2), indicating that private contributions do in fact help to close the savings gap. However, the probability of a positive savings gap only decreases with about 3 percentage points for a 10 percentage point increase in the average contribution rate to private pensions. We do not see any significant relationship with the probability of having a positive savings gap, cf. column (1), nor when examining the four contribution buckets in column (3) except for a contribution rate below 3 percent. While the sign in column (1) points in the direction that private contributions help people close the savings gap, the results are overall weak, and we are left to conclude that individuals do not compensate sufficiently for the lack of mandatory savings by increasing their private savings.Footnote 19 This aligns with Hougaard Jensen et al. (Reference Hougaard Jensen, Olafsson, Stefansson, Sveinsson and Zoega2022), who find that Icelandic households do not react to changes in mandatory pension contributions by significantly readjusting their voluntary savings.
Probability of not saving enough for those with low contribution rates to mandatory pensions

Note: This table presents the partial effects at the mean for the subsample of individuals who contributed on average below 1% of their wage income to mandatory pensions between 1999 and 2015. The dependent variable is a dummy equal to 1 if individual has a positive savings gap and 0 otherwise. When calculating the average contribution rates to private pensions for this subsample, we do not take into consideration year person observations for which the contribution rate to private pensions was more than three standard deviations above the subsample average (i.e., private pension contribution rates above 26% of wage income). Significance is reported at the 1%(***), 5%(**) and 10%(*) level, and heteroscedasticity robust standard errors are stated in parentheses.
In short, even though Figure 6 shows that people pay more into a private pension scheme if their mandatory contribution rate is low, contributions to private pensions do not compensate fully for lack of mandatory pension savings, as demonstrated in Tables 5 and 7. Our results thereby indicate that an effective tool to ensure that individuals can maintain a high consumption level throughout retirement is to implement mandatory pension contributions. But forcing individuals to save more may come at a cost, which is what we investigate next.
4. The cost of mandatory pension contributions
We have established that mandatory pension savings play an important role in securing that people can maintain an adequate level of consumption after retirement. However, there may be a price to pay when forcing people to save for retirement. To examine this, we compare savings and investment decisions of two groups of individuals who differ because of very different developments in their mandatory contribution rates from 1996 to 2010. One group paid a relatively high and stable contribution rate during the given period (control group), whereas the other group (treatment) saw its contribution to mandatory pension increase by almost 10 percentage points of income, that is, a substantial reduction in disposable income during working-age. The question is whether people being forced to pay more into mandatory pension adjust consumption and savings outside pension accounts.
4.1. Data sample and summary statistics
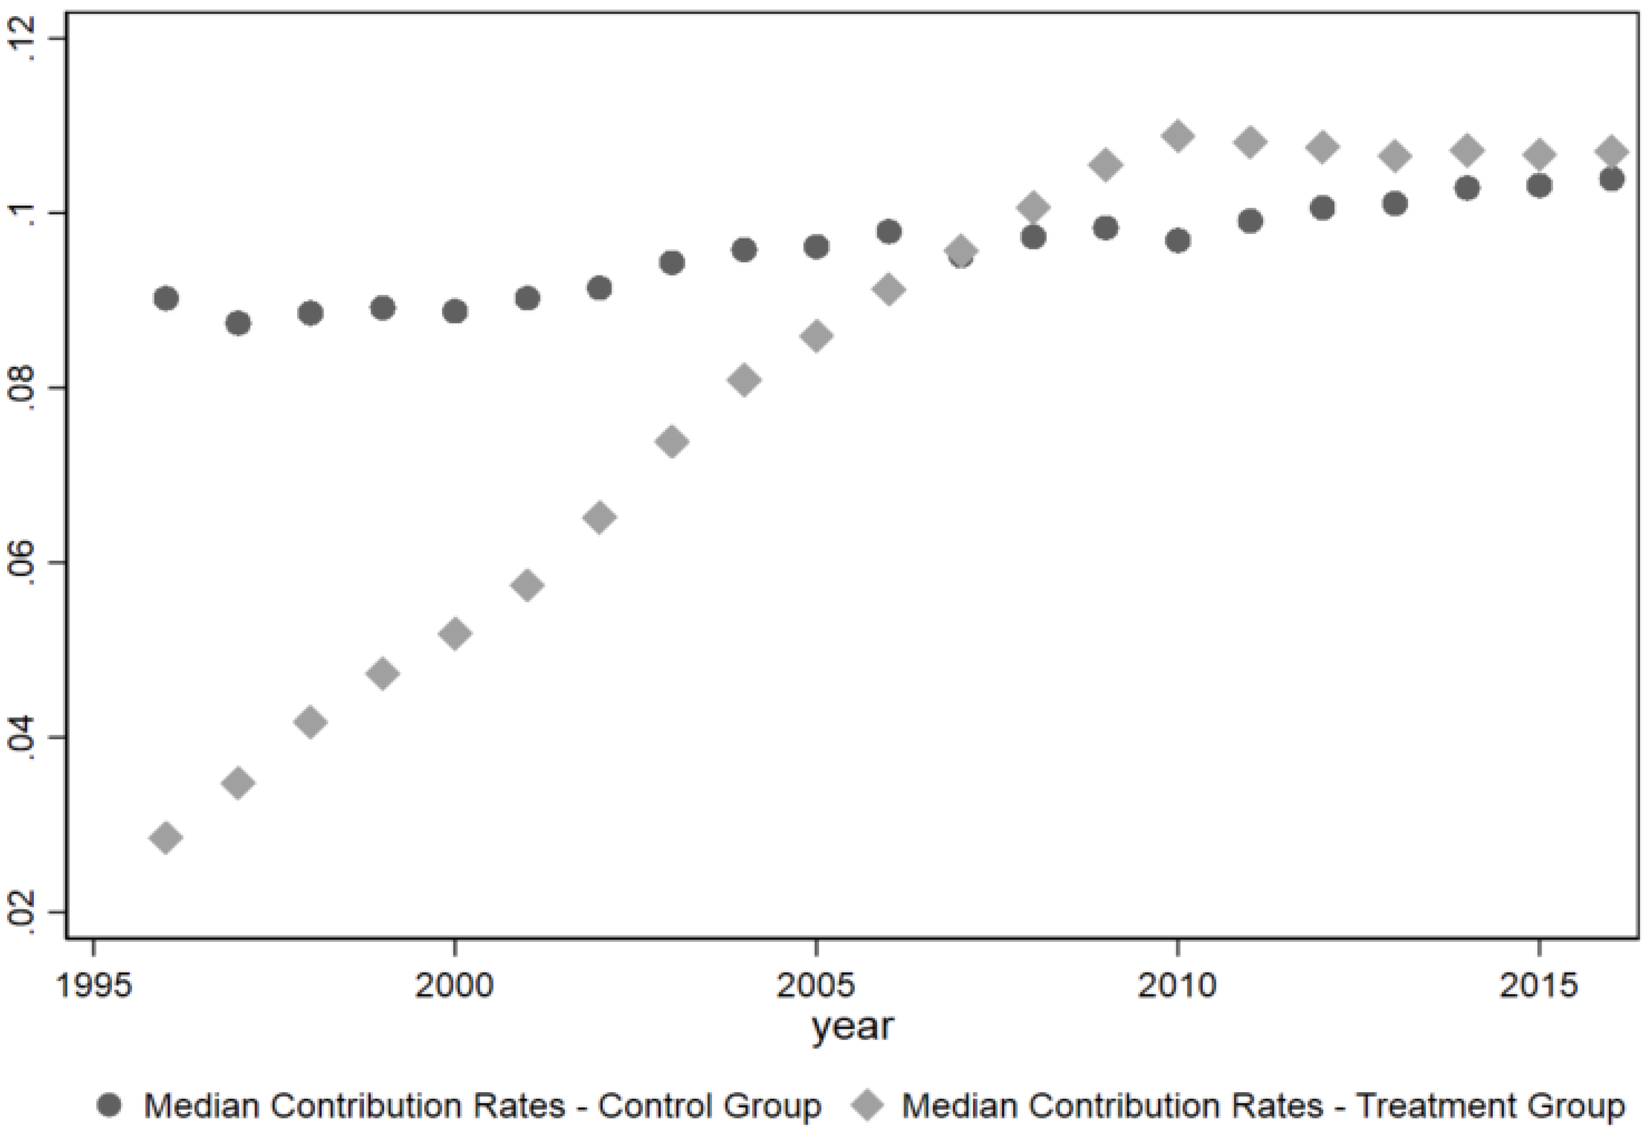
For each individual aged between 25 and 40 in 1996, we calculate the average annual increase in contribution rates over the 1996–2013 period.Footnote 20 Figure 7 presents the development in the median mandatory contribution rates across individuals for our treatment and control groups.Footnote 21 The treatment group consists of individuals whose average annual increase in their contribution rate is in the top 30 percent of the distribution of contribution growth rates in the period from 1996 to 2010. Individuals in this group on average saw their contribution rates increase by more than 0.51 percentage points per year. The control group consists of individuals in the bottom 30 percent of the distribution of contribution growth rates. These individuals saw their contribution rates increase by less than 0.14 percentage points per year in the period from 1996 to 2010. For both groups, the mandatory contribution is close to unchanged in the period from 2010–13 as illustrated in Figure 7.
Development in the mandatory contribution rates for our control and treatment groups, respectively.

Figure 7 shows that in 1996 individuals in the treatment group on average paid approximately 3 percent of their income in mandatory pension contributions. This increases to approximately 12 percent in 2010, that is, an almost 10 percentage point increase in contribution rates. The contribution rates of individuals in the control increase only a little, from app. 9 to app. 11 percent, during the same period. The objective now is to analyse whether the early treatment period from 1996 to 1998 associates with different outcomes in the subsequent post-treatment period from 2011 to 2013.
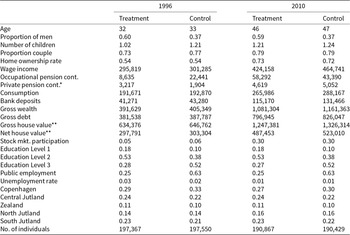
To compare the outcomes of the two groups, it is important to account and control for any potential differences between them. Table 8 provides an overview of the key socioeconomic characteristics of the individuals in both groups in 1996 and 2010. The treatment (control) group consists of 197,367 (197,550) individuals in 1996 and 190,867 (190,429) in 2010. In 1996, the average age of the treatment group is 32 – one year younger than the control group. This small age difference may explain the slightly higher number of children and the slightly higher proportion of individuals living as a couple in the control group. There is a higher proportion of men in the treatment group compared to the control group. The control group has on average a higher education level compared to the treatment group, and a higher fraction in the control group works in the public sector. The latter is as expected as the occupational pensions were until 1991 mainly available to public employees as discussed in Section 2.1. By definition, annual occupational pension contributions are significantly lower for the treatment group in 1996 compared to the control group. The treatment group only slightly compensates for the lack of occupational pension savings by contributing marginally more, on average, to private pension savings. Finally, the two groups are very similar in terms of home ownership rates, wage income, unemployment rates, consumption levels, bank deposits, gross wealth, debt, house values, and stock market participation rates in 1996. Since it is the same sample of individuals in 2010, the two groups are in 1996 fourteen years older, have close to the same number of kids, same education level, and they have still the same home ownership rate. The differences in wage income, consumption level, bank deposits, gross wealth, debt, and house value have increased. Notice that the reported wage income is after deducting contributions to the mandatory pension scheme. Consistently, the treatment group, who faced an increase in their contribution rate of approximately 10 percentage points from 1996 to 2010 compared to the control group, got on average DKK 40,000 less per year in 2010 compared to our control group, which is not far from 10 percent of income.
Summary statistics

Note: This table presents the means of some key socio-economic characteristics for individuals, who had either high (treatment) or low (control) average yearly increase in mandatory contributions rates between 1996 and 2010. The two groups are constructed from a sample of all individuals living in Denmark who were between 25 and 40 years old in 1996. Among those, the high (low) increase group is those with an average yearly increase in mandatory contribution rates in the top (bottom) 30% of the distribution.
*Due to data limitations, 1996 values reflect data from 1999.
**Conditional on owning a house.
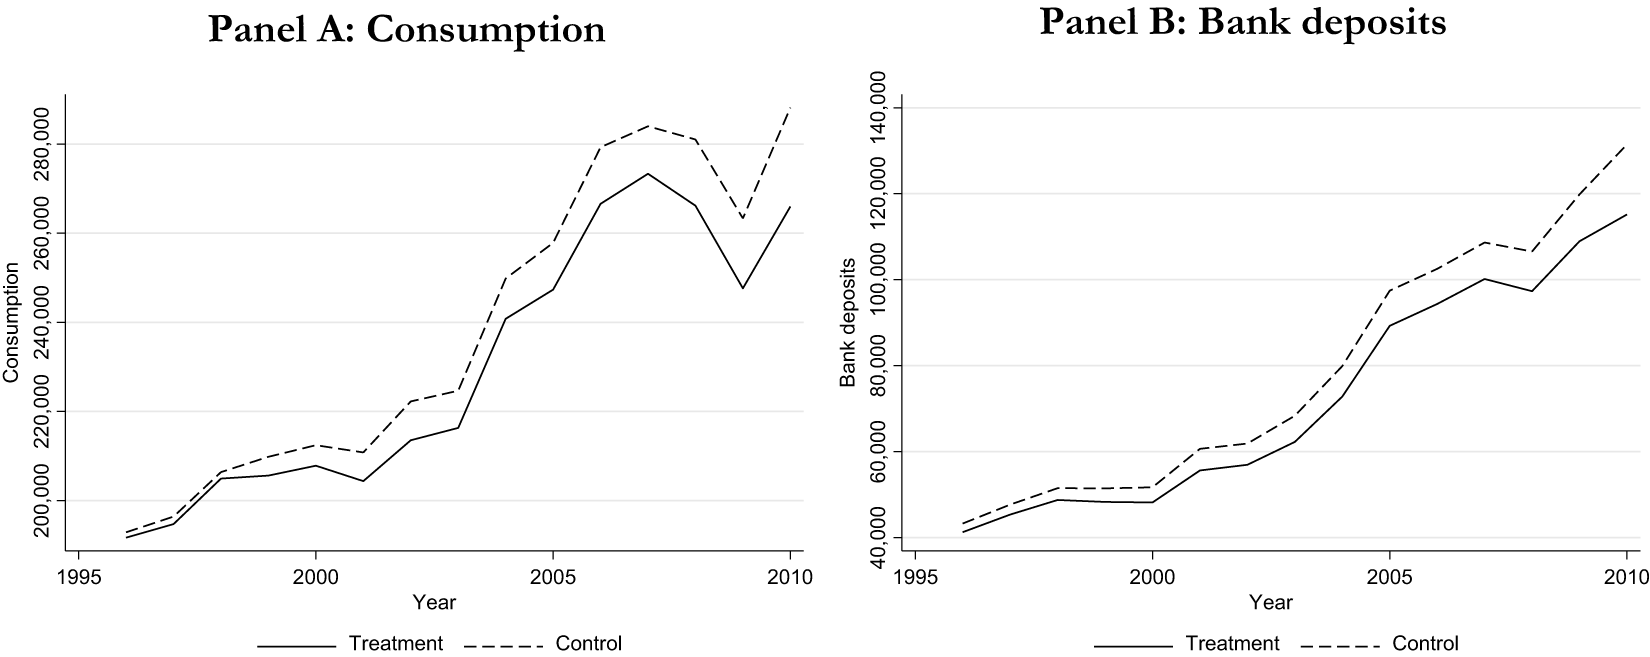
Figure 8 shows the development in the average consumption level and the average amount of bank deposits over time from 1996 to 2010 for the treatment and control groups. In line with Table 7, the average level of consumption in 1996 equals approximately DKK 192,000 for both groups, but after 14 years the average level of consumption is approximately DKK 22,000 lower for the treatment group compared to the control group; that is, we see a lower increase in consumption for individuals paying more into their pension scheme. The same holds for their savings in the bank account; that is, individuals paying more into their pension scheme end up with approximately DKK 16,000 less in their bank account compared to the control group.
Development in consumption and bank deposits, respectively.

4.2. Marginal effects
We want to investigate how individuals subsequently adjust their consumption and savings depending on whether they have experienced a large increase in pension contribution rates (treatment) or have had a more stable contribution rate (control) over the treatment period from 1996 to 2010. To estimate the marginal effect of an increase in the contribution rate, we run the following regression
 \begin{equation}\ln \left( y \right) = {\text{ }}{\beta _0} + {\beta _1}{D^{treat}} + {\beta _2}{D^{post}} + {\beta _3}{D^{treat}}*{D^{post}} + \beta X + {u_i}\end{equation}
 where  $y$ is one of the outcome variables we study (see below), the dummy ${D^{treat}}$ is an indicator for the treatment group (high increase in contribution rate), and the time dummy ${D^{post}}$ is a dummy taking the value of 1 for observations belonging to the post-treatment period and 0 otherwise. The starting observations for both groups are the 1996–98 averages (per individual) of the different variables, and the post-treatment observations are 2011–13 averages. Effectively, thus, we compare the differences between the two groups for the early period (1996–98) vs. the late period (2011–13) for different outcome variables, controlling for standard control variables (income, wealth, gender, age, marital status, and region), which are included in $X$.
$X$.
The primary outcome variables of interest are consumption and voluntary savings. Table 8 shows that in the beginning of the sample period the consumption levels are very comparable across the two groups, as are the measures for private savings (e.g., wealth, debt, and deposits). To minimize the impact of any confounding effects, we take care to control for any differences in observables characteristics (age, gender, etc.) in our regression analysis. These control variables are important to capture any potential differentials in the two groups. As the groups are defined based on different mandatory contributions, which by definition cannot be affected by personal saving preferences, such unobserved differences should not confound our estimated impact of mandatory savings.
Table 9 shows the results. In column (1), we first study how consumption of treated individuals associates with an increase in their mandatory contribution rate. The increase in the contribution rate has a significant negative relation with consumption. We find that the level of consumption of the treatment group has increased by 3.8 percentage points less than the control group’s level of consumption over the period 1996–98 to 2011–13. That is, individuals forced to save more for retirement through higher mandatory contribution rates have experienced a lower increase in consumption over time, relative to the change in consumption for the control group.
The cost of mandatory contributions

Note: This table presents the coefficients of interest from four estimations stated in Eq. (3). Column (1) examines how consumption of individuals with a high increase in their mandatory contribution rate (our treatment group) is affected relative to consumption of individuals with a stable contribution rate (control group). Columns (2)–(4) examine how the individuals’ saving rates (measured by change in gross wealth, change in net wealth, and change in deposits, respectively) of our treatment group is affected relative to the saving rates of our control group. Significance is reported at the 1%(***), 5%(**), and 10%(*) levels, and heteroscedasticity robust standard errors are stated in parentheses.
Table 8 shows that consumption has increased by appr. DKK 74,000 for the treatment group and DKK 95,000 for the control group between 1996 and 2010. The back-of-the-envelope calculation thus is that consumption is appr. DKK 3,000 lower than it would have been had treated individuals not been forced to increase pension contributions. Given that (unconditional) total consumption amounts to DKK 270,000 in 2010 for individuals in the treatment group on average, this amounts to a little more than a 1 percent reduction in consumption. While we have no welfare criteria according to which we can evaluate this consumption reduction, it appears to be a relatively low cost.
Increasing mandatory pension savings might also affect people’s voluntary savings. This we explore in columns (2)–(4) of Table 9. We explore three different measures of individuals’ savings. We first look at the average annual change in gross wealth, then we take debt into account by examining net wealth, and finally, as the most typical savings vehicle for households, we look at deposits. Column (2) of Table 9 shows that the average annual change in gross wealth of the treated individuals is 5.2 percentage points lower than the average annual change in gross wealth of individuals in the control group over the period 1996–98 to 2011–13. However, if we take debt into account by studying net wealth, the effect is much smaller. It follows from column (3) that the annual percentage change in net wealth is about 0.9 percentage points lower for the treatment group compared to the control group, over the 1996–98 to 2011–13 period. Finally, from column (4), it follows that the average annual percentage change in the value of bank deposits is 8.3 percentage points lower for the treatment group compared to the control group, over the 1996–98 to 2011–13 period.Footnote 22
Overall, we find that people who have been forced to increase their pension savings have lower consumption relative to the control group who have not faced the same increases in mandatory savings. The treatment group also accumulates less wealth, both net and gross wealth, and saves less into their bank account.Footnote 23
These results must be interpreted in relation to the strong evidence found in Section 3 that mandatory savings are associated with an increase in the fraction of people who are able to maintain their pre-retirement consumption profile. Therefore, our results suggest that people forced to save for retirement do not take action to fully remediate this by increasing borrowing or lowering other types of savings in proportion to the increase in mandatory savings. If that was the case, the savings gap would not have been affected, in contrast to what we showed in Section 3.
5. Conclusion
We analyse the relationship between participation in mandatory pension savings schemes and individuals’ savings for retirement and provide an analysis of the costs associated with these forced savings. We find that 85 percent of retiring individuals have saved enough to maintain almost all (90%) of their pre-retirement level of consumption during retirement. The variable that strongly associates with this high fraction is mandatory pension contributions. An individual who has contributed to a mandatory pension scheme is about 5 percentage point less likely to end up having too little savings to maintain his/her pre-retirement consumption profile. In contrast, private pension contributions have no statistical association in our regressions. The 15 percent of the individuals who have not saved enough to maintain pre-retirement consumption levels are less likely to have mandatory pension savings and have not compensated for a lack thereof by sufficiently increasing voluntary private savings. Furthermore, we find that the savings gap is 60 percent lower for the individuals who paid into mandatory pensions in the year before retirement than for those who did not. While we find that people pay more into a private pension scheme if their mandatory contribution rate is low, these private contributions do not fully compensate for the lack of mandatory pension savings. The results support improved retirement readiness for those enrolled in mandatory pension plans.
Our study provides evidence of the impact of having high mandatory pension contribution rates, for which the Danish setting is ideal. As such our results are likely to be representative of other similar settings, whereas for future research it would be interesting to study these questions in countries where other pension systems dominate. Indeed, it can be argued that saving too much may be damaging as well. Forcing people to save too much may ultimately reduce consumption and thereby negatively impact the individual. Such comparisons would be an interesting avenue to study for further research. In our setting, we find that individuals who have been forced to increase pension savings the most have responded by reducing consumption compared to a control group with stable pension savings. On top of that they accumulate less wealth and save less into their bank account.
It would also be interesting to compare the differences in outcomes across pension systems that force people to save for retirement and systems where people are automatically enrolled but can opt out later. This is something our data do not allow us to do, and we thus leave this for future research. Our results, however, show that people forced to save for retirement do not take action to remediate this by increasing borrowing or lowering other types of savings in full proportion to the increase in mandatory savings. If that was the case, mandatory savings would not associate negatively with the savings gap, opposite to what we find in the first part of our analysis. Finally, even when our paper cannot directly compare the costs and benefits of forcing people to save for retirement, as we do not have a welfare criteria, we conclude that the costs in terms of lower consumption and net wealth for people forced to save for retirement seem relatively small in comparison with the benefit of not having to significantly reduce consumption during retirement.
Supplementary material
The supplementary material for this article can be found at https://doi.org/10.1017/S147474722510005X
Acknowledgments
We thank Henrik Yde Andersen, Torben M. Andersen, João Cocco, Henrik Ramlau-Hansen, and Clemens Sialm as well as participants at PeRCent annual conference for comments. We also thank Emil Lucas Juul, Mike Weber, and in particular Nicolas Thomas for research assistance. Linda S. Larsen, Ulf Nielsson, and Jesper Rangvid are at Copenhagen Business School, and are as well affiliated with PeRCent and the Danish Finance Institute. Ulf is also affiliated with the University of Iceland. Mara Nutu is an independent researcher. Linda, Ulf and Jesper acknowledge financial support from PeRCent. Emails: Linda: lsl.fi@cbs.dk (corresponding author), Ulf: un.fi@cbs.dk, Mara: mara.nutu@outlook.com, and Jesper: jr.fi@cbs.dk.


 Open access