


INTRODUCTION
The building of a radiocarbon (14C) calibration curve depends on the robust connection of atmospheric 14C ages to calendar ages. This is best done by 14C measurements in tree rings, as they take up carbon directly from the atmosphere and can be very precisely dated via dendrochronology. IntCal20 is therefore based only upon tree-ring 14C measurements for approximately the last 14,000 years (13,910 calendar yr BP = calendar age relative to the standard year 1950 AD; Reimer et al. Reference Reimer, Austin, Bard, Bayliss, Blackwell, Bronk Ramsey, Butzin, Cheng, Edwards and Friedrich2020 in this issue). These are dated via dendrochronology back to 12,310 calendar yr BP and extended via wiggle-match dating of the tree-ring 14C data simultaneously to curve construction (Heaton et al. Reference Heaton, Blaauw, Blackwell, Bronk Ramsey, Reimer and Scott2020 in this issue). Prior to this period there are only limited sections covered by tree-ring 14C series whereby the relative tree ring counts within each series are known but the absolute age is not. Therefore, the calibration curve is based upon a wider range of sources including speleothems, marine records of corals and foraminifera, and macrofossils all of which need to be dated with other methods. The bulk of the data underlying IntCal20 for the older part (i) do not have the same temporal resolution as the tree-ring data, (ii) contain larger potentially systematic calendar age dating uncertainties and (iii), in the case of speleothem and marine data, do not directly reflect the atmospheric concentrations. These challenges may also filter out some higher frequency components of atmospheric variation. Furthermore, the density of the available data reduces as we extend further back in time and, in some cases, the 14C measurements contain relatively large uncertainties especially when going towards to the limits of the method when 14C has largely decayed from the sample. As a consequence of these various issues, our overall estimate of the calibration curve before 13,910 calendar yr BP is less certain and it does not reflect the high-resolution fine structure that we know from the Holocene period and that we would expect to also be present in the older part. This can lead to biases in the calendar age determination of precisely dated 14C samples for the last ice age. In the following we will discuss how independent comparison data relates to the IntCal20 calibration curve and how IntCal20 relates to the most recent ice-core time scales.
Volcanic Time Markers
There are a number of volcanic eruptions that have very precise 14C ages connected to them. For three of these events there are, in addition, also 14C-independent calendar age estimates connected to them (Table 1). Here we discuss how these 14C age–calendar age relationships compare to IntCal20.
Summary of the dating results of the deposits from three volcanic eruptions and their 14C results. See main text for details and references.

Towada-H Eruption around 15,700 yr Ago
Horiuchi et al. (Reference Horiuchi, Sonoda, Matsuzaki and Ohyama2007) dated two subfossil tree stumps from a forest buried by the ash from the Towada Hachinohe (Towada-H) eruption in the northeastern part of Honshu Island, Japan. Dendrochronological analysis showed that many trees with bark remains were buried at the same time allowing for replicate 14C measurements of the event (Horiuchi et al. Reference Horiuchi, Sonoda, Matsuzaki and Ohyama2007). The combined measurements of the 5 outermost rings of two tree stumps yielded a 14C age of 13,133 ± 33 (1 σ) 14C yr BP. The tephra from the Towada-H eruption has been found in the NEEM Greenland ice core (Bourne et al. Reference Bourne, Abbott, Albert, Cook, Pearce, Ponomareva, Svensson and Davies2016). The tephra layer in the NEEM ice core is dated to 15,656 ± 226 (2 σ) calendar yr BP (= 15,706 ± 226 yr b2k, b2k = calendar date relative to 2000 AD) via ice core layer counting, the Greenland Ice Core Chronology 2005 (GICC05) (Rasmussen et al. Reference Rasmussen, Andersen, Svensson, Steffensen, Vinther, Clausen, Siggaard-Andersen, Johnsen, Larsen and Dahl-Jensen2006, Reference Rasmussen, Abbott, Blunier, Bourne, Brook, Buchardt, Buizert, Chappellaz, Clausen and Cook2013; Svensson et al. Reference Svensson, Andersen, Bigler, Clausen, Dahl-Jensen, Davies, Johnsen, Muscheler, Parrenin and Rasmussen2008). The ice core dating uncertainty represents the maximum counting error (MCE) and is considered to encompass the 95% confidence interval.
Figure 1 shows that ice core age and calibrated 14C age of Towada-H agree within the stated uncertainties. Nevertheless, the most likely ice core age slightly underestimates the 14C dating calibrated with the new IntCal20 calibration curve by about 100 years, in agreement with the results by Adolphi et al. (Reference Adolphi, Bronk Ramsey, Erhardt, Edwards, Cheng, Turney, Cooper, Svensson, Rasmussen and Fischer2018).
Relationship between ice core age (GICC05 time scale) (Rasmussen et al. Reference Rasmussen, Andersen, Svensson, Steffensen, Vinther, Clausen, Siggaard-Andersen, Johnsen, Larsen and Dahl-Jensen2006, Reference Rasmussen, Abbott, Blunier, Bourne, Brook, Buchardt, Buizert, Chappellaz, Clausen and Cook2013; Svensson et al. Reference Svensson, Andersen, Bigler, Clausen, Dahl-Jensen, Davies, Johnsen, Muscheler, Parrenin and Rasmussen2008) and the calibrated 14C age of the Towada-H eruption in Japan (calibrated with the IntCal20 calibration curve).

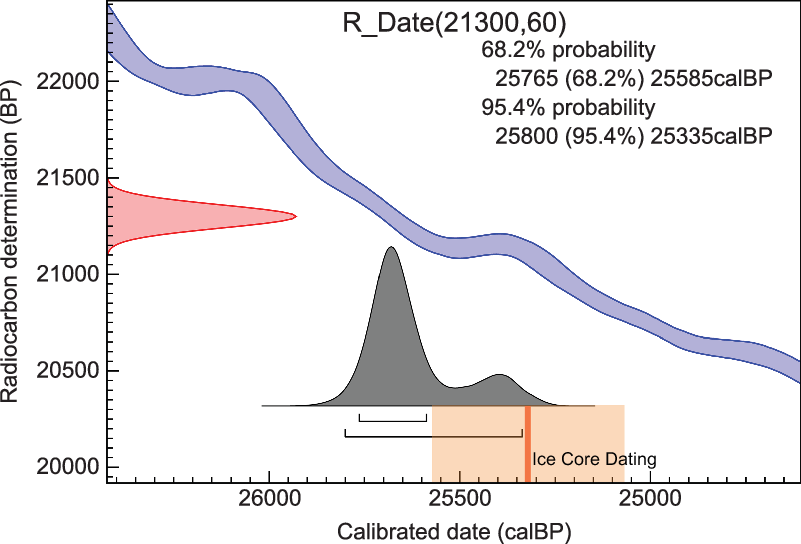
Oruanui Eruption around 25,500 yr Ago
The Oruanui eruption from the Taupo volcano in New Zealand has been, similar to the Towada-H eruption, 14C-dated with high precision on material that was buried by the ash from the eruption (branches and macrofossils) (Vandergoes et al. Reference Vandergoes, Hogg, Lowe, Newnham, Denton, Southon, Barrell, Wilson, McGlone and Allan2013). Eight 14C determinations could be directly connected to the age of the eruption and the error-weighted average is 21,300 ± 60 (1 σ) 14C yr BP (Vandergoes et al. Reference Vandergoes, Hogg, Lowe, Newnham, Denton, Southon, Barrell, Wilson, McGlone and Allan2013). Similar to Towada-H, tephra from the Oruanui eruption has been found in the West Antarctic Ice Sheet (WAIS) ice core from Antarctica, geochemically identified and thereby linked to its source (Dunbar et al. Reference Dunbar, Iverson, Van Eaton, Sigl, Alloway, Kurbatov, Mastin, McConnell and Wilson2017). It has been found at a depth of 2660.3 m, which corresponds to an age of 25,318 ± 250 calendar yr BP (Sigl et al. Reference Sigl, Fudge, Winstrup, Cole-Dai, Ferris, McConnell, Taylor, Welten, Woodruff and Adolphi2016; Dunbar et al. Reference Dunbar, Iverson, Van Eaton, Sigl, Alloway, Kurbatov, Mastin, McConnell and Wilson2017). The WAIS ice core chronology (WD2014) is based on annual layer counting down to a depth of 2850 m (Sigl et al. Reference Sigl, Fudge, Winstrup, Cole-Dai, Ferris, McConnell, Taylor, Welten, Woodruff and Adolphi2016).
Since the Oruanui eruption from Taupo volcano arises from the Southern Hemisphere, the organic material buried by the eruption needs to be calibrated against the SHCal20 curve (Hogg et al. Reference Hogg, Heaton, Hua, Bayliss, Blackwell, Boswijk, Ramsey, Palmer, Petchey and Reimer2020 in this issue). In this time period, the SHCal20 curve is essentially an offset version of the IntCal20 curve with a North-South hemispheric offset, estimated based upon periods of overlap in Northern and Southern tree ring determinations, of approximately 36 ± 27 (1 σ) 14C yr. As shown in Figure 2, the ice core age and IntCal20-calibrated 14C age agree considering their uncertainties. Nevertheless, the most likely age estimates differ by about 350 years suggesting the WAIS ice-core time scale is showing younger ages around 25,500 calBP compared to the data underlying IntCal20.
Calendar age of the Oruanui eruption calibrated with the SHCal20 calibration curve (Hogg et al. Reference Hogg, Heaton, Hua, Bayliss, Blackwell, Boswijk, Ramsey, Palmer, Petchey and Reimer2020 in this issue) in comparison to the ice core age in the WAIS divide ice core (Sigl et al. Reference Sigl, Fudge, Winstrup, Cole-Dai, Ferris, McConnell, Taylor, Welten, Woodruff and Adolphi2016; Dunbar et al. Reference Dunbar, Iverson, Van Eaton, Sigl, Alloway, Kurbatov, Mastin, McConnell and Wilson2017).
Campanian Ignimbrite, around 40,000 yr Ago
The Campagnian Ignimbrite (CI) eruption in Southern Italy has been 14C dated on charred wood embedded in the Yellow Tuff from the eruption (Giaccio et al. Reference Giaccio, Hajdas, Isaia, Deino and Nomade2017). After removal of two outliers, possibly caused by incomplete removal of contaminations, 12 measurements on 7 samples yielded a weighted mean 14C age of 34,290 ± 90 (1 σ) 14C yr BP for the eruption. The date of the CI eruption has been independently determined with the Ar/Ar method (Giaccio et al. Reference Giaccio, Hajdas, Isaia, Deino and Nomade2017). While the individual Ar/Ar dates span a relatively large age range from 38.2 to 41.4 Ar/Ar yr BP the weighted mean age has been determined to 39,850 ± 140 Ar/Ar yr BP considering all known uncertainties and encompassing the 95% confidence interval (Giaccio et al. Reference Giaccio, Hajdas, Isaia, Deino and Nomade2017). Figure 3 compares this 14C-calendar age relationship to the IntCal20 calibration curve. Calibrating the 14C age with IntCal20 yields a 2-σ calendar age range from 39,705 to 39,220 calendar yr BP slightly underestimating the average Ar/Ar age. It does suggest that the dating uncertainties (Ar/Ar and/or 14C dating) are rather underestimated for this example. Alternatively, the IntCal20 calibration curve could exhibit a slight bias here.
Calibrated 14C age of the CI eruption compared to the Ar/Ar age of 39,850 ± 140 calendar yr BP.

In summary, the IntCal20 calibration curve is largely supported by these three examples of volcanic eruptions with very well determined 14C ages combined with independent age assessments. Including these three data points as anchors into the construction of the calibration curve would not have changed the IntCal20 curve significantly. The value of this comparison rather relies in the possible detection of small biases in the IntCal20 curve which might not only be related to systematic offsets e.g. due to a slightly biased reservoir correction of the speleothem 14C data. It might also be connected to the fact that much of the glacial part of IntCal20 does not capture all of the fine structure. This latter issue will be further discussed in the next section where we compare highly resolved floating tree-ring 14C data for the last glacial period that, however, are not directly independently dated.
Floating Trees Connected to Ice-core Time Scales and Their Relationship to IntCal20
As mentioned, the IntCal20 calibration curve is extended into the last glacial period with, compared to tree ring information, less direct data. This includes marine or speleothem data that do not directly reflect atmospheric 14C levels and/or data that has larger uncertainties on their calendar age. This, together with a generally lower data resolution and larger 14C measurement uncertainties, results in a smoother calibration curve prior to ca. 13,900 calendar yr BP.
There are two distinct causes for such increased smoothness, which should not be conflated. Firstly, it is key not to interpret the variability in plots of the IntCal20 mean curve (and probability intervals) as directly representative of our belief in the level of atmospheric variation at any time. Instead, the curve is designed to provide point-wise estimates of past 14C levels to enable accurate calibration of single determinations—this is a subtle but critical difference. This is particularly relevant where the curve is based upon data with uncertain calendar ages as occurs throughout the glacial period; or where constituent data is highly sparse and provides limited information.
The IntCal20 curve is a point-wise mean summary of a large number of posterior realizations obtained via our Bayesian approach to curve creation (Heaton et al. Reference Heaton, Blaauw, Blackwell, Bronk Ramsey, Reimer and Scott2020 in this issue). Each of these realizations represents a distinct plausible atmospheric 14C history based upon the constituent data. Where these data have uncertain calendar ages, each of our Markov Chain Monte Carlo (MCMC) realizations will posit a particular set of potential true calendar ages for them and provide a plausible 14C history on that basis. While each of these individual realizations may show a similar structure to one another, once the differing calendar ages at which that feature may occur are averaged over, it may appear less prominent in the summarized mean calibration curve. This effect is seen most simply when incorporating floating tree-ring sequences into the curve—here, each curve realization may have very similar levels of variation due to the known internal chronology but, once the uncertainty in the absolute age of the sequence is averaged over, it results in a reduced variation in the summarized mean. Similarly, during periods where little data is available on which to base the curve, the IntCal20 mean will tend towards interpolation and hence appear smooth. This should not be interpreted as a belief in atmospheric smoothness, rather that IntCal20 cannot resolve when any variation may have occurred due to limited information.
It is important to stress that this propagation of calendar age uncertainty in constituent data through to IntCal20 is what enables accurate calibration and hence a desired feature. For calibration of single determinations, the point-wise mean and associated uncertainty is sufficient to achieve this and provides the simplest representation of the curve. However, if modelling multiple highly resolved determinations, or if interest is in atmospheric variability, individual curve realizations may provide more insight.
Secondly, and more significant is that, due to the reduced density of data available in the glacial period, we may simply not observe some short-term atmospheric variation. In addition, since both marine records and speleothems provide indirect measurement of atmospheric 14C via processes that may introduce potential smoothing of the atmospheric signal, we risk underestimating some atmospheric variations even if we can identify their existence. As a consequence, the curve may lack some structure that could, if included, provide multimodal calibrated ages for some radiocarbon ages. This issue has been illustrated by Adolphi et al. (Reference Adolphi, Muscheler, Friedrich, Güttler, Wacker, Talamo and Kromer2017) who showed that “floating” tree-ring sequences, i.e. tree-ring sequences without direct absolute age estimates, show 14C structures that are not reflected in the previous calibration curve IntCal13 just prior to 13,900 calendar yr BP (Reimer et al. Reference Reimer, Bard, Bayliss, Beck, Blackwell, Bronk Ramsey, Buck, Cheng, Edwards and Friedrich2013). Such missing structure may have the effect that material from around 14,700 calendar yr BP could incorrectly be calibrated as 500 years more recent (Adolphi et al. Reference Adolphi, Muscheler, Friedrich, Güttler, Wacker, Talamo and Kromer2017).
IntCal20 has aimed to address this by allowing for more variability in the calibration curve and by including the information from multiple floating tree-ring series even though they are not dated via dendrochronology. However, this does not remove the risk of similar missing structure in other regions of the calibration curve if the observations, on which we base the curve, do not exhibit the higher frequency components of the atmospheric variation. In the following we discuss the three sections in the calibration curve where floating tree-ring sequences have been used: the tree-ring sequences from around 14,700 calendar yr BP discussed above; as well as a kauri tree from New Zealand from around 30,000 calendar yr BP; and another NZ kauri from around 42,000 calendar yr BP. We compare the resultant curve in each time period to the original 14C data from tree rings.
Floating Tree-Ring Records around 14,700 yr Ago
Adolphi et al. (Reference Adolphi, Muscheler, Friedrich, Güttler, Wacker, Talamo and Kromer2017) provide estimates, on the GICC05 ice-core timescale, of the absolute calendar ages of three floating tree-ring sequences from around 14,700 calendar yr BP. However, in order to keep independence between the creation of the IntCal20 timescale and the ice-core timescales, this prior knowledge was not used. Instead all three floating tree-ring sequences were incorporated into IntCal20 with uninformative priors on their absolute ages. Fitted posterior calendar ages were estimated internally during curve construction and entirely determined according to their fit to the rest of the IntCal20 14C data; see Heaton et al. (Reference Heaton, Blaauw, Blackwell, Bronk Ramsey, Reimer and Scott2020 in this issue) for details.
Maintenance of such independence between the timescales enables comparisons to be made between the calendar ages estimates of the various floating trees obtained during IntCal construction and the ice-core based estimates. Such comparisons provide useful information on the synchroneity of the 14C and ice-core timescales as well as potential discrepancies worthy of further study.
The three floating tree-ring series have 14C ages in the range from about 12,200 to 12,500 14C yr BP (Adolphi et al. Reference Adolphi, Muscheler, Friedrich, Güttler, Wacker, Talamo and Kromer2017). The possible calendar ages could be obtained via calibrating the data to the IntCal13 calibration curve. Additional information on possible placements can be obtained from 10Be measurements in ice cores as 14C and 10Be are both cosmogenic isotopes produced by similar processes in the atmosphere. For this purpose the production signal inferred from the ice core 10Be data can be translated into an atmospheric 14C signal via carbon cycle modelling (Beer et al. Reference Beer, Siegenthaler, Bonani, Finkel, Oeschger, Suter and Wölfli1988). Via the common production rate signal the floating 14C records can be aligned with the ice-core time scale (Adolphi et al. Reference Adolphi, Muscheler, Friedrich, Güttler, Wacker, Talamo and Kromer2017). Figure 4 shows the comparison of IntCal13, IntCal20 and the floating tree data according to the best placement inferred by Adolphi et al. (Reference Adolphi, Muscheler, Friedrich, Güttler, Wacker, Talamo and Kromer2017) (darker colors) and the floating 14C records according to the best fit to the other data underlying IntCal20 (lighter colors).
Comparison of IntCal13 (gray band) (Reimer et al. Reference Reimer, Bard, Bayliss, Beck, Blackwell, Bronk Ramsey, Buck, Cheng, Edwards and Friedrich2013), IntCal20 (black) (Reimer et al. Reference Reimer, Austin, Bard, Bayliss, Blackwell, Bronk Ramsey, Butzin, Cheng, Edwards and Friedrich2020 in this issue) and the placement of the three floating tree-ring series according to Adolphi et al. (Reference Adolphi, Muscheler, Friedrich, Güttler, Wacker, Talamo and Kromer2017) (darker colors, “GICC05”) and according to the best fit to the other data going into IntCal20 (lighter colors, “IntCal20”). Only data measured at ETH Zurich is shown. The gray lines show 10 individual realizations of the curves underlying IntCal20.

Figure 4 shows that IntCal20 captures more of the typical variability that we know from e.g. the Holocene period and that is indicated in the floating tree-ring data. From ice core 10Be data we know that this typical production-related variability should also be present throughout the last glacial period (e.g. Wagner et al. Reference Wagner, Beer, Masarik, Muscheler, Kubik, Mende, Laj, Raisbeck and Yiou2001; Adolphi et al. Reference Adolphi, Muscheler, Svensson, Aldahan, Possnert, Beer, Sjolte, Bjorck, Matthes and Thieblemont2014). Figure 4 also shows that the method to produce IntCal20 still leads to some smoothing, i.e. it reduces the amplitude of 14C age-calendar age variations as shown by the tree-ring data. In part, this is likely a consequence of the presence of marine and speleothem based 14C data in this time period and also used in IntCal20 construction. These are typically smoother and do not exhibit the same level of variation seen in the floating tree-ring sequences. However, we also observe the effect discussed earlier whereby the plotted IntCal20 mean curve has integrated the floating tree-ring sequences over their range of potential calendar ages meaning the variability is reduced in the consequent point-wise summary. While the individual curve realizations obtained by the MCMC method retain more of the full structure of the tree-ring 14C data the average of all curves does not since the time scale uncertainties lead to a smoothing in the averaging process. It is therefore recommended to use the individual IntCal realizations for solar activity or carbon cycle studies, but also for wiggle-matching of highly resolved sequences of 14C-dates, as their amplitudes better represent the real variability, at least during periods where the IntCal curve is based on sequences of high quality data with robust relative or incremental age control.
The inclusion of the floating tree-ring data into IntCal20 eliminates to a large extent possible calibration biases that one could possibly obtain using IntCal13. The large 14C age drop and reversal around 14,700 calendar yr BP coincides with the rapid warming into the Bølling/Allerød period corresponding to the Greenland Interstadial 1 (Rasmussen et al. Reference Rasmussen, Andersen, Svensson, Steffensen, Vinther, Clausen, Siggaard-Andersen, Johnsen, Larsen and Dahl-Jensen2006). The floating tree-ring data indicates that 14C ages of 12,300 14C yr BP could be obtained for this climate transition. However, with IntCal13 the calibrated ages for this event would be about 500 years too young. Even though not capturing the complete amplitude of 14C age variability, IntCal20 will likely lead to a non-zero calendar age probability around 14,750 calendar yr BP for such samples, especially considering that such samples typically have dating uncertainties larger than 50 years. We therefore recommend researchers to recalibrate and update their age models with IntCal20 in cases that the results critically depend on the 14C dating of events between 14,000 and 15,000 years ago.
Floating Tree-Ring Records around 30,000 yr Ago
Turney et al. (Reference Turney, Palmer, Bronk Ramsey, Adolphi, Muscheler, Hughen, Staff, Jones, Thomas and Fogwill2016) reported on a 2000-yr-long floating tree-ring 14C record from kauri trees from New Zealand. The 14C variations in this record could also be linked to ice core 10Be data. However, the ice core dating around 30,000 calendar yr BP includes relatively large uncertainties since layer counted time scales add more uncertainty the longer the counted time scale is. The Greenland ice-core time scale (GICC05) contains about 1000 uncertain years around 30,000 calendar yr BP (Svensson et al. Reference Svensson, Andersen, Bigler, Clausen, Dahl-Jensen, Davies, Johnsen, Muscheler, Parrenin and Rasmussen2008). This implies that, even though an unequivocal link has been found, the direct transfer of the ice-core time scale to the floating tree-ring 14C series does not help to improve the calibration curve. However, as for the three floating tree-ring sequences described in the previous section, the kauri data can be incorporated alongside the existing 14C data from macrofossils, speleothems and foraminifera around this period in curve construction, simultaneously estimating their calendar ages using information from the other data. This permits us to add truly atmospheric and high resolution 14C data to the calibration curve (Reimer et al. Reference Reimer, Austin, Bard, Bayliss, Blackwell, Bronk Ramsey, Butzin, Cheng, Edwards and Friedrich2020 in this issue). This is of particular interest around 30,000 calendar yr BP since IntCal13 for that period is based on strongly disagreeing data and largely followed the macrofossil data from Lake Suigetsu (Reimer et al. Reference Reimer, Bard, Bayliss, Beck, Blackwell, Bronk Ramsey, Buck, Cheng, Edwards and Friedrich2013). Since the publication of IntCal13, the calibration curve for this period has been confirmed by new 14C data from speleothems from Hulu Cave in China (Cheng et al. Reference Cheng, Edwards, Southon, Matsumoto, Feinberg, Sinha, Zhou, Li, Li and Xu2018) and the floating kauri 14C record agrees well with the latter two records (Figure 5).
Atmospheric 14C variability (expressed as per mille Δ14C, which is 14C/12C corrected for fractionation and decay relative to a standard, denoted Δ in Stuiver and Polach [Reference Stuiver and Polach1977]) around 30,000 calendar yr BP. The figure shows the comparison of IntCal13 (Reimer et al. Reference Reimer, Bard, Bayliss, Beck, Blackwell, Bronk Ramsey, Buck, Cheng, Edwards and Friedrich2013), IntCal20 (black lines, Reimer et al. Reference Reimer, Austin, Bard, Bayliss, Blackwell, Bronk Ramsey, Butzin, Cheng, Edwards and Friedrich2020 in this issue) and the kauri Δ14C data (Turney et al. Reference Turney, Palmer, Bronk Ramsey, Adolphi, Muscheler, Hughen, Staff, Jones, Thomas and Fogwill2016) calibrated onto the 14C data underlying IntCal20. The gray lines show 10 individual realizations of the curves going into IntCal20.

Floating Tree-Ring Records around 42,000 yr Ago
Another, almost 1500-yr-long, floating 14C sequence from kauri trees with 14C ages in the range of 40,000 14C yr BP (Mangawhai sequence) has been published by Turney et al. (Reference Turney, Fifield, Hogg, Palmer, Hughen, Baillie, Galbraith, Ogden, Lorrey and Tims2010). This floating chronology shows a relatively stable atmospheric Δ14C level for about 500 years that is followed by an increase in Δ14C of about 200 per mille over the subsequent 800 years. This feature is reminiscent of the increase in the production rates caused by the Laschamps geomagnetic field minimum (Muscheler et al. Reference Muscheler, Beer, Wagner, Laj, Kissel, Raisbeck, Yiou and Kubik2004). In fact, matching the 14C structure from the floating trees with the 10Be variations in the Greenland ice cores provided an ice core age of about 42,500 calendar yr BP for the start of the floating Mangawhai sequence which is about 1000 yr younger than the placement according to the available independent 14C calibration data around 43,500 calendar yr BP (Muscheler et al. Reference Muscheler, Adolphi and Svensson2014b) (Figure 6). This 10Be-based ice core placement has also been put into question by the new U/Th-dated speleothem data from Hulu Cave (Cheng et al. Reference Cheng, Edwards, Southon, Matsumoto, Feinberg, Sinha, Zhou, Li, Li and Xu2018) that leads to a good agreement between Hulu and kauri 14C data when placing the tree ring chronology about 1000 years older. This, however, leads to differences between modeled 10Be-based atmospheric 14C variability and measured 14C. Part of the differences can be attributed to ice-core time scale uncertainties that can, however, explain only about 250 ± 250 years of the difference (Adolphi et al. Reference Adolphi, Bronk Ramsey, Erhardt, Edwards, Cheng, Turney, Cooper, Svensson, Rasmussen and Fischer2018). It rather appears that the 10Be-based 14C and IntCal record show differences that are not only production related. For example, the amplitude of the atmospheric 14C increase (expressed as Δ14C) around Laschamps is larger in the 14C data than in the modeled 10Be record. Furthermore, the Δ14C increase starts earlier and lasts longer in the 14C data compared to the changes indicated by the ice core 10Be record. The most likely explanation for these differences is possible influences of the carbon cycle on atmospheric 14C. A reduced ocean uptake of 14C can explain larger amplitudes of production-induced changes in Δ14C and possible changes in the carbon cycle could lead to 14C variability that cannot be seen in ice core 10Be data. Due to these reasons we conclude that the ice core placement of the floating kauri sequence is likely too young. As for the other floating tree-ring sequences, this kauri data was incorporated into IntCal20 with an uninformative prior on its calendar age. Posterior calendar ages were estimated alongside curve construction according to fit to the rest of 14C data. This approach placed the tree-ring sequence around 43,000 calendar yr BP and IntCal20 reflects features of the kauri data in this period.
Comparison of IntCal20 (the two black lines indicate the 1-σ range), Hulu Cave 14C data (blue) and kauri 14C data (red) according to the best placement with respect to the data underlying IntCal20. The lower panel shows the kauri 14C data (purple) according to the best fit to the production signal as inferred from 10Be in Greenland ice cores (green line; Muscheler et al. Reference Muscheler, Adolphi and Svensson2014b). The vertical offset between the two kauri placements is due to the different decay correction depending on the different age placements. The vertical placement of the modeled 10Be-based Δ14C depends on normalization and carbon cycle configuration, i.e. only the relative variations can be robustly interpreted. The gray lines show 10 individual realizations of the curves underlying IntCal20.

Time Scale Transfer between IntCal20 and Ice-Core Time Scales
The radiocarbon (IntCal) time scale is of fundamental importance for assessing cultural and climatic changes in the correct temporal context. With respect to climate change the ice core records from Greenland and Antarctica provide the other key temporal context that is often used when assessing 14C dated records in comparison to, for example, the rapid climate changes during the last glacial period. Presently, these two key time scales are based on different methods and the ice-core time scales (e.g. GICC05 or WD2014) do not directly enter into the context of creating an IntCal calibration curve. This, however, also implies that systematic offsets between the IntCal and the ice-core time scales can lead to a wrong assessment of temporal relationships unless potential systematic offsets between these time scales are corrected for. This issue can be addressed by identifying and synchronizing the common production rate variations, i.e. by using the signal from the global cosmic ray irradiation to compare 14C and ice core radionuclide records. In the following we will review the results from this approach comparing the Greenland ice-core time scale (GICC05) with the IntCal20 time scale for the Holocene and the last glacial period, separately.
Holocene
The common production rate variations in 14C (IntCal) and in 10Be and 36Cl (as measured in ice cores) can be directly compared only after correction for systematic differences due to the different geochemical behavior. Common variability, if correctly identified, can then be used to tie the ice-core time scale to the IntCal time scale or vice versa. For the Holocene period this task is rather straightforward. The 14C variations are temporally well constrained via dendrochronology and the 14C data are of generally high quality. Furthermore, it is rather straightforward to translate e.g. 10Be variations in ice cores into atmospheric 14C variability by using the 10Be signal as production input for the 14C modeling with carbon cycle models. Major changes in the carbon cycle are not expected and also the radionuclide signal in the ice cores is not very strongly affected by climatic changes. This comparison of ice core radionuclide data and 14C in tree rings has led to a time scale transfer function that can be used to relate Greenland ice core data (on the GICC05 time scale (Vinther et al. Reference Vinther, Clausen, Johnsen, Rasmussen, Andersen, Buchardt, Dahl-Jensen, Seierstad, Siggaard-Andersen and Steffensen2006)) to 14C-dated records. It indicates that GICC05 has the tendency to accumulate too many years (about 65) over the Holocene period (Adolphi and Muscheler Reference Adolphi and Muscheler2016; Muscheler et al. Reference Muscheler, Adolphi and Knudsen2014a, the transfer function can be downloaded here: https://www.clim-past.net/12/15/2016/cp-12-15-2016-supplement.zip). In addition, the rapid 14C increases around 774 and 993 AD have lead to a very precise matching of 14C and ice-core time scales for the past 2500 years which enabled the detailed comparison of volcanic forcing (as inferred from ice core sulfate data) and climate reaction (as inferred from tree-ring data) (see updated NS1-2011 Greenland chronology for the past 2500 years as discussed by Sigl et al. Reference Sigl, Winstrup, McConnell, Welten, Plunkett, Ludlow, Büntgen, Caffee, Chellman and Dahl-Jensen2015). The same approach has shown that the WAIS divide ice-core time scale (WD2014) shows only very small deviations from the tree ring time scale for the past 11,000 years (Sigl et al. Reference Sigl, Fudge, Winstrup, Cole-Dai, Ferris, McConnell, Taylor, Welten, Woodruff and Adolphi2016). IntCal20 includes significantly more 14C data for the Holocene period than IntCal13. This has mostly improved the fine structure for limited sections of the IntCal calibration curve (e.g. the most recent 1000 years). However, the underlying tree-ring time scale has not changed for the Holocene period and, therefore, we do not expect that the time scale transfer function will deviate significantly for IntCal20 compared to IntCal13.
Ice Age
The linking of ice core and IntCal time scale is much more challenging for the last glacial period. On the one hand the ice core 10Be and 36Cl data can be influenced by atmospheric circulation and deposition changes which are not always easy to identify and correct for. Similarly, carbon cycle changes could potentially influence the atmospheric 14C concentration much more than during the Holocene. Furthermore, IntCal20 is the product of a combination of a range of data sets so that the origin of 14C variability might not always be robustly identifiable. For example, periodic offsets between differing data sets could lead to oscillations in IntCal in between the data, i.e. lead to structures that are not present in any data set alone. Furthermore, as mentioned above, the 14C data has lower resolution and larger uncertainties making it more challenging to identify production rate variations in the data.
For the period preceding 13,910 cal BP, where the continuous tree-ring 14C data on their own become insufficient to estimate the curve precisely, the time scale of the IntCal20 calibration curve is largely based upon 14C measurements on U/Th-dated samples. While this is clear for the case of the directly U/Th-dated samples such as corals and speleothems, it also applies to data seemingly not directly connected to U/Th dating. The atmospheric (macrofossil) samples from Lake Suigetsu cannot solely be dated via varve counting since not all sections of the sediments show well-identifiable varves. Therefore, to obtain their calendar ages, the 14C data from Lake Suigestsu has partly also been “wiggle-matched” to U/Th-dated 14C data from Hulu Cave (Bronk Ramsey et al. Reference Bronk Ramsey, Staff, Bryant, Brock, Kitagawa, van der Plicht, Schlolaut, Marshall, Brauer and Lamb2012, Reference Bronk Ramsey, Heaton, Schlolaut, Staff, Bryant, Brauer, Lamb, Marshall and Nakagawa2020 in this issue). Calendar age estimates for the non-varved sections from the Cariaco basin and the Iberian and Pakistan margin cores were obtained from stratigraphic tuning of palaeoclimate proxies to the high resolution and precisely U/Th dated δ18O Hulu Cave record (Bard et al. Reference Bard, Ménot, Rostek, Licari, Böning, Edwards, Cheng, Wang and Heaton2013; Heaton et al. Reference Heaton, Bard and Hughen2013; Hughen and Heaton Reference Hughen and Heaton2020 in this issue).
Adolphi et al. (Reference Adolphi, Bronk Ramsey, Erhardt, Edwards, Cheng, Turney, Cooper, Svensson, Rasmussen and Fischer2018), therefore, took the approach to compare the Greenland radionuclide records to the individual records underlying IntCal to assess the temporal relationship between Greenland ice-core time scale (GICC05) and the U/Th time scale underlying IntCal. Starting from the tree-ring-based data, where no significant time scale offsets can be observed around 13,000 cal BP, there are two additional distinct features that can be used for this time scale comparison. One is situated around 22,000 calendar yr BP possibly related to a longer lasting solar minimum or a period of decreased geomagnetic dipole field intensity. The other one is related to the Laschamps geomagnetic field minimum around 42,000 calendar yr BP. In between these fixed points, the time scale offset can be assessed with a Bayesian approach by including the ice core layer counting uncertainty (Figure 7; Adolphi et al. Reference Adolphi, Bronk Ramsey, Erhardt, Edwards, Cheng, Turney, Cooper, Svensson, Rasmussen and Fischer2018). Since the study of Adolphi et al. (Reference Adolphi, Bronk Ramsey, Erhardt, Edwards, Cheng, Turney, Cooper, Svensson, Rasmussen and Fischer2018) additional U/Th-dated 14C data from the Hulu Cave speleothems has been published (Cheng et al. Reference Cheng, Edwards, Southon, Matsumoto, Feinberg, Sinha, Zhou, Li, Li and Xu2018). These new data do not significantly affect the time scale transfer function as the new Hulu data support the results by Adolphi et al. (Reference Adolphi, Bronk Ramsey, Erhardt, Edwards, Cheng, Turney, Cooper, Svensson, Rasmussen and Fischer2018) within uncertainties (see yellow markers in Figure 7).
Time scale transfer function between U/Th-dated 14C data (effectively the IntCal20 time scale) and the Greenland ice-core time scale (GICC05, Svensson et al. Reference Svensson, Andersen, Bigler, Clausen, Dahl-Jensen, Davies, Johnsen, Muscheler, Parrenin and Rasmussen2008). In black is the time scale transfer-function with the uncertainties in dark gray (1 σ) and light gray (2 σ). The maximum Holocene offset of 65 years is visible to the right at 11,500 calendar yr BP. Modified from Adolphi et al. (Reference Adolphi, Bronk Ramsey, Erhardt, Edwards, Cheng, Turney, Cooper, Svensson, Rasmussen and Fischer2018). We note, that the attribution of the SO4 peak in GISP2 to CI is purely based on the chronological agreement within uncertainties, and hence, tentative. The yellow markers show the time scale offsets inferred from the comparison of ice core radionuclide data and the Hulu Cave 14C data including the new data published by Cheng et al. (Reference Cheng, Edwards, Southon, Matsumoto, Feinberg, Sinha, Zhou, Li, Li and Xu2018).
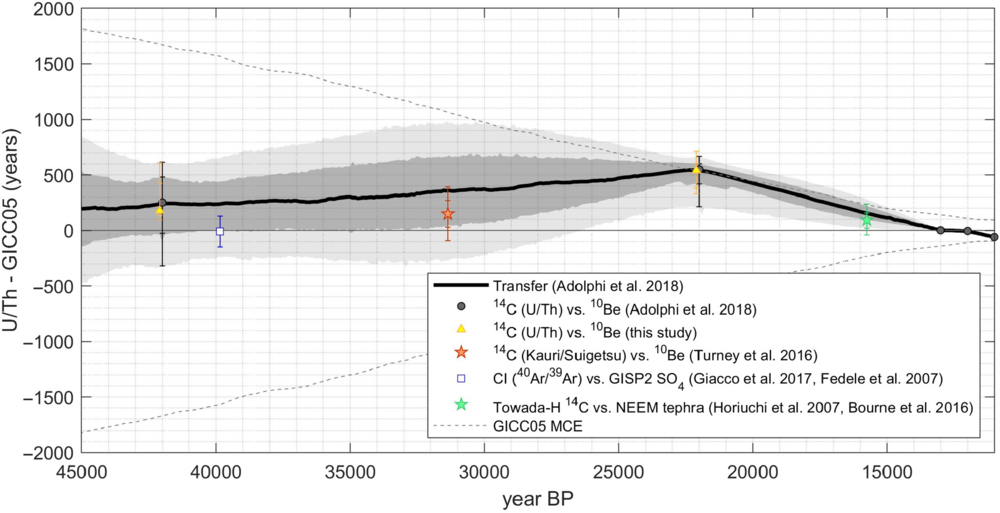
The volcanic time markers mentioned above also support the transfer function. The dating of Towada-H around around 15,700 calendar yr BP shows agreement between IntCal and GICC05 within uncertainty but it might hint at a 100 yr too young GICC05 age. Also, the transfer function shown in Figure 7 suggests a potential underestimation of the ice core age of the eruption. Oruanui cannot be discussed in this context since its tephra has only been found in an Antarctic ice core. However, in the GISP2 ice core a SO4 spike (depth between 2252–2252.2 m in the GISP2 ice core) has tentatively been attributed to the CI eruption. If correctly assigned it supports the agreement of GICC05 and IntCal around 40,000 calendar yr BP (Fedele et al. Reference Fedele, Giaccio, Isaia, Orsi, Carroll, Scaillet, Grattan and Torrence2007; Giaccio et al. Reference Giaccio, Hajdas, Isaia, Deino and Nomade2017).
These results effectively provide a time scale transfer-function between GICC05 and IntCal20 provided that the link between 14C age and calendar age is accurate (for example, slight offsets in the speleothem reservoir correction affecting IntCal20 would still remain when comparing 14C-dated records with the ice-core time scale). In spite of such possibly un-quantified remaining uncertainties, this time-scale transfer should be considered when 14C-dated records and the Greenland ice core data on the GICC05 time scale are compared. The time-scale comparison/transfer function can be downloaded from the supplemental materials for Adolphi et al. (Reference Adolphi, Bronk Ramsey, Erhardt, Edwards, Cheng, Turney, Cooper, Svensson, Rasmussen and Fischer2018).
SUMMARY
The global cosmic-ray signal and/or widely spread volcanic deposition signals can be used to compare and synchronize different time scales. For IntCal20 this information provides valuable information that can be used for assessing the reliability of the calibration curve. This information largely supports IntCal20 and, in addition, it allows the assessment of systematic time scale offsets between 14C-dated and ice core records. This information is crucial for a reliable assessment of environmental changes when such records are compared. The published IntCal20 mean curve (and probability intervals) represent the point-wise summary of many possible realizations of the 14C age-calendar age relationship in the past. These summary values are designed to enable accurate calibration of single sample determinations, however, they do not necessarily reflect atmospheric variation with the process of averaging leading to some smoothing in the point-wise mean curve. It is therefore recommended to use the individual IntCal20 realizations for solar activity and/or carbon cycle studies as their amplitudes better represent the real variability. Ongoing and future work on tree-ring 14C measurements for the last glacial period on, for example, kauri trees has the potential to reduce the calibration uncertainties significantly. Such data can eliminate the presently still required reservoir age corrections of speleothem and marine 14C data and reduce the relatively large uncertainties of the atmospheric data from the Suigetsu macrofossil record. Similarly, improved ice-core dating and a better understanding of the climate influences on radionuclide data will allow us to better pinpoint the presently existing differences between ice core and IntCal time scales. High-quality 14C data together with Greenland and Antarctic radionuclide data have the potential to create a globally consistent time scale enabling robust investigations of archeology, evolution, regional climate change and their interactions in a global context.
ACKNOWLEDGMENTS
This work was supported by the Swedish Research Council (grant DNR2013-8421 to RM). FA was supported through a grant by the Swedish Research Council (Vetenskapsrådet no. 2016-00218). TJH was supported by the Leverhulme Trust (RF-2019-140\9). CBR was partially supported through the UK Natural Environment Research Council (NERC) Radiocarbon Facility (NRCF010002).


 Open access